SCENARIO
The first step is to analyze and present the climate we would like to work on. In a way, our building performance strategies which we are going to use to optimize our project have to do with the selected climate. Our project is located in Athens, the capital of Greece. The reason we are focusing on this specific city is because we would like to focus our research on Mediterranean areas with sunny, hot, and dry summer and rainy, mind and, wet winter, to understand how to reduce the cooling requirements, which we suppose will be the most critical value for mild climates with extreme summer conditions to reduce with passive optimization systems.
This will also make sense for the green roof infrastructure which possibly requires a higher water demand during the summer when the precipitation is much lower than in the winter. The selection of native species is necessary to reduce water consumption. The cooling requirements of the building will probably be much higher in the summer months and almost zero in winter while we assume a lot of heat losses from the building envelope. Towards this direction, after an initial thermal analysis, we have to do the diagnosis and probably focus either on the building envelope or the solar radiation factors.
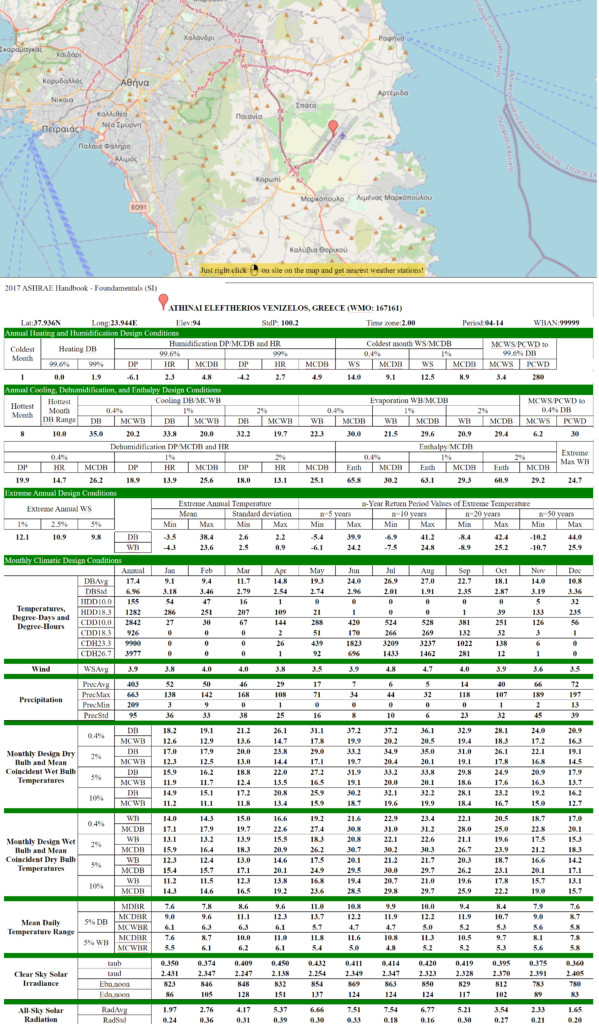
The climate in Athens is mild and generally warm and temperate. The winters are rainier than the summers. According to Köppen and Geiger, this climate is classified as Csa.

ACOUSTIC PERFORMANCE ANALYSIS
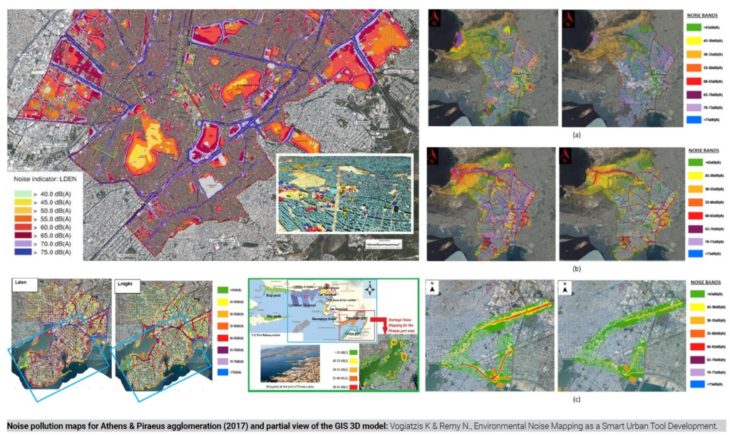
One of the major environmental problems in contemporary societies is noise pollution, as it is well-known that noise adversely affects both psychological and psychological human health and well-being.
In order to declare the acoustic performance of our project, we are going to undertake an Acoustic Performance Analysis, including the acoustic insulation program, acoustic analysis, and calculation of reverberation time. Then we are going to compare a baseline case and an optimized case, depending on the materiality that we work with. In this case, we are going to use different strategies such as insulating panels, and different acoustic absorbents for the ceiling and walls to compare them through the online Acoustic Analysis tool, called DAMPA SOFTWARE.
So firstly we have to conduct research, regarding the reverberation time in secs that we would like to achieve and explain the reason why we choose this or another interior finishing system in terms of acoustics. Then we are going to prepare an acoustic plan which is simply a drawing finishing plan with a color legend on the side to illustrate where the different acoustic panels would be. Sound is transmitted through different mediums. Air is one of them. Sound waves vibrate at different frequencies and provide different characteristics. The main goal is to minimize disturbance noise, and in order to do so, we have to shield ourselves from the outside by placing sufficient sound insulation on the outer shell of the building.
Sound is transmitted through:
o airborne transmission
o impact noise
INTENSITY & TONE
– Intensity (dB): Volume of how loud something is being perceived and how close we are to that sound.
– Tone: pitch of the sound (hard or lower tone) – how frequent is the hertz
TYPES
A. REFLECTION – sound is redirected to the sound source itself
B. DIFFUSION – Distorted, bounced on several paths – create an overall noise
C. ABSORPTION – Bounce back but with a low threshold – you can’t hear – is clear sound
D. DIFFRACTION – Found an element on the edge and spread.
SOUND TRANSMISSION
– Direct sound path
– Indirect through a reflective material surface (concrete with low NRC or 0,05 brick) may reflect more intense sound + 3db reflection. Or with an absorbent material =NRC 0. No indirect transmission paths.
– Create a shadow zone = much lower intensity at the back of the barrier – diffracted sound
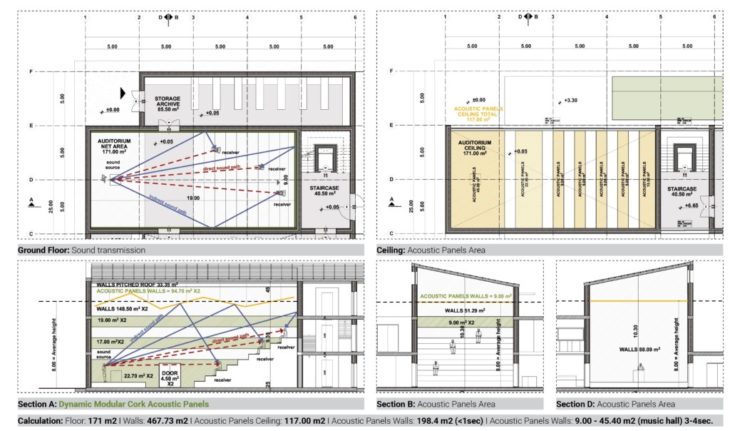
Reverberation time is the time required for the sound to “fade away” or decay in a closed space. Sound in a room will repeatedly bounce off surfaces such as the floor, walls, ceiling, windows, or tables. When these reflections mix, a phenomenon known as reverberation is created. Reverberation reduces when the reflections hit surfaces that can absorb sounds such as curtains, chairs, and even people. In our case, the auditorium is a multifunctional area so we set the threshold:
<1sec. if function as a lecture hall.
3-4sec. if function as a music hall.
By using the materials of a baseline case as a reinforced concrete load-bearing structure with plastered walls and ceiling we check at DAMPA software that the reverberation time is >14sec.
By experimenting with this we select a cast wall with 50mm mineral wool insulation (NRC=0.90) (the most common structure in Athens), reducing the reverberation time to 3-4sec. (which is acceptable for a music hall).

Mass timber is a more reflective material than concrete. Using plaster as a finish material is usually less reflective than using exposed concrete or CLT.
Wood surfaces are naturally reflective with an NRC (Noise Reduction Coefficient) of 0.05-0.15. Absorption may be desirable in spaces where acoustic energy would have a negative impact on occupants, such as in education and healthcare settings.
High levels of sound absorption (NRCs of 0.65–0.90) can be economically achieved by means of strategically placed openings in the ceiling. This allows acoustic energy to pass through the ceiling into acoustically absorptive material hidden in the plenum.
Perforations, reveals, or grooves allow for a percentage of sound energy to pass through the wood ceiling and be absorbed by fiberglass acoustic backing material. In general, the thicker the fiberglass backing (density, 1? to 6? thick) the greater absorption will be achieved, especially at problematic lower (bass) frequencies.

In our case, as we have designed a mass timber structure we select wood panels with 80 mm spacing as the interior walls of the auditorium.
The reverberation time is reduced to 1.72 (250Hz). Even though the value is totally acceptable, we checked that to provide a favorable acoustical environment you must address both the need to hear and understand speech and the desire to have a pleasant space for music. The recommended reverberation time for the typical lecture hall is 1-1.5 seconds or better than 1. This means that the sound will have completely dissipated after 1-1.5 seconds.
For acoustical purposes, we divide the auditorium into thirds. The front third including the stage or front of the room can be reflective enabling sound to reach the audience. The middle third of the room can be a combination of absorptive and reflective and the back third of the room should be absorptive materials to help reduce the reverberation time and unwanted reflections back into the room.
In our case, we have to lower the value of reverberation time <1sec and for this reason, we have to incorporate absorbing panels: A (very absorbent) to E (reflective)
Categories:
– Porous Absorbents: Fibrous material or Foam
– Resonance Absorbents: mechanical or acoustic oscillation systems
– Individual absorbents: tables, chairs
The most important value to check when selecting the most suitable material is the NRC factor. The Noise reduction coefficient ranges between values 0 – 1 and describes the sound absorption of a material The typical values of common materials are: Brick = 0,05, Cork = 0,70, Mineral Wool = 0,95. This means that 1m2 of material has 95% of that in it to be used to absorb sound. Adaptive, dynamic, modular spaces.
In our case, we use adaptive dynamic cork acoustic panels with an NRC = 0.70.
GREEN ROOF & WATER CONSUMPTION
SCENARIO
The green roof helps the project to be sustainable if executed in the right way.
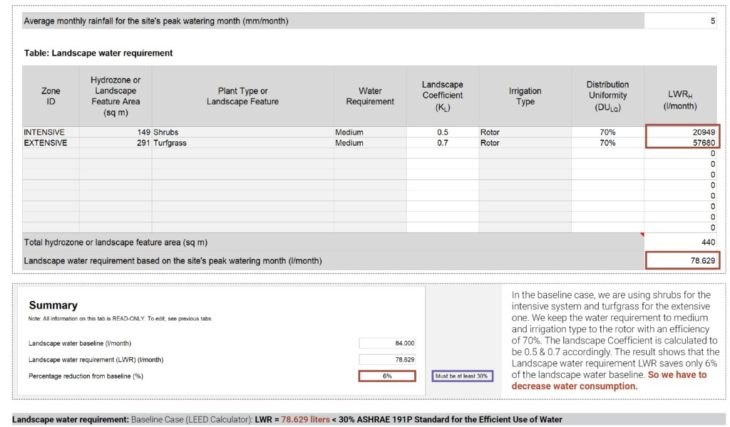
We calculate the water requirement for the vegetation cover of our project located in Athens. Athens driest month is August, with a monthly rainfall of 5mm and a monthly Eto of 200mm.
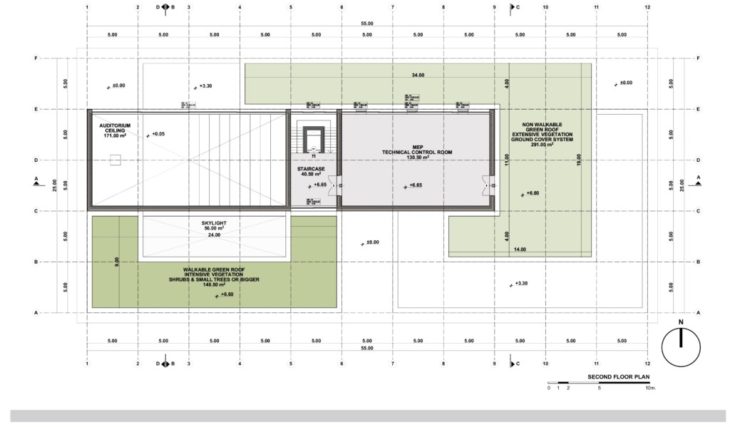
The building has two vegetated terraces that add up to 420sqm and have the following characteristics.
Scenario A
– Intensive green roof: 149sqm of Shrubs landscaping
– Extensive green roof: 291sqm of turf-grass landscaping
Water requirement levels have been set as “medium”.
The considered irrigation type for both terraces is rotor sprinklers – for this case – with an efficiency of 70%.
Which terrace has the higher water consumption?
How much could water consumption be reduced with 100% groundcover such as cacti for the extensive terrace, and drip (pressure compensating), irrigation with an efficiency of 90% to both zones id, so as to be higher than 30% ASHRAE standard?
Scenario B
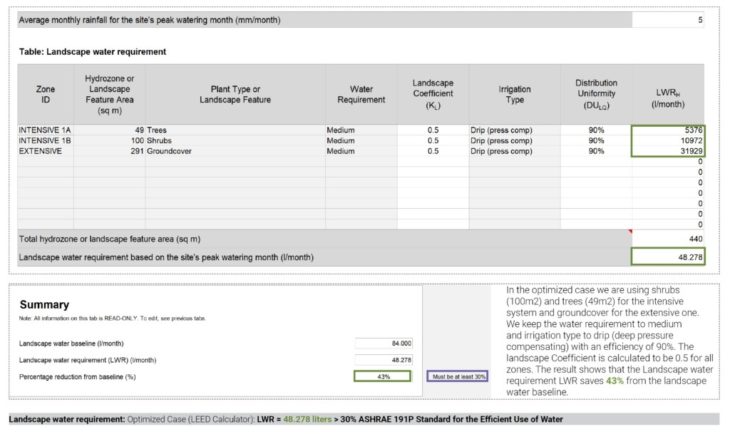
– Intensive green roof: 100sqm of Shrubs & 49sqm Trees landscaping
– Extensive green roof: 291sqm of ground cover landscaping
Water requirement levels have been set as “medium”.
The considered irrigation type for both terraces is rotor sprinklers – for this case – with an efficiency of 70%.
Scenario C
– Intensive green roof: 100sqm of Shrubs & 49sqm Trees landscaping
– Extensive green roof: 291sqm of ground cover landscaping
Water requirement levels have been set as “low” = 0.2, as native species are introduced to reduce the water requirement.
– Reasonable vegetated surface
– Appropriate species selection
– Efficient irrigation system
Through green roof design we achieve:
– Mitigate air pollution
– Reduce building footprint
– Enhance views from the project
– Contribute to the sustainable urban drainage of the city
– Provide areas accessible to the public
– Promote biodiversity
– Reduction of the heat island effect
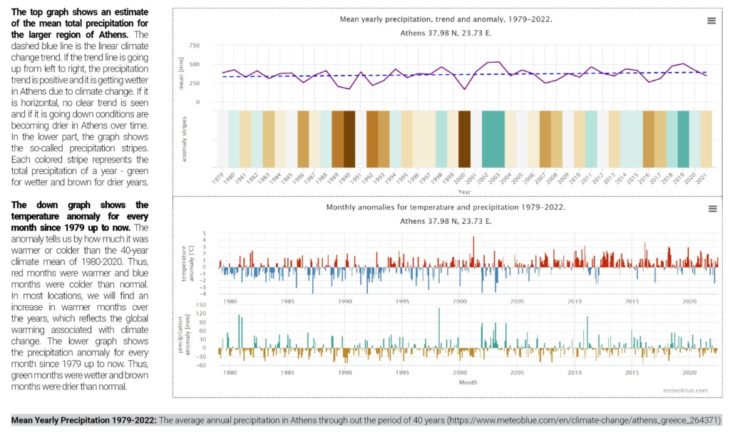
The upper graph shows an estimate of the mean total precipitation for the larger region of Athens. The dashed blue line is the linear climate change trend. If the trend line is going up from left to right, the precipitation trend is positive and it is getting wetter in Athens due to climate change. If it is horizontal, no clear trend is seen and if it is going down conditions are becoming drier in Athens over time. In the lower part, the graph shows the so-called precipitation stripes. Each colored stripe represents the total precipitation of a year – green for wetter and brown for drier years.
The lowest graph shows the temperature anomaly for every month since 1979 up to now. The anomaly tells us by how much it was warmer or colder than the 40-year climate mean of 1980-2020. Thus, red months were warmer and blue months were colder than normal. In most locations, we will find an increase in warmer months over the years, which reflects the global warming associated with climate change. The lower graph shows the precipitation anomaly for every month since 1979 up to now. Thus, green months were wetter and brown months were drier than normal.
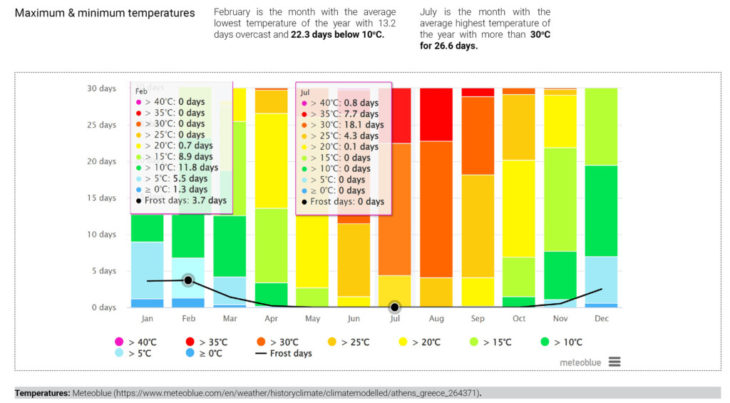
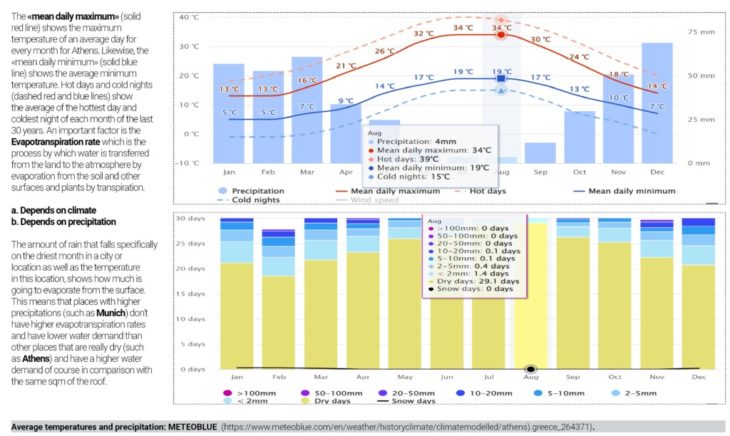
The «mean daily maximum» (solid red line) shows the maximum temperature of an average day for every month for Athens. Likewise, the «mean daily minimum» (solid blue line) shows the average minimum temperature. Hot days and cold nights (dashed red and blue lines) show the average of the hottest day and coldest night of each month of the last 30 years. An important factor is the Evapotranspiration rate which is the process by which water is transferred from the land to the atmosphere by evaporation from the soil and other surfaces and plants by transpiration.
a. Depends on climate
b. Depends on precipitation
The amount of rain that falls specifically on the driest month in a city or location as well as the temperature in this location shows how much is going to evaporate from the surface. This means that places with higher precipitations (such as Munich) don’t have higher evapotranspiration rates and have lower water demand than other places that are really dry (such as Athens) and have a higher water demand of course in comparison with the same sqm of the roof.
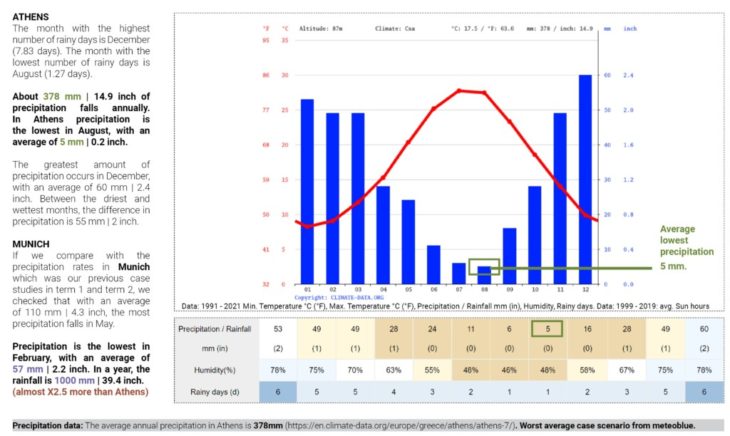
ATHENS
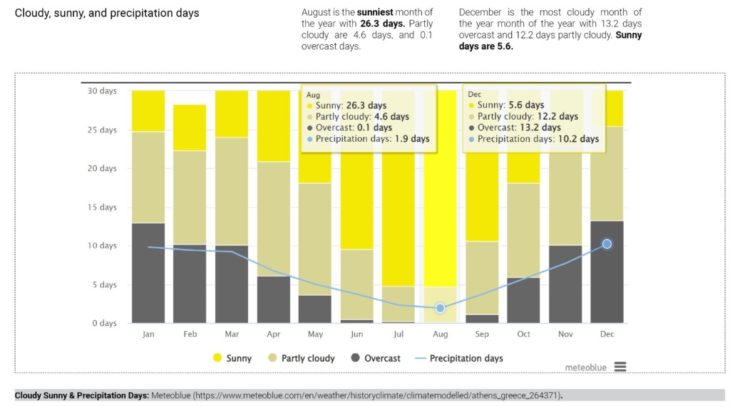
The month with the highest number of rainy days is December (7.83 days). The month with the lowest number of rainy days is August (1.27 days).
About 378 mm | 14.9 inch of precipitation falls annually. In Athens precipitation is the lowest in August, with an average of 5 mm | 0.2 inches.
The greatest amount of precipitation occurs in December, with an average of 60 mm | 2.4 inches. Between the driest and wettest months, the difference in precipitation is 55 mm | 2 inches. If we compare with the precipitation rates in Munich which was our previous case studies in term 1 and term 2, we checked that with an average of 110 mm | 4.3 inches, the most precipitation falls in May.
Precipitation is the lowest in February, with an average of 57 mm | 2.2 inches. In a year, the rainfall is 1000 mm | 39.4 inches.
(almost X2.5 more than Athens)
1. In the baseline case, we are using shrubs for the intensive system and turfgrass for the extensive one. We keep the water requirement to medium and irrigation type to the rotor with an efficiency of 70%. The landscape Coefficient is calculated to be 0.5 & 0.7 accordingly. The result shows that the Landscape water requirement LWR saves only 6% of the landscape water baseline. So we have to decrease water consumption.
2. In the optimized case we are using shrubs (100m2) and trees (49m2) for the intensive system and groundcover for the extensive one. We keep the water requirement to medium and irrigation type to drip (deep pressure compensating) with an efficiency of 90%. The landscape Coefficient is calculated to be 0.5 for all zones. The result shows that the Landscape water requirement LWR saves 43% from the landscape water baseline.
3. In the optimized hi-performance case we are using native species for shrubs (100m2) and trees (49m2) for the intensive system as well as for the groundcover of the extensive one. We reduce the water requirement to low and keep the irrigation type to drip (deep pressure compensating) with an efficiency of 90%. The landscape Coefficient is calculated to be 0.2 for all zones. The result shows that the Landscape water requirement LWR saves 77% from the landscape water baseline.
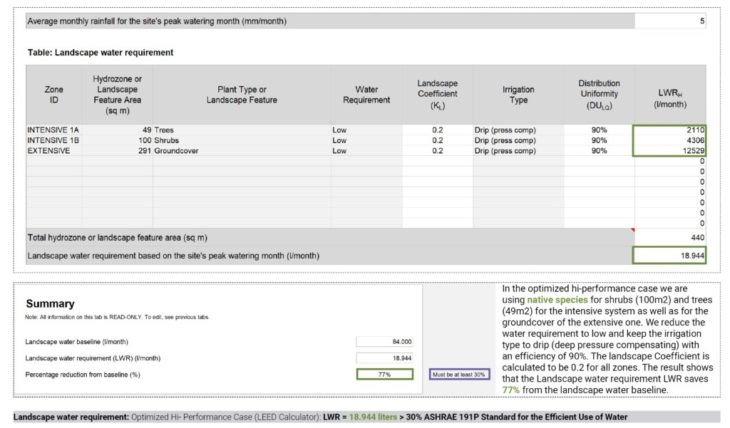
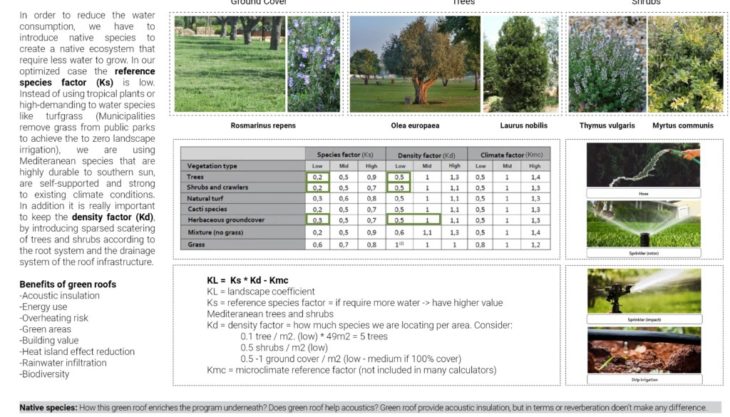
In order to reduce water consumption, we have to introduce native species to create a native ecosystem that requires less water to grow. In our optimized case, the reference species factor (Ks) is low. Instead of using tropical plants or high-demanding water species like turfgrass (Municipalities remove grass from public parks to achieve zero landscape irrigation), we are using Mediterranean species that are highly durable to the southern sun, and are self-supported, and strong to existing climate conditions. In addition, it is really important to keep the density factor (Kd), by introducing a sparse scattering of trees and shrubs according to the root system and the drainage system of the roof infrastructure.
Benefits of green roofs
-Acoustic insulation
-Energy use
-Overheating risk
-Green areas
-Building value
-Heat island effect reduction
-Rainwater infiltration
-Biodiversity
BUILDING PERFORMANCE SIMULATION
DESIGN BUILDER THERMAL ZONES
SCENARIO
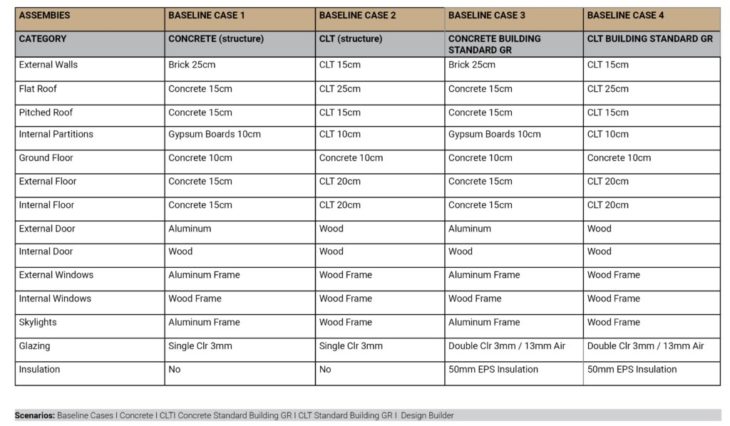
ASSEMBLIES OF 4 BASELINE CASES
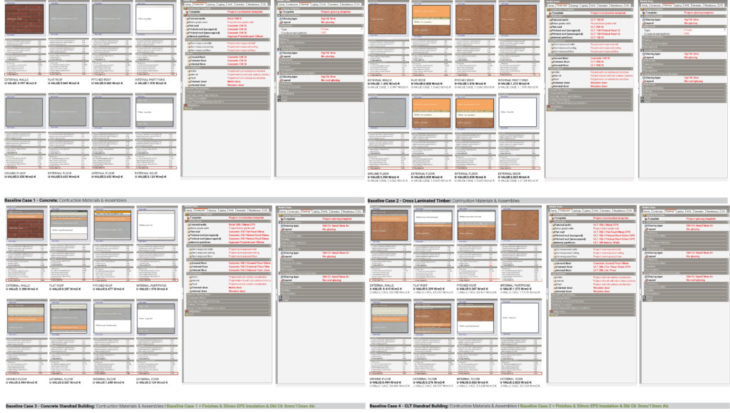
4 BASELINE CASES
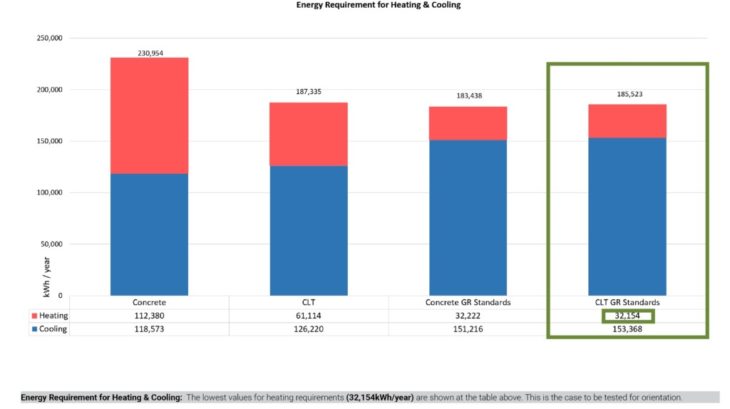
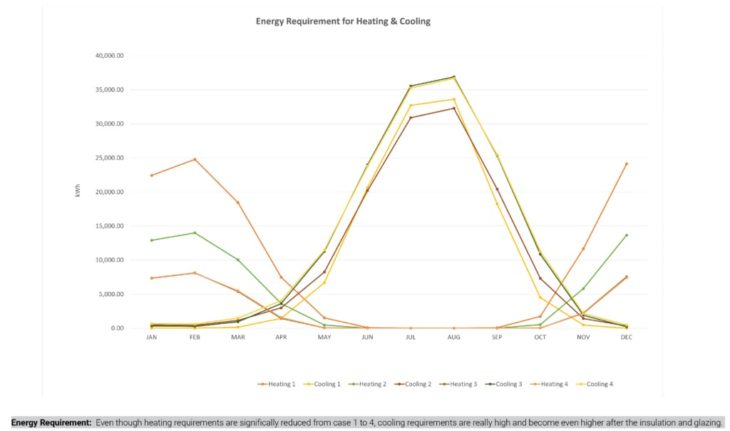
COMBINATION OF RESULTS – ENERGY REQUIREMENT FOR HEATING AND COOLING
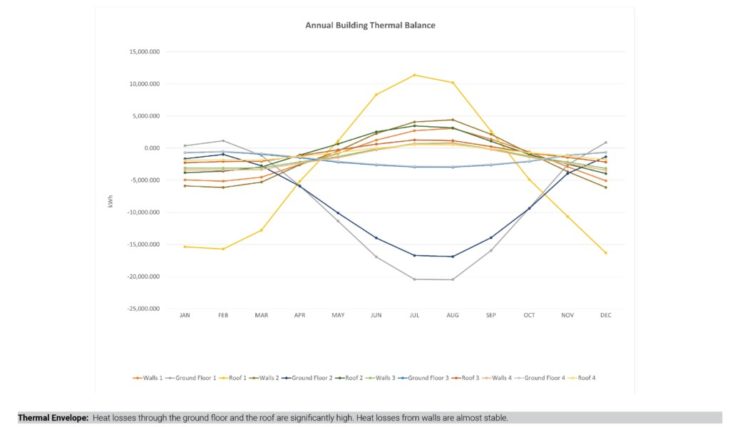
THERMAL ENVELOPE HEAT GAINS AND HEAT LOSSES
MASSING OPTIMIZATION
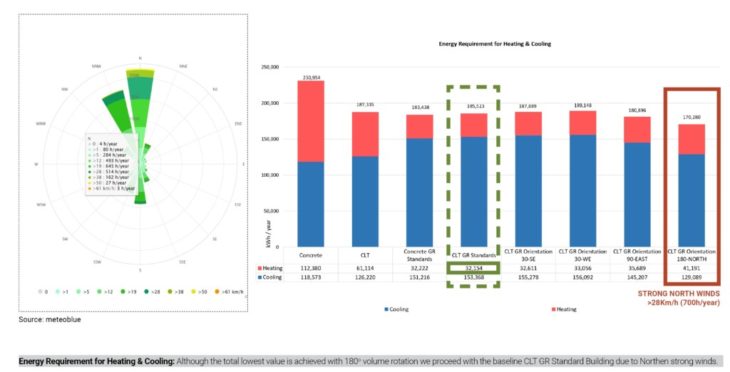
PASSIVE OPTIMIZATION
OPERATIVE TEMPERATURE
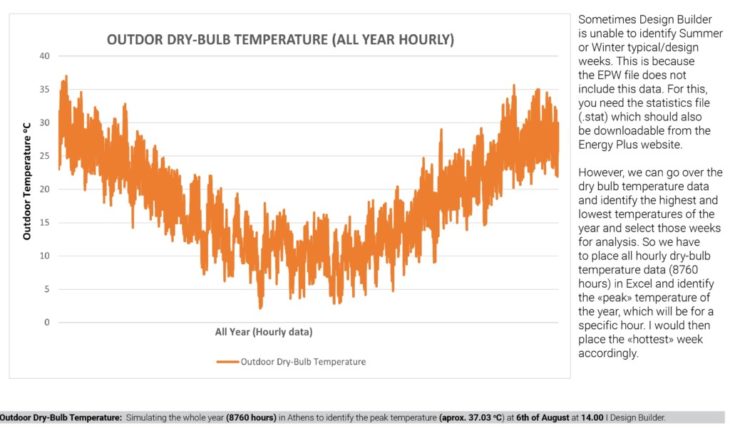
Sometimes Design Builder is unable to identify Summer or Winter typical/design weeks. This is because the EPW file does not include this data. For this, you need the statistics file (.stat) which should also be downloadable from the Energy Plus website.
However, we can go over the dry bulb temperature data and identify the highest and lowest temperatures of the year and select those weeks for analysis. So we have to place all hourly dry-bulb temperature data (8760 hours) in Excel and identify the «peak» temperature of the year, which will be for a specific hour. I would then place the «hottest» week accordingly.
The operative interior temperatures are stable between 26-28º because the HVAC system is ON. Even though we check the heating and cooling setpoints that are being assigned, by going into the «Activity» tab, scrolling down, and clicking on the «Heating» and «Cooling» menus, we realize that the Tº (and schedule) at which heating and cooling are being activated is related to the operative temperatures we are getting as results.
The CoP =1 will not alter the indoor temperatures we get on the results. It will only make our heating and cooling consumption (electricity, gas, etc) rise or drop, depending on the efficiency of the system.
We can see that the indoor, operative temperatures are stable. By clicking a specific point in the timeline and seeing what’s the specific hour this at the table, we realize that probably these peaks drop when the building is not operating, such as at 3am in the morning. So the HVAC systems are not working and there are no people in the project.
We may have an idea in winter and in summer, how is our building performing passively or if we need active systems. And if I need HVAC systems, it’s totally fine by the way.
But hopefully, we can get to the most comfortable conditions possible, only with passive solutions.

Design Builder offers results per thermal zone. This means that we can have really high temperatures in the reception, and very low temperatures in the auditorium (for example).
When we export results on the «Building level» the data will be averaged, taking into consideration all thermal zones.
This sometimes makes it difficult for results to actually be reflected clearly. Therefore, we can select a critical space (regularly occupied, where thermal comfort is very important) and see the changes in temperature for that specific zone, on different iterations.
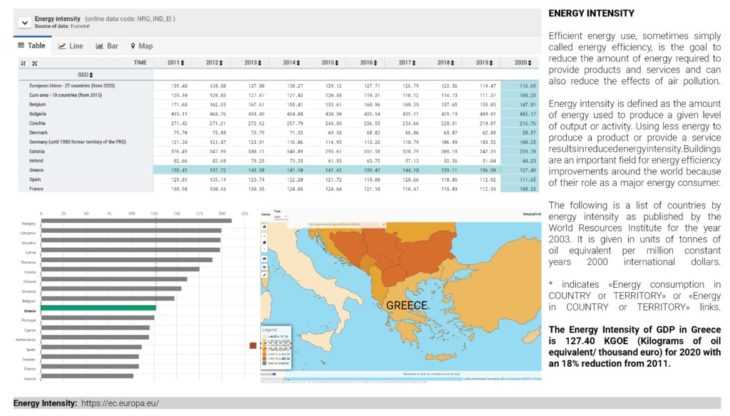
ENERGY INTENSITY
Efficient energy use, sometimes simply called energy efficiency, is the goal to reduce the amount of energy required to provide products and services and can also reduce the effects of air pollution.
Energy intensity is defined as the amount of energy used to produce a given level of output or activity. Using less energy to produce a product or provide a service results in reduced energy intensity. Buildings are an important field for energy efficiency improvements around the world because of their role as a major energy consumer.
The following is a list of countries by energy intensity as published by the World Resources Institute for the year 2003. It is given in units of tonnes of oil equivalent per million constant years 2000 international dollars.
* indicates «Energy consumption in COUNTRY or TERRITORY» or «Energy in COUNTRY or TERRITORY» links.
The Energy Intensity of GDP in Greece is 127.40 KGOE (Kilograms of oil equivalent/ thousand euro) for 2020 with an 18% reduction from 2011.
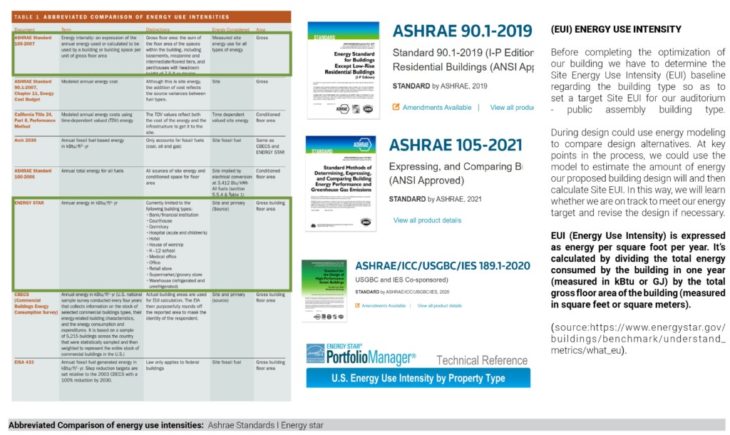
ENERGY USE INTENSITY
Before completing the optimization of our building we have to determine the Site Energy Use Intensity (EUI) baseline regarding the building type so as to set a target Site EUI for our auditorium – public assembly building type.
During design could use energy modeling to compare design alternatives. At key points in the process, we could use the model to estimate the amount of energy our proposed building design will and then calculate Site EUI. In this way, we will learn whether we are on track to meet our energy target and revise the design if necessary.
EUI (Energy Use Intensity) is expressed as energy per square foot per year. It’s calculated by dividing the total energy consumed by the building in one year (measured in kBtu or GJ) by the total gross floor area of the building (measured in square feet or square meters).
The question of energy use in buildings is not straightforward as the indoor conditions that can be achieved with energy use vary a lot. The measures that keep buildings comfortable, lighting, heating, cooling, and ventilation, all consume energy. Typically the level of energy efficiency in a building is measured by dividing energy consumed by the floor area of the building which is referred to as specific energy consumption or energy use intensity:
GROSS AREA OF INTERIOR SPACES = 2400m2 (1000m2 Ground floor, 1000m2 1st Floor, 400m2 2nd floor).
NET AREA OF SPACES INTERIOR = 2,187.50m2 (calculated as thermal zones to Design Builder).
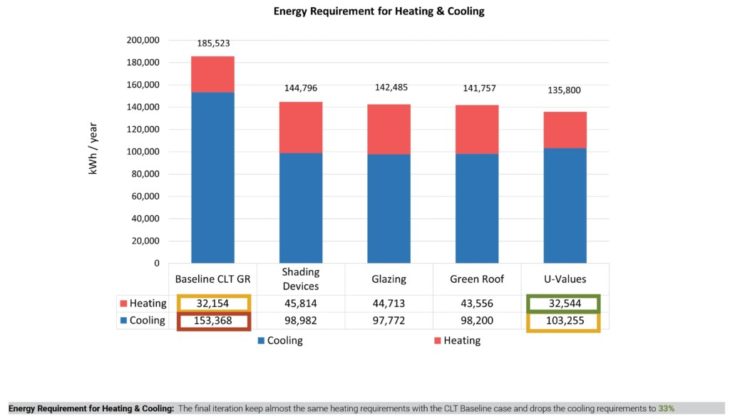
The energy demand of our building after passive systems optimizations is 135,800 kWh
EUI= 135,800 kWh / 2,400m2 of internal gross space = 57kW/m2 per year – An efficient building considering LEED reaches 50kW/m2 of internal space.
kBTU/ ft2 per year / 3.412 = kW/m2 per year
kW/m2 per year * 3.412 = kBTU/ ft2 per year
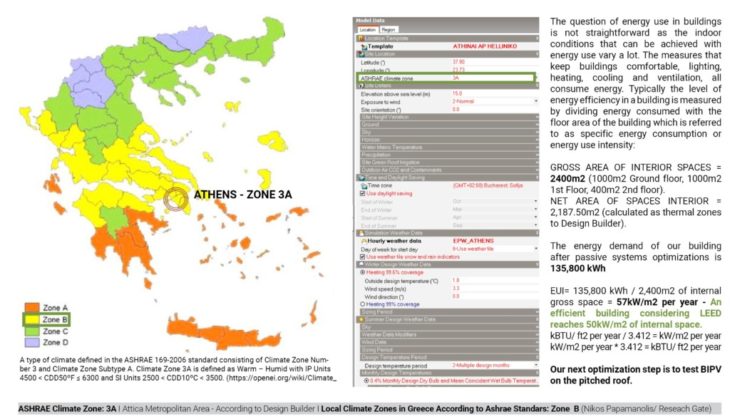
Our next optimization step is to test BIPV on the pitched roof.
BIPV
60-cell solar panels are typically 1.60m tall by about 1m wide and have a power output in standard test conditions of between 270 watts to 300 watts, depending on the exact efficiency of the cells in them.
Modern solar panels are made from silicon solar cells, which are either monocrystalline or polycrystalline solar cells. Both are similar in terms of energy output, although monocrystalline panels use higher-grade silicon which makes them the most efficient.
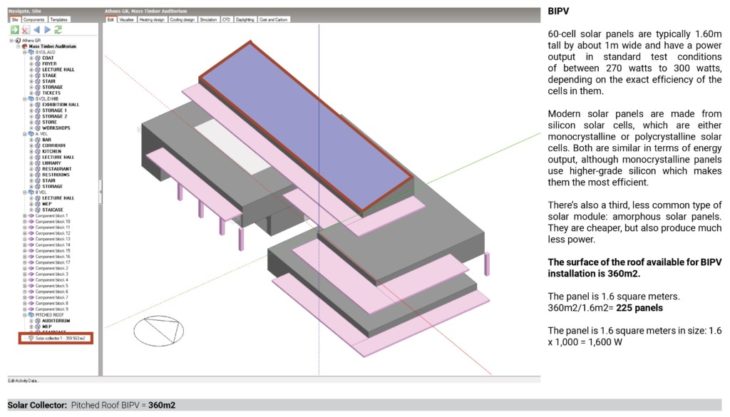
There’s also a third, less common type of solar module: amorphous solar panels. They are cheaper, but also produce much less power.
The surface of the roof available for BIPV installation is 360m2.
The panel is 1.6 square meters.
360m2/1.6m2= 225 panels
The panel is 1.6 square meters in size: 1.6 x 1,000 = 1,600 W
SYSTEM EFFICIENCY
Modern solar cells are capable of absorbing about 20 percent of solar energy, allowing them to reach 400 watts of output. It’s generally the case that higher efficiency solar panels cost more but use less roof space. In our case, we have a particularly high energy usage and we want to test if we can solely rely on solar panels to power our building, we’d recommend getting solar panels with a high output – around 300 watts (per panel) or more.
Panel is 20% efficient: 1,600 x 20% = 320W
The maximum amount of electricity the system can produce under ideal conditions (known as peak sun) which is sometimes called ‘rated capacity’ or ‘rated output’ is taken to be 1,000 watts (or 1 kW) of sunlight for every square meter of the panel.
A typical solar panel system has a capacity of between 1 kW and 4 kW.
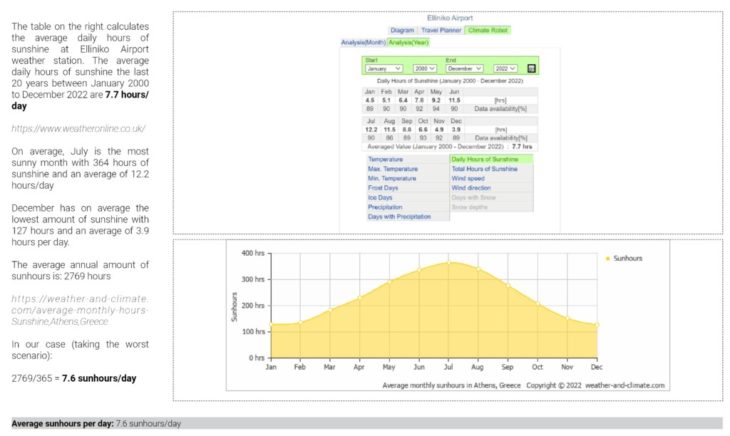
The table calculates the average daily hours of sunshine at Elliniko Airport weather station. The average daily hours of sunshine in the last 20 years between January 2000 to December 2022 are 7.7 hours/day
https://www.weatheronline.co.uk/
On average, July is the sunniest month with 364 hours of sunshine and an average of 12.2 hours/day
December has on average the lowest amount of sunshine with 127 hours and an average of 3.9 hours per day.
The average annual amount of sun-hours is: 2769 hours
https://weather-and-climate.com/average-monthly-hours-Sunshine,Athens,Greece
In our case (taking the worst scenario):
2769/365 = 7.6 sunhours/day
Our roof gets 7.6 sun hours per day*: 320 x 7.6 = 2,432 sun-hours/day
*check sun-hours / day chart for Athens.
Divide by 1,000: 2,432 / 1,000 = 2.43 kWh per day
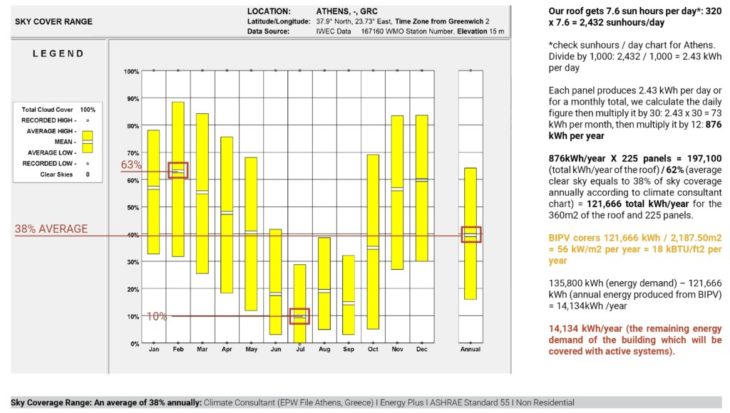
Each panel produces 2.43 kWh per day or for a monthly total, we calculate the daily figure then multiply it by 30: 2.43 x 30 = 73 kWh per month, then multiply it by 12: 876 kWh per year
876kWh/year X 225 panels = 197,100 (total kWh/year of the roof) / 62% (average clear sky equals to 38% of sky coverage annually according to climate consultant chart) = 121,666 total kWh/year for the 360m2 of the roof and 225 panels.
BIPV corers 121,666 kWh / 2,187.50m2 = 56 kW/m2 per year = 18 kBTU/ft2 per year
135,800 kWh (energy demand) – 121,666 kWh (annual energy produced from BIPV) = 14,134kWh /year
14,134 kWh/year (the remaining energy demand of the building which will be covered with active systems).
Bullitt Center
The Bullitt Center is a commercial office building at the intersection of the Central District neighborhood, and Capitol Hill, Seattle, Washington (Opened: 2013).
Bullitt center is 50,000ft2 = 15,000m2.
In our case 2,400m2 / 3.412 = 7,875ft2
1. A typical building of the size of Bullitt center (15,000m2) would have an EUI (Energy Use Intensity) of 72kBTU/ft2 per year. It requires 4,800m2 PV.
In our case 4,800 / 3.33 = 1,441 m2 PV
2. A building of the size of Bullitt center (15,000m2) that meets the Energy Code of Seattle would have an EUI (Energy Use Intensity) of 42kBTU (British Thermal Unit)/ /ft2 per year. It requires 3,400m2 PV.
In our case 3,400 / 3.33 = 1,030 m2 PV
3. A Leed Platinum Certified building of the size of Bullitt center (15,000m2) that meets the energy code of Seattle would have an EUI (Energy Use Intensity) of 32kBTU(British Thermal Unit)/ /ft2 per year. It requires 2,700m2 PV.
In our case 2,700 / 3.33 = 818 m2 PV
SYSTEM SIZE
To work out the output per square meter, we are using this formula: Number of panels x Capacity of the solar panel system Capacity ÷ Total size of the system (number of panels x size of one panel)
The total size of the system is 225 panels of 300W each: 225 x 300 = 67,500 kWh
67,500kW ÷ 360m2 roof surface = 187.5 W/m2
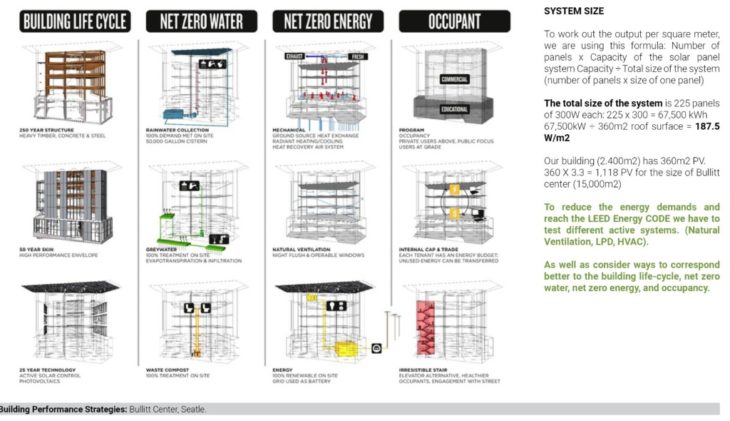
Our building (2.400m2) has 360m2 PV.
360 X 3.3 = 1,118 PV for the size of Bullitt center (15,000m2)
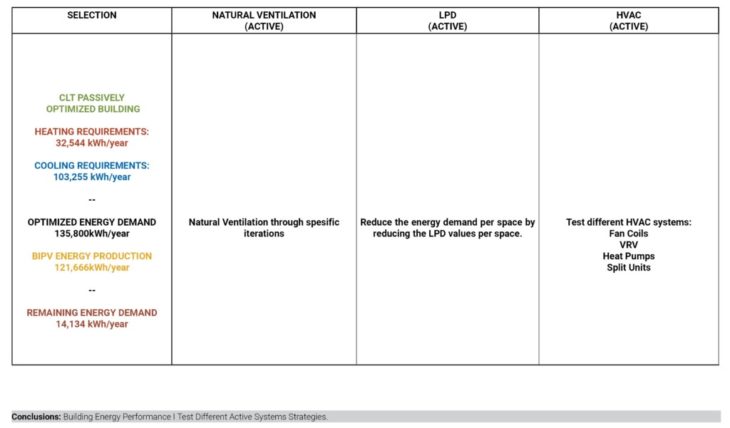
To reduce the energy demands and reach the LEED Energy CODE we have to test different active systems. (Natural Ventilation, LPD, HVAC).
As well as consider ways to correspond better to the building life-cycle, net zero water, net zero energy, and occupancy.
—
Performance Design Strategies for a Mass Timber Multipurpose Complex with Auditorium is a project of IaaC, Institute for Advanced Architecture of Catalonia developed at Master in Mass Timber Design in 2021/2022 by Student: Alexandros Kitriniaris. Faculty: Patrick Spencer. Course: Techniques 3.2
