The energy supply sector is the largest contributor to global greenhouse gas emissions. Within that figure, households account for 29% of the consumption. On top of that, the average building wastes 30% of the energy because of inefficiencies. We consider that the main challenge is to increase our energy efficiency, make energy sources renewable, and obtain a higher degree of self-sufficiency. We can divide challenges into two types. From the production side, there are solutions such as solar panels, storage, and microgrid technologies. From the consumption side, building renovation strategies, electric vehicles, and smart technologies.
In the project “Flattening the curve” our aim is to analyze the energy consumption and energy production data to propose active and passive strategies that can bring a new and more sustainable energy model.
We saw huge technological advances in green energy production from biomass technologies to photovoltaics, in spatial terms, bigger energy output per m² with much lower costs. This could be a game-changer on energy production and distribution. The current system consists of big production nodes owned by electrical companies transferring energy to consumers by the grid but is transitioning from many production nodes (photovoltaic) to consumers. It is a more decentralized system. Some of its benefits are greener energies and savings in transportation costs. But that comes with some challenges as well.
When we say flattening the curve what do we mean?
One of the most challenging problems with the rise of photovoltaics is the duck curve problem. This has accentuated a spike in production (or less consumption during the day) and a high in demand for traditional grid electricity during the night, these variances of energy create a “bottleneck on which electrical grids can cope but with high costs. Stop Starting at the beginning of the day and ramping at dawn. Microgrid technology is part of the solution to make the system more adaptable and resilient, but it’s not enough. Experts believe to get to at least 80% renewable we would need spatial diversity and short duration storage; this is only possible with a mix of strategies, that go from building scale to district-scale. Without these measures, the costs associated with the ramp-up would outrun the benefits of photovoltaic production.
Our reference framework is MES Barcelona. This framework promotes a new energy model for Barcelona, considering both public and private sectors. It distinguishes two types of projects; active and passive. They do not require investment from the building owners and it is open to private developments.
Methodology
The analysis part is divided into 2 categories: consumption and production. For the consumption part, we have land use, the total buildings’ surface (m²), buildings’ energy certificates, and energy use patterns. For the production part, we analyzed the solar radiation which gives us an amount of potential production of energy. For both, a time pattern was added, daily as well as seasonal. The next step was evaluating the data and visualizing consumption and generation patterns. On this basis, we created the catalog of consumption & production per building. To do that, from the value of production we subtracted the consumption value and classified them. It helped us to identify the biggest producer and consumer in the area of Poblenou. 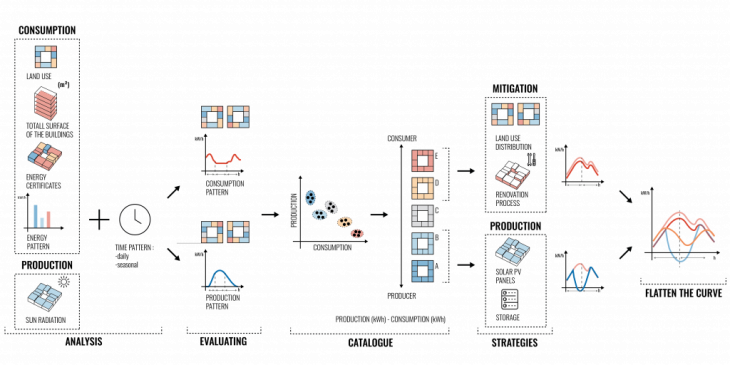
All those steps lead to identifying which strategies would be the best for which building. For Mitigation: how we can redistribute the land use? How the renovation process will decrease the use of energy, and for production, we will look at areas where there is potential for production to place solar panels or later energy storage facilities. To some buildings, we could apply straight production strategies, while to the others we need to start from the renovation process.
Data, Tools & Methods
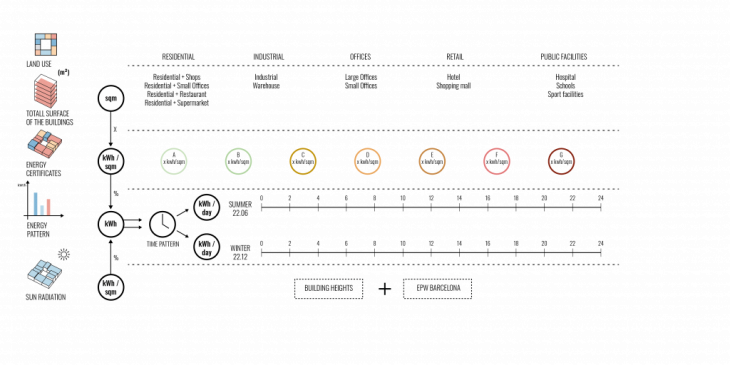
We built 2 datasets ( one for winter and one for summer). the land use for each building on our site. To be more precise with calculations we determined more categories, so for example not only say it’s retail but to check what kind of retail is it, if it is a hotel or a shopping mall, because the energy patterns for this function are completely different. We also considered if the building is mixed-use (ex. residential and office). After gathering this information we run it through the time pattern, daily and seasonal (because of the difference between summer and winter). We also consider the energy certificates, which determine how energy efficient each building is. And finally, based on the roof’s surface of each building and its sun radiation, we estimate the production capacity, getting both energy production and energy consumption per building and at aggregated value.
Analysis
Consumption
We have got the values for the average consumption per type of land use and multiplied it by the building footprints, obtaining the consumption patterns per day. Every land use has its own pattern as you can see in the diagram on the left-bottom corner.
Production
For the production curve, we did a similar process. In this case, we consider the rooftop area as the main indicator for the calculation of the potential energy that can be produced. We are just considering photovoltaic since it is the main solution promoted and installed currently in the city, aligned with the MES Barcelona tool.
Balance
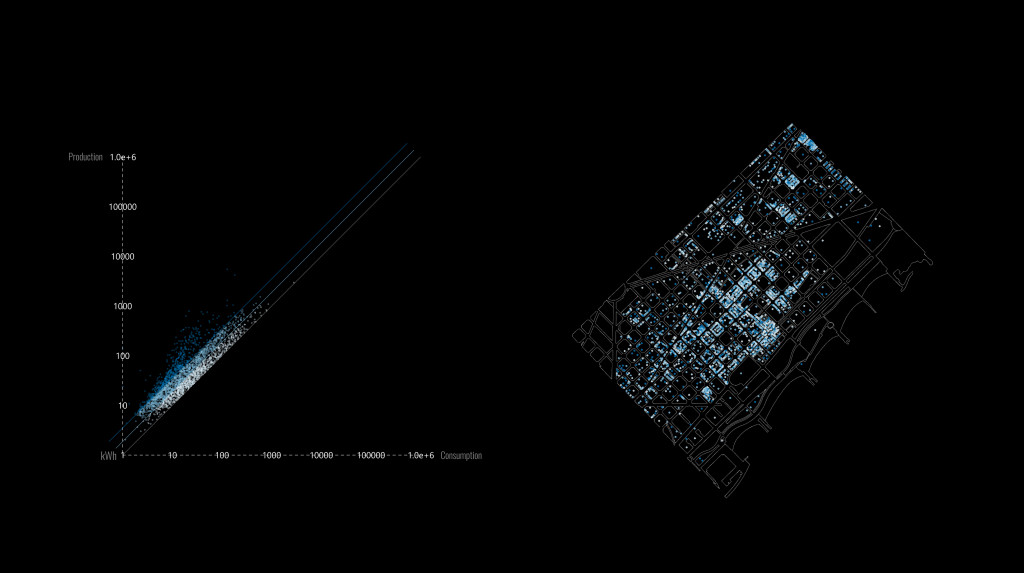
We managed to get the final energy balance by combining the consumption and production data, obtaining 4 different categories: high producers, mid producers, mid consumers, and high consumers.
As you can see in the scatterplot, we distribute the buildings based on their consumption and production values.
Strategies
So, once we have got all the data inside our tool it is time to make something out of it and promote a new energy model. Our previous data comparing consumption patterns and solar energy potential of each building, help us defining a potential self-sufficiency index and a pashed intervention plan for the whole district urban fabric.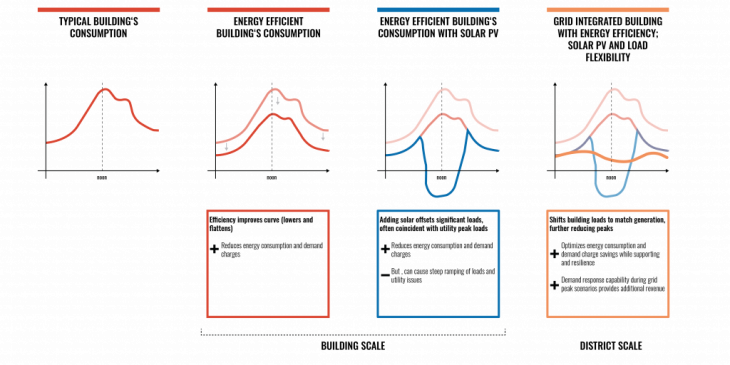
This is our starting point, we identify the current buildings that could be self-sufficient in case the solar panels will install on their roofs in blue and the ones that despite this would still have a negative energy balance in the red.
1.Renovation
The first strategy is focused on the red buildings shown before, and reducing their current energy consumption. The selection of the buildings to intervene first on will be done following 2 criteria:
-Their energy certification, with letter Gs as the worst efficient buildings and A as the better ones.
-Their potential way towards becoming self-sufficient and share energy in the future.
Our first criteria identify the potential of each building to reduce its current energy consumption, from an 80% reduction in the case of Gs certificates and 20 % in the case of Ds. Our second criteria, takes into account the temporal dimension, identifying 3 phases of intervention, based on the current energy balance of the buildings. We start from the ones that are farthest away from achieving self-sufficiency and end up with those closest to it.
2.Solar Energy Production
Therefore we need to combine it with solar energy production on the roof’s strategy as well. This would help to reduce, even more, the energy consumed during the sunny hours and even generate an excess that could be stored and exchanged later. Our strategy focuses now on the buildings with a positive overall energy balance or the blue dots on the right side of our scatterplot. This is the current situation with more than 1300 buildings with an opportunity to generate an energy excess.
The way to choose the ones whose installation of solar panels could be financed by Barcelona Mes is by distributing the potential producers into three groups according to their capacity to collect energy to share, later on, dividing them from high to low producers. We can see here, how following the previous three phases explained in the previous renovation strategy, new potential higher producers that could be serviced by Barcelona Mes appear in the district.
3.Energy Exchange
Our final step once we have completed both the renovation and production process is to allow the exchange of energy between the buildings around 22@district that still present a negative energy balance. Firstly, we analyze the closest producers with an energy excess to these buildings, based on the existing electrical distribution network.
Once we cluster the possible neighbors to take energy from, the exchange takes place according to the excess and demand of energy of each of the different members of the new distributed and public network.
The final result is that after our renovation process, we can have more than 400 hundred new buildings that could have a big energy excess to be shared and included in the Barcelona MES tool.
To conclude, we have talked all the dime about buildings and curves, but we do not have to forget that to achieve a new energy model, we need to build communities, physical and virtual ones, where everybody gets involved.
Flatten the Curve is a project of IAAC, Institute for Advanced Architecture of Catalonia developed at Master in City & Technology in 2020/21 by students: Riccardo Palazzolo, Marta Maria Galdys, Nadh Ha Naseer, Juan Pablo Pintado, Alvaro Cerezo, and faculty: Angelos Chronis, Iacopo Neri, Mahsa Nikoufar and Androniki Pappa
