CITY DATA VIEW
Spatial and Temporal Analysis of the Accidents at Sant Marti, Barcelona
The project is a scripting exercise using Rhino and Grasshopper. The location chosen for this analysis is the Sant Marti district, Barcelona, through the period of 2016-2018. The data was gathered from CartoBcn and Open Data BCN.
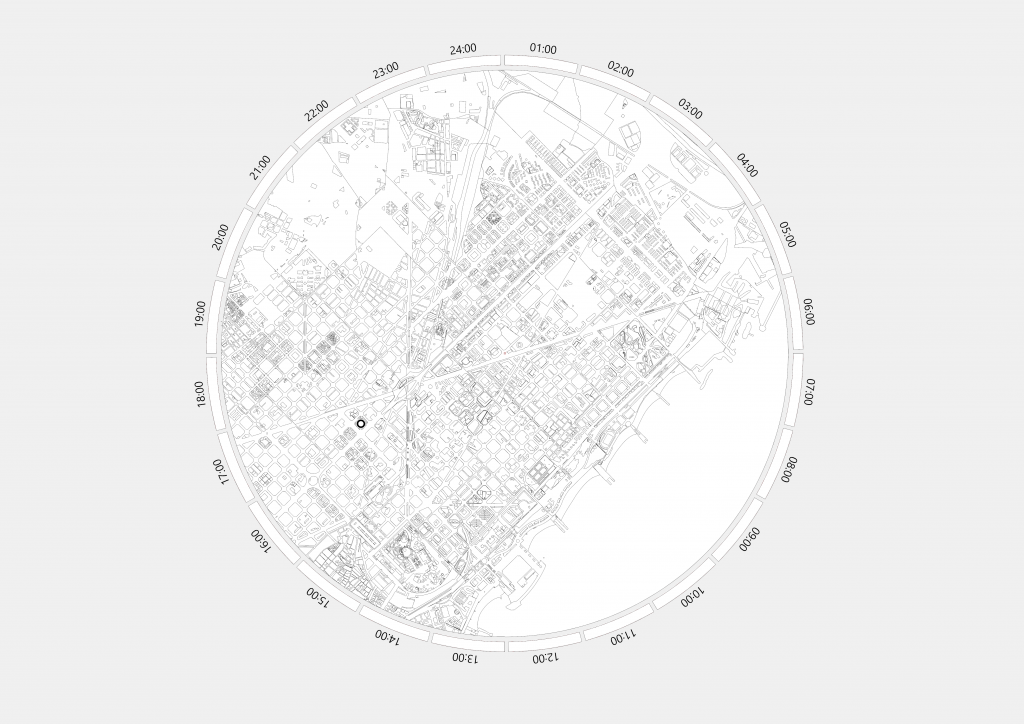
Map of Sant Marti, Barcelona
A hemispherical dome partitioned into 12 parts hovers over the map. This represents the particular month wherein the accidents occurred. The white bars at the perimeter of the map represent the time of day, which is connected to the location of accidents thru a set of arcs.
Script:
https://drive.google.com/file/d/19qsQgPSVcGheZtoq-Kf9TPfBL-S5jKIH/view?usp=sharing
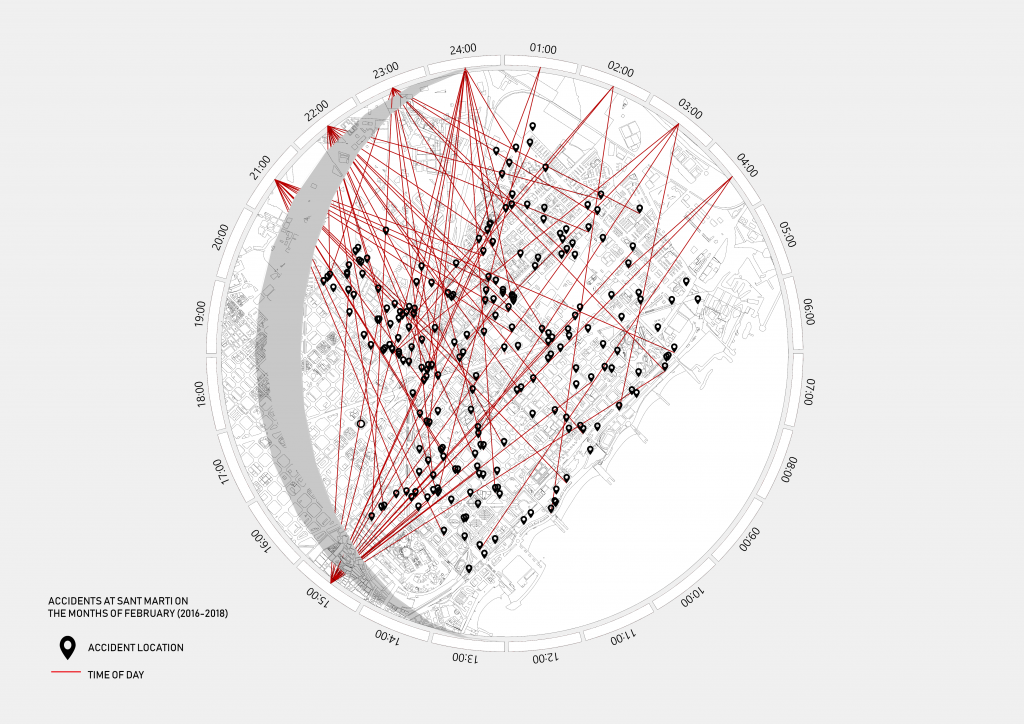
Accidents at Sant Marti on the month of February (2016-2018)
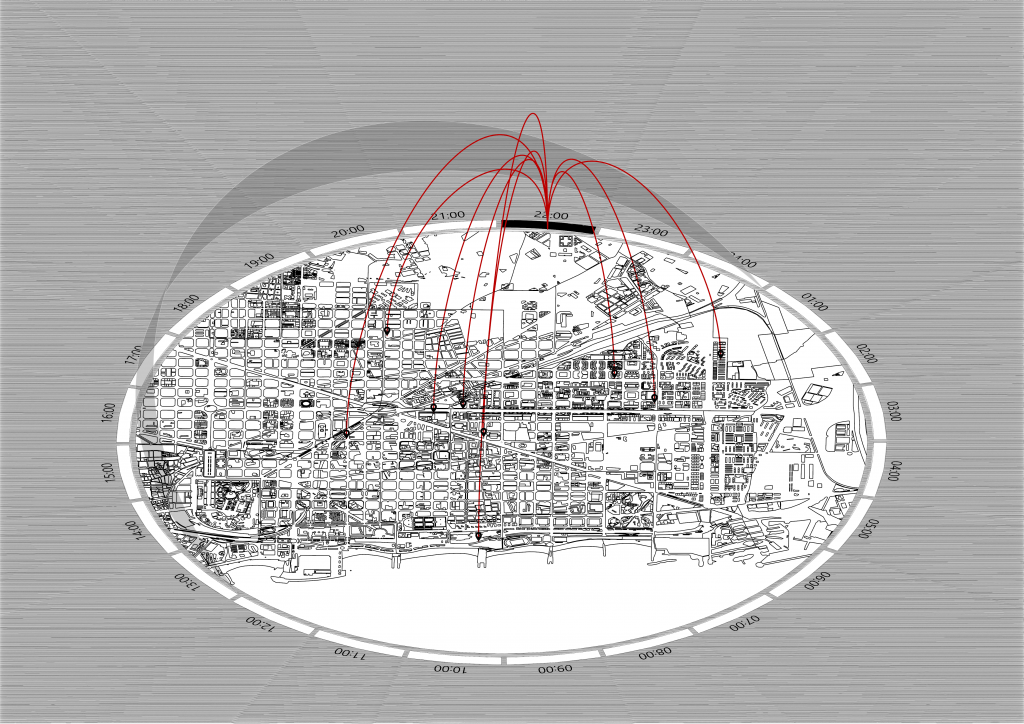
Accidents at Sant Marti on the month of February @ 1:00 am
Accidents at Sant Marti on the Month of January (2016-2018)
Dataset: CartoBCN, Open Data BCN
Spatial and Temporal Analysis of the Accidents at Sant Marti, Barcelona is a project of IaaC, Institute for Advanced Architecture of Catalonia developed at Master in City & Technology in (2019/2020) by:
Student: Rovianne Santiago
Faculty: Rodrigo Aguirre
