In this exercise, I explored the efficiency and convenience of the Barcelona public bike-sharing platform using grasshopper. The Bicing bike-sharing platform is mostly used by locals as a convenient mode of commuting short distances, but it can also be used flexibly to explore the city. Barcelona is one of the best cities in the world for cycling with its great weather, mild topography, compact design, and high density of sights and attractions. There are over 400 Bicing stations across the city where people can pick up or drop off a bike, so how efficient is the network when used to tour the city?
When touring by bike, you want to be able to frequently stop and start your journey as you pass by points of interest. This can be tough if there aren’t enough stations along your route. You also want to be able to get where you’re going with relative efficiency. The more stations on your route, the more optionality you have to stop and start the journey. One way to measure this is to compare the shortest route between two points of interest and compare that to a route that passes by the most Bicing stations. If the two routes are very similar, we know the Bicing stations are well placed.
The first step was to download the open-source spatial data and prepare it in QGIS. Three shapefile maps were used for the analysis: a map of Barcelona’s blocks, a map of the road network, and a map showing points for every Bicing station. I used QGIS to clip the maps, isolating the central area of the city for the analysis.
The shapefiles were then imported into Rhino using the Urbano Grasshopper plug-in. I placed a point at Plaza Catalunya as the origin for the bike ride, then placed points at four points of interest across the city to analyze different rides.
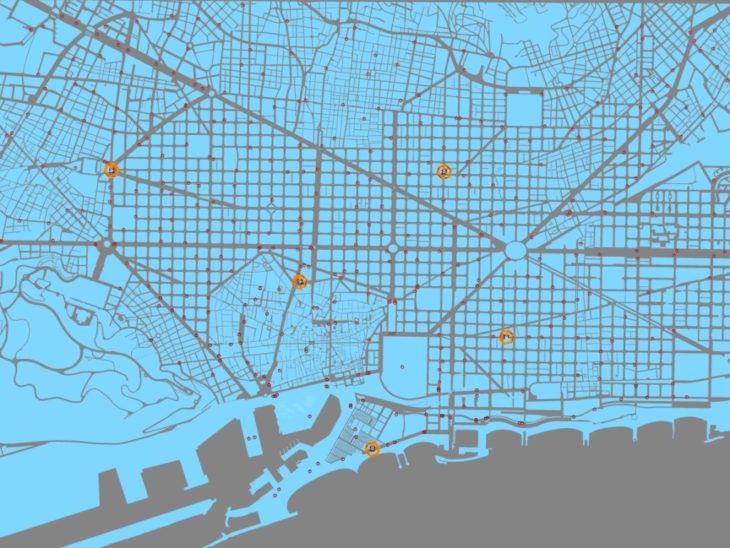
I used Grasshopper’s shortest walk algorithm to find the shortest path across the road network from the Plaza to each point of interest. Then, using the pull points component I deployed a shortest path definition which uses the Bicing stations to add weight to the path based on how many stations it passes by. This creates a new path that passes by as many Bicing stations as possible while still finding its way to the destination.
Overall, the most efficient routes between the plaza and various points of interest are very similar to the weighted path that passes by the most Bicing stations. The routes rarely seem to deviate by more than a couple blocks. That means you could easily hop on a bike at the plaza, head to La Sagrada Familia, and comfortably stop and start your journey along the way. This analysis is very simple, and would require more data to be truly useful; it does not take into account the location of bike lanes, the density of amenities along the route, or even the presence of one-way roads, for example. But it is a basic demonstration of how spatial data can be set up and analyzed with a Grasshopper definition.
Biking Touring Barcelona is a project of IAAC, Institute for Advanced Architecture of Catalonia developed at Master in City & Technology in 2021/22 by:
Student: Ocean Jangda
Faculty: Eugenio Bettucchi and Iacopo Neri
Student: Ocean Jangda
Faculty: Eugenio Bettucchi and Iacopo Neri
