An outlook into physical and socioeconomic data for understanding and defining suitable interventions and stakeholders against urban segregation in London – UK.
Context
London is the most cosmopolitan city in the world. The high amount of ethnicities and different social background living in the London Wards provides a great vibrance to it, but, oftenly also is wrongly translated by the society as segregative processes. One of the outputs of segregation in the city is the disposition of the urban fabric, which can cause physical separations and ruptures in the continuity of the tissue, worsening even more the exclusion process. Thus, understanding the relation between the physical characteristics of the urban tissue and the socio economic reality of London Wards could be a useful tool to identify possible change makers in this scenario. Urban segregation is a vast research area which cannot be summarized into a single study. Thus the aim of this project is to relate a few indicators based on physical and social aspects in order to identify possible stakeholders in the most suitable areas for urbanistic interventions against urban segregation.
Methodology
Description of the process
The final output of the study is the identification of possible stakeholders related to community services to be catalyzers of urbanistic interventions against urban segregation. Throughout the analysis patterns inside the data were observed and considered for the final results. In order to identify these players of the process, two main data categories were used: data related to socioeconomic aspects and data related to physical aspects. The socio economic data collected is divided into the wards of London which led the calculations to be made for each of these parcels of the city. Two main indicators were built in an overall scale of the city and helped the definition of the spatial domain – Spitalfields and Banglatown Ward – for a more detailed analysis. The data related to physical aspects was collected considering the Ward scale and gathered the availability of community services² and the characteristics of the network³ regarding Spitalfields and Banglatown Ward. The calculations led to the identification of patterns in the urban tissue and the localities of the Community Services, presenting an output of possible catalisors for urbanistic interventions.
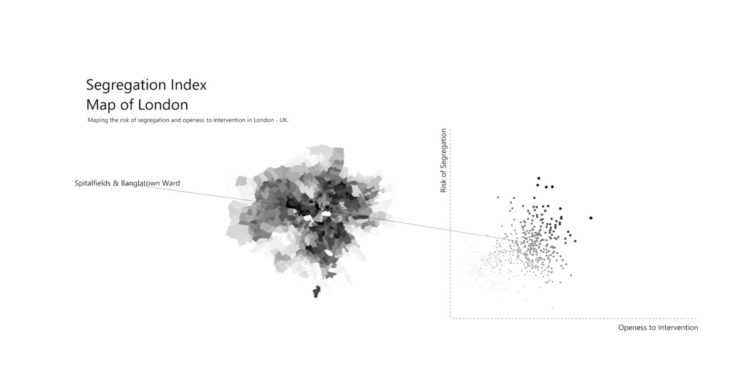
Suitability of Intervention Index
Combination of four different indicators to arrive at the suitability of intervention index proposed for London.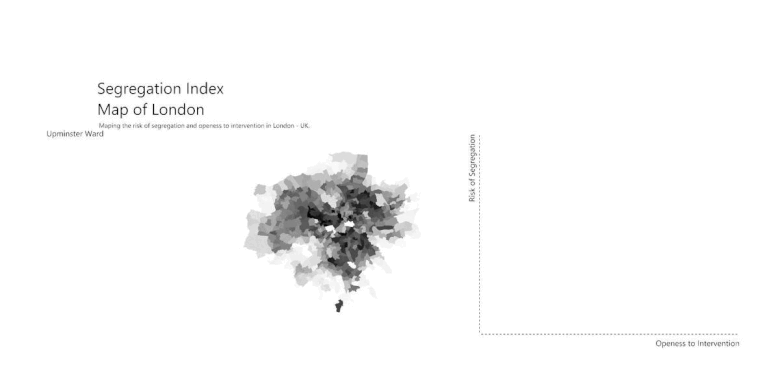
This index was built regarding two key factors: the Openness to intervention and the Risk of segregation. This dataset was divided into wards in Greater London. The first one combines the diversity index of ethnicity (Simpson’s Index4) with the density per square kilometer in each ward of London. The second one was calculated relating the most different indexes in each ward regarding the rise of house prices over time with the rise of the income per family household. Combining these two together the “Segregation Index” was created, seeking to find Wards of London suitable for urbanistics interventions. The Ward chosen for the case study is Spitalfields and Banglatown. With high rates of Openness to Intervention and also a great proximity with the City of London, further analysis was developed in this spatial domain.
Read more – Simpson’s Index:
The details of the creation of the Suitability for Intervention Index are available through this link:
In further detail Python was used to calculate the Simpson’s Index for Greater London.
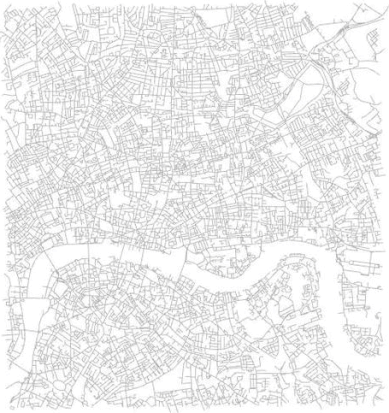
Fragmented Tissue Areas
Clustering the areas of fragmented tissue to identify patterns of low integration and choice within the selected spatial domain.
To understand how the urban fabric behaves in Spitalfields and Banglatown an Space Synthax5 analysis was made observing specifically the values of integration and choice in a 400 meter radius. This analysis was useful to identify the segments of the network that are on the 3 lowest classes of the Jenks natural breaks6 considering the domain of the values. Combining the lowest rates for choice analysis and the lowest rates for integration was possible to identify the segments that are breaking the network of the urban tissue.
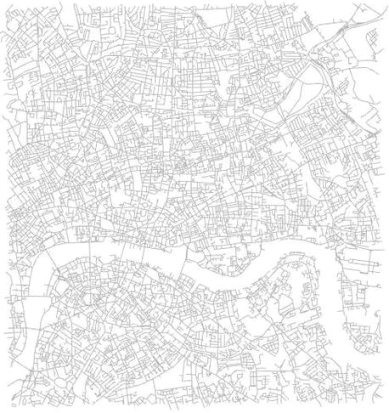
Broken segments
As shown in the map above, these pieces of network are spread throughout the whole area of study. Thus, to understand what are the areas with the highest amount and proximity of these breaking segments, the data was clustered into chunks of tissue that define then the most suitable areas of urbanistic intervention.
Clustered Tissue
Community Services
Mapping and identifying patterns among community services within the fragmented tissue areas.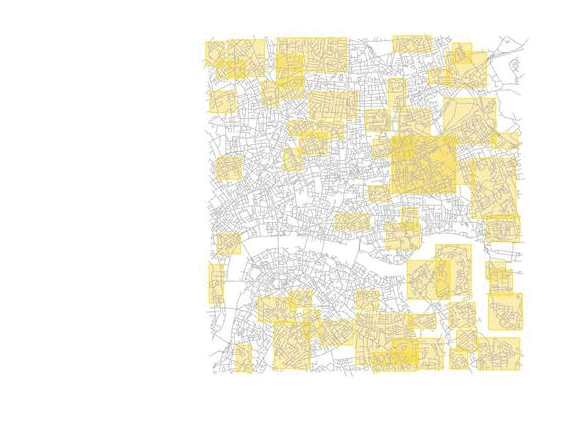
Having identified the clusters of fragmented tissue in Spitalfields and Banglatown, the next step was to understand who and where are the possible stakeholders of possible interventions. For that purpose, the Community Services of the region were mapped and classified by use. The classification of them led to the identification of the pattern that within the fragmented tissue areas the most present communal infrastructure are educational facilities.
Toolbox
Dashboard for the identification of possible stakeholders.
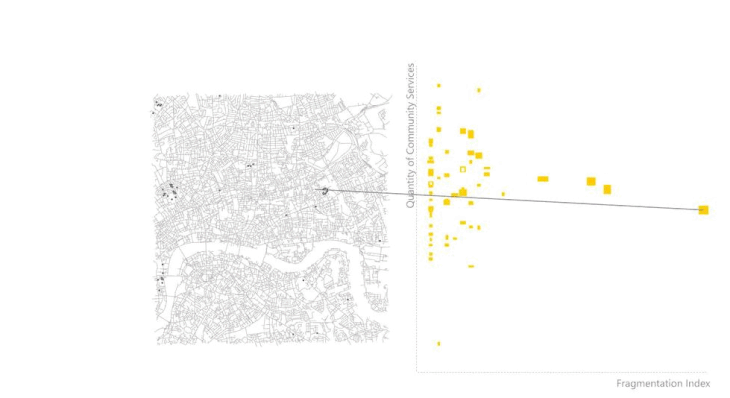
Summarizing all the data collected and processed, the final result is a dashboard where it is possible to relate each cluster of the fragmented tissue with its value of quantity of community services and the Fragmentation Index – calculated considering the average of values of choice and integration of the segments within the cluster. This toolbox also represents the pattern of allocation of the community services inside the fragmented tissue, pointing out the relevance of the schools in an intervention process against segregation. This dashboard, also, is scalable for other regions of the city since it was constructed fully upon open data sources.
Pseudocode
Visual description of the step-by-step of the data analysis performed. The pseudocode relates all the processes in order to obtain the final result. Organized into five categories, it’s possible to understand then which are the variables considered to the achievement of each of the analysis performed. The data collected came from open data portals in various types of datasets. One of the challenges of this study was relate the spatial domains of the datasets between themselves.
References
1 – London Datastore – Greater London Authority. (2021). Retrieved 24 November 2021, from https:// data.london.gov.uk/
4- Alan Turing Institute – Colouring London. (2021). Retrieved 20 November 2021, from https:// colouringlondon.org/
3 – Openstreetmap. (2021). Retrieved 28 November 2021, from https:// www.openstreetmap.org
4- Simpsons Diversity Index. (2021). Retrieved 24 November 2021, from http:// www.countrysideinfo.co.uk/simpsons.htm
5- Space Synthax. (2021). Retrieved 24 November 2021, from http:// www.spacesyntax.net/
6-Jenks Natural Breaks Classification (2021). Retrieved 14 December 2021, from http: //wiki.gis.com/wiki/index.php/ Jenks_Natural_Breaks_Classification
Aggregating Patterns of Urban Segregation is a project of IAAC, Institute for Advanced Architecture of Catalonia developed Master in City and Technology in 2021/2022
Student: Maria Augusta Kroetz
Faculty: Iacopo Neri and Eugenio Bettucchi