First of all when did water (and in general natural resources) really start to be a main problem for our future and how did we realize this? While I was making the research about the subject of scarcity as part of architecture and planning, I found out that when the whole earth catalogue in Fall 1968 shared the first satellite photo of earth from the space, society was politically and economically in shock as the hubris of the swinging sixties collided with the realization of the earth’s resources were actually finite! It was a fact brought home by its lonely image floating in a universe of black ink on the cover of the first whole earth catalogue. From here on scarcity has always been existing as an input for architecture.

First Satellite Photo of Earth, on the cover of first Whole Earth Catalogue in 1968
It has been 50 years or even more, but how we have been actually treating to our resources and what has changed ? We see the river and coastal water quality of Catalonia and there we also see the dark red lines which represents the bad or moderate quality water, are mostly around urban settlements because with this graph together, we see the pattern of inappropriate water treatment centers which cause pollution.
According to Catalan Water Agency, reuse of treated water is standard practice in Catalonia, with the outflow from WWTPs being diluted in rivers which are then used for urban agricultural or industrial supply further downstream. This reuse is technical terms referred to as indirect or unplanned use.
As opposed to such spontaneous reuse, direct (or planned) reuse is characterized by the presence of regeneration treatment in order to produce water of a quality for other uses, transported specifically to the point of use.
Another big problem for urban areas is the disaster brought by rain ‘flood’! If we research the amount of bridges collapsed, sludge systems exploded and drainage that mixed with clean water all around the world after the heavy rain, we can see that this is a major problem.
Therefore before starting to explain our system I can mention that our ultimate aim was to think about the possibilities of Zero Waste Water Circle as a system. By planning the reuse of treated water to the exact points and not sending any water outside of our system as ‘waste’ water. Second of all we should manage and plan every drop of the rainwater that falls on our land.
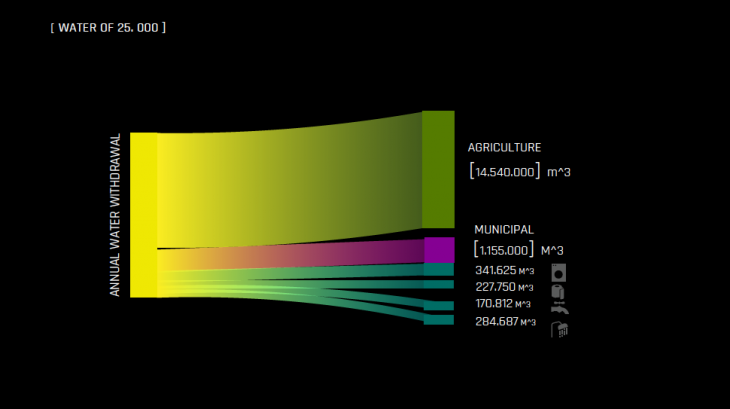
To start with the project we needed to imagine first of all what is the water demand of our 25.000 populated neighborhood? Can we take any neighborhood around the world and use its numbers per capita as an input? This was the main challenge in case of water, we were not able to take any city or any neighborhood as an example, because we were proposing a complete new system of agriculture, production, water reuse, therefore water demand of our system was unique and needed to be calculated from the scratch! However for our system, as opposed to other urban systems, agriculture was the major sector in terms of water demand. Then domestic and outdoor use of water in city were calculated independently through one person’s need of water. We also needed to organize how our sharing system works, we planned the washing machine water demand based on a shared system for instance. And these small changes in social systems made huge changes in the amount of water consumed.
How did we do all the calculations? We needed to use a parametric system to connect all the inputs and outputs with details, therefore a model on Grasshopper is created to calculate the demand and waste water for all the sectors.
Following pages will represent the data and calculations and will try to explain the questions we have been discussing during the process and how far we could come.
WHAT DOES 0% WASTE MEAN?
Understanding the current urban and rural water management systems was very important as a beginning for the project. I look at current and historical systems all around the world and tried to analyze different methods of water management and their relation with geography and climate. Since centuries, societies used different methods to store rainwater, to distribute water for agriculture and livestock, and domestic use. Water is even used as part of architectural design as a cooling system in the courtyards of Middle Eastern housing typologies.
If we look at data by Food and Agriculture Organization of United Nations, it is obvious that there is enough water resource capacity of the world for everyone, however unfortunately water is not distributed fairly. While some of the countries like Brazil, has more than enough water for its population, some other countries such as Kuwait, are mostly dependent on cross boundary freshwater flows coming from other countries. It is impossible to manage the distribution of water flows of geographies, we can not control nature however we can control our waste. If we have such a precious source as subject, we should think of possibilities to manage it 100% effectively.
I mentioned before that as we can see from the graph on the previous page that information of it is taken from Catalan Water Agency, bad or moderate quality water flows are concentrated around the urban settlements of Catalonia, which means that urban water management currently has some problems in Catalonia, then when we research more about the activities of Catalan Water Agency we see that they have a huge Waste Water Treatment Plants construction project still going on all around Catalonia.
What are the lessons that we learnt from today’s practices all around the world ?
We definitely know that we should not make any waste and should create circler systems in an urban area in order to have planned and direct use of treated waste water, today we are sending treated waste water to the freshwater resources back, and from there on, they join the flow of clean freshwater and create pollution on it. Therefore this indirect use is not the proper approach.
In planned (direct) use of treated waste water, every mechanism of collecting waste, treating the waste, and reusing the waste should be designed into details. Grey and Black Waters are two different terms used for waste water in domestic use. BlackWater represents the water that is mixed with sludge, and GreyWater represents the remaining part of waste water. BlackWater nowadays is seen as an important source of BioGas production as well, so BlackWater Treatment Plants include Biogas Production Tanks as well in our neighborhood.
Important amount GreyWater is treated by Wetlands in the current eco-neighborhood projects going on around the world (especially in Northern Europe). However artificial wetlands of a 1km-1km neighborhood are not enough for the demand of 25.000 people everyday, hence we also have some GreyWater Treatment Plants in WWTPs.
The other important subject for urban water management is rainwater, because rainwater is actually an important resource, in the following pages, you will see a more detailed analysis about the rainwater collecting and reusing system of our neighborhood however here I would like to mention that, surface runoff is an important problem for current urban infrastructure. Since there is not a separately planned surface runoff drainage, this dirty water connects to the urban drainage, it exceeds its own limit and the ‘flood’ as a disaster occurs in this way.
BE CONSCIOUS, MAKE SMART DECISIONS
After we withdraw water we need to know very well which daily life activity or which sector is taking more amount of water in order to have a intelligent management of water in our system. We need to know how much our simple daily activities such as taking shower, washing our clothes, cleaning our homes or our streets require water and we should be aware of the fact that simple activities such as washing our clothes in washing machines is in fact a huge consumption of water. Or we need to know agricultural products (crops) and their water consumption in order to make smarter food choices. Because some small decision changes might make huge differences in the consumption of such precious natural resource.
HOW TO CALCULATE THE DEMAND OF THIS NEW SYSTEM ?
This was in case, the real struggle of this research subject, we are talking about a complete new system of urban life, we are changing the social and economical structure and making predictions about the future, but which kind of changes this new system would bring to our daily life, and how do these changes would effect our water consumption?
First of all in case of water, the issue is not being independent but is trying not to waste this precious resource we withdraw everyday, and in case, we actually consume more water than Barcelona does today, since we produce our own food we do not send any amount of water out of our system, we have our treatment centers, rainwater storage tanks for both from roofs and from streets, artificial wetlands, to process our withdraw and waste of water.
After mentioning the system our 0% waste circle, I would like to talk about numbers, because it took a long process of calculation in order to reach these final data. There were data of all the countries to see water consumption per capita. However it was impossible for us to use this data for our research. Because first of all for all the economic system, all different climate and geography, for natural resources of cities the amount of water consumption per capita was changing, so in the end we did not use this ready data but tried to calculate our own demand.
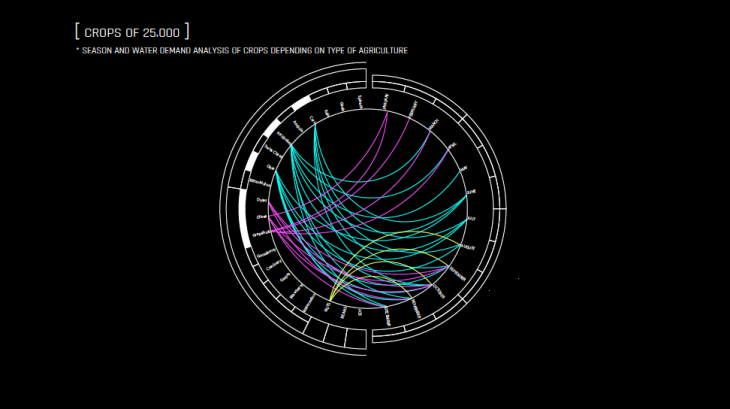
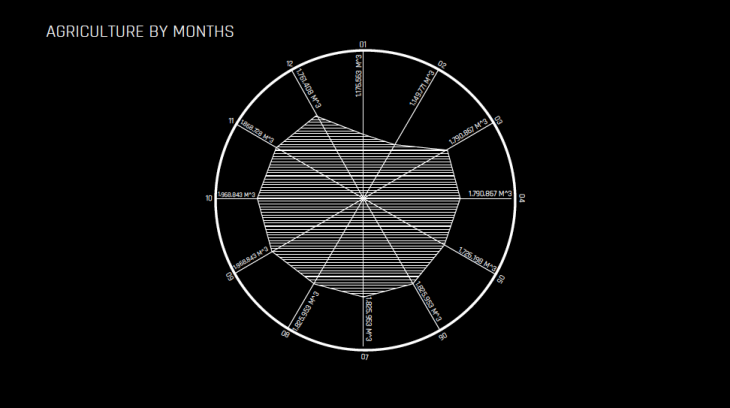
Water demand and its calculation by deciding washing machine sharing system and water needs of each crops this was just the beginning of the process, because we used a parametric design tool to handle with all the inputs and outputs of such a sankey system. We will see with details on the following pages, but especially the food system was very complicated because it was interacting with a lot of different systems. Rain and our natural freshwater resources were the inputs of system, but food was effected by seasonality, depending on agriculture type and rain amount of months since it is not stable. Moreover water need of each crop is different than each other so we needed to find these numbers in order to calculate the demand. Therefore, we needed a Grasshopper model in order to cope with these changing inputs and outputs.
Another important withdraw in city areas is currently industry, our new industry is depending on recycling and reusing and local fabrication as much as possible instead of importing things, but how this new system would effect the water is the biggest question. Or we use shared housing in our new housing plan, sharing housing requires new order of social system. Since the biggest domestic consumption is on ‘washing machine’, we can take it as an example. If people share washing machine per building instead of having one in each flat, the buildings will need a new order of use of washing machine therefore people will not be able to overuse such a thirsty machine and eventually will reduce their water consumption. We calculated our washing machine demand by choosing our own rules such as, having one machine per 50 people and everybody would have the chance to use washing machine once per week so the water demand of washing machine would be much less than current demand in cities.
WATER FOOD INTERRELATION
Following pages, we will see into details the relationship between food and water. As I mentioned before, this was the most struggling relationship between all other layers with somehow related to water. Because they were acting as if they are the same system. Any small change on food system was completely changing the water demand of our neighborhood. Food research was the thing that leaded us to create a parametric system in order to be able to cope with this complicated input changes. I will explain on the following pages step by step our methodology in order to understand water-food relationship comprehensively.
First of all, when I search about the biggest droughts of the world, I found out that in all the droughts what communities first intended to do was trying to understand which system was effecting their water consumption at most and then trying to find solutions for misuses of water. In all the communities it was clear that the biggest consumption was agriculture, the biggest consumption in agriculture was livestock agriculture, therefore people were trying to create awareness first, about how much water our one serving of beef consume before coming to our tables. The campaigns, videos, info graphics were shocking, because water consumption of 1 kg of beef was hundreds of thousands of times of water consumption of 1 kg of vegetables. This research also leaded our system to choose an agriculture without livestock and a diet which is vegan.
Second of all, after deciding that we do not grow animals on our land, we needed to find out a good and nutritive diet for vegan community. Here we chose some basic crops depending on their nutritional values but it was only the beginning because later on we needed to examine their need of water and how much thirsty they are.
100% OF RAINWATER IS MANAGED
Rainwater looks like a small input when we consider the total withdrawal of water from natural resources, however as we see on the following page as well, when we consider individual consumption of our daily life activities (washing machine use as an example chosen to visualize for this info graphic) rainwater actually is an important source of supply.
Here above, we see the distributed system of green roof rain water collection and storage and we can see that it is a well distributed system. Rainwater actually is a system that has collection center per small block. Because throughout our research we saw that taking care of different reasons, this is the most efficient system for its maintenanceTherefore it is a very local system compared to other ones.
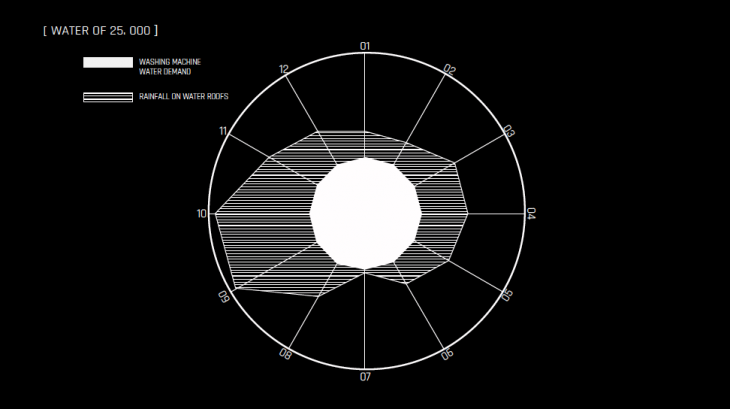
THIS GRAPHIC REPRESENTS THE RELATIONSHIP BETWEEN THE WASHING MACHINE WATER DEMAND AND MONTHLY RAINWATER COLLECTED THROUGH THE HARD ROOF SURFACES OF THE NEIGHBORHOOD, HERE WE CLEARLY SEE THAT IT IS POSSIBLE TO COVER OUR WASHING MACHINE DEMAND TOGETHER WITH OTHER SUPPLIES ONLY BY RAINWATER FROM A SPECIFIC TYPE OF SURFACE!
5 DIFFERENT DISTRIBUTION FOR 5 DIFFERENT WATER SYSTEM
We need different systems in order to manage different urban water recycling, reusing and distributing systems. We have as inputs to our system, rainwater and renewable freshwater, as demand, domestic use, municipal outdoor use and agricultural use and as outputs we have black and grey wastewater. First of all we planned into details the collection of rainwater because it is such a precious resource for domestic and agricultural use. Rainwater is collected from two different types of surfaces, first from green roofs, second from streets. Collection from green roofs is a well known and widely used system however collection from streets is as important and critical as roof collection. Flood is one of the most common disasters for urban areas around the world, because the lack of well designed rainwater drainage infrastructure, leads rainwater to mix with wastewater flow, since the capacity of drainage is not calculated by taking the rainwater into account, mostly these two flows coming together exceeds the capacity of drainage and overflow to streets and in the buildings. Therefore we needed two different rainwater collection, storage and distribution system for our neighborhood and their capacity is calculated by the sum of green roofs and hard urban ground surfaces, and their water catchment per months.
Second of all waste water treatment plants are located at the center of each super block, because as a result of scale research of treatment centers, it was obvious that smaller scale treatment centers are much more advantageous than big urban scale treatment centers, when we look at the examples of treatment centers in northern europe which work efficiently for eco-neighborhoods, we saw that they applied this system for per 2500-3000 people scale. Therefore we chose to apply it for our super blocks, and after some research through companies, we saw that it is also good for the maintenance of such complicated systems so it is advantageous for long term as well. WWTPs receive both grey and black water to their system and treat them separately. While only black water treatment center is WWTPs for grey water we have another system as well.
Finally the other grey water treatment system is a natural one, Wetlands, we have 6000 sqm area of wetlands on each quarter of our neighborhood, they receive pre treated grey water to their system and treat the water during time by their natural species, it provides bio-diversity to our system and water in city has a good impact on recreational system of surrounding.
WWTPs are represented as a system above. Here we can see that the water first passing through tanks that seperate it from the pollutians and then sludge as a ‘waste’ output of the system is actually used as an input for energy production. Biogas is produced by the black waste water of our urban system.
0 % WASTED WATER CYCLE
Here in the water layer we tried to explain which kind of analysis, calculations we have made and in the end which kind of systems and distributions we chose for our system. As we mentioned before, water is a layer that is connected all other infrastructural and even social systems of the urban areas. As we mentioned detailly above, water-food is directly related and working as holistic system. Water and matter is also interrelated since matter actually defines our way of industry and relationship with waste products. Water energy co-relation is a well-known and accepted relation. Since water is such a connected system it was hard to define the input-output, demand-waste relationship of our neighborhood.
To sum up our research on water, we started the process with a quick historical review and saw the interventions of different communities all around the world on water systems. Water demand-waste relationship was quite different for each economical system and each geoghraphy and climate. Therefore it was hard for us to take one place as an example.
We started by defining the diet of our people, water-crop relationship as we mentioned above detailed. Then we needed consider the unstability of water demand of agricultural system. Therefore we analyzed different agriculture types and their dependancy on seasonality. The ones which are effected by seasons changed the demand of water for each months.
Second of all we needed to consider the unstability of rainwater capacity of our system, rainwater capacity is calculated for different types of surfaces and different timelines. There we could see on each month how much rainwater we have ready to use. In the end we had a research about the distribution of different kind of recycling and treatment facilities. They needed to have different scales depending on their efficiency. And as a final note, we also use black waste water as an input for our energy production system.
We have been creating a new urban system, a system that produce its own things, foods, energy and is eventually not dependent as today’s communities to outside economies. The biggest aim of our system was creating a zero waste community. We eventually are depending on nature for our water, energy, food infrastructure however our aim is being independent and self sufficient in terms of economy, production, recycling and distribution. Because if we can create such a neighborhood, it is possible to imagine a new city.
Water Management Strategies for Self-Sufficient Neighborhood Prototype is a project of IaaC, Institute for Advanced Architecture of Catalonia developed at Master in City and Technology in 2015 by:
Student: Ilkim Er
Faculty: Vicente Guallart and Rodrigo Rubio
Assistants: Ruxandra Iancu and Alessio Verdolino
