How can technologies like LIDAR can help us understand the cities better?
How can we combine this with some other management processes like zonal statistics?
Which formats do we get out of lidar sensors and which are the different worksflows and analysis that we can perform in grasshoppper?
This work it’s an experimental approach on research and development of tools in order to get a better understanding of LIDAR technology and its combination with other tools.
Zonal statistics analysis and combination with cadastrial data
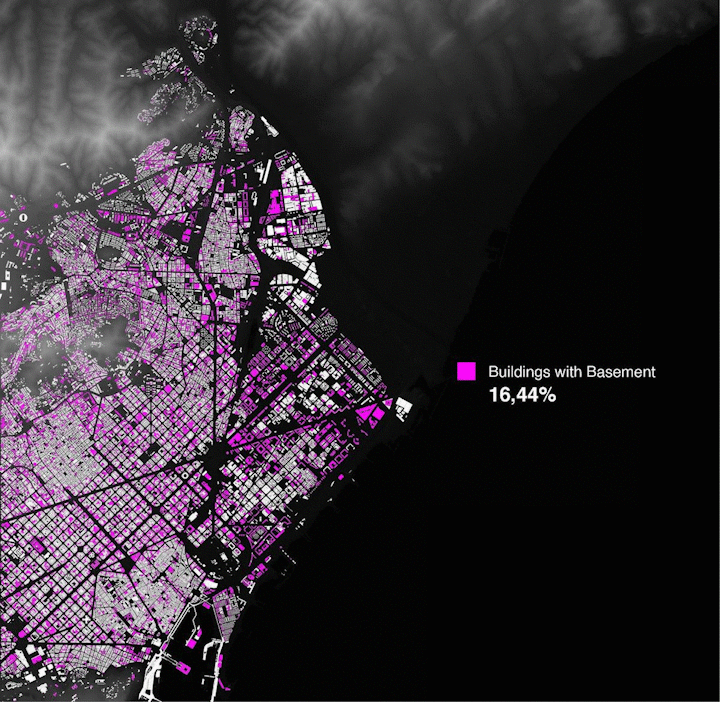
This map shows vulnerable Buildings(Basements) in comparison with the Flood Risk Area of the Besos River in Barcelona. The Proportion of Buildings with a Basements inside the Flood Risk Area is 3,18% higher than Barcelona’s Average Value of 16,44%. This analysis should animate to rethink the Vulnerability indicator for Flood risk areas due to outdated standards and new forms of vulnerabilities.
LIDAR technology. Exploration of different file formats and workflows in grasshopper.
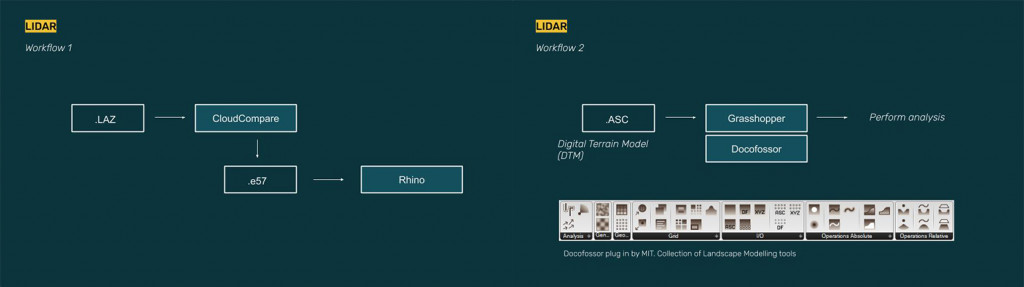
LIDAR data to Rhino, workflow 1 and 2
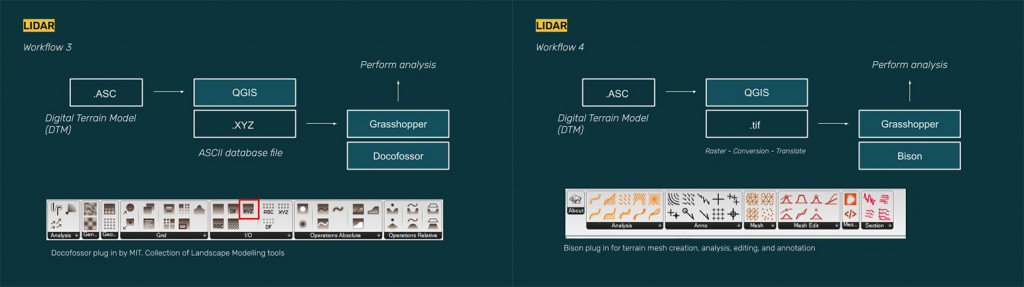
LIDAR data to Rhino, workflow 3 and 4
All data used for these analysis is coming from ‘Centro Nacional de Información Geográfica‘ and gh plug-ins are the Docofossor and Bison.
This first animation has been done using .ASC data and the plug in Docofossor. We were exploring how given the change of a point the shortest path to a specific point on the city would change based on the elevation of the terrain. This could be used to assess the energy needed to transport a certain element and achieve maximum efficiency.
A second output it’s using a .TIF image in order to generate a terrain model. The process seen at the animation it’s a tool from the plug-in Bison from grasshopper. This tool is showing from where the point that is being elevated in the z aix can be seen from the rest of the city (turning blue). Bison allow as well to have outputs such as sections through the terrain, flows and watersheds given a point on the space. You can learn more about Bison here.
This other animation has been realised using DTM (Digital Terrain Model) in .ASC format. This type of mesh has a coverage with 5m grid spacing. The simulation is showing how different parts of the city would be affected more and first. This could be a tool to assess risk areas on the city.
The studio project we are working with is tackling response of the city against emergencies, specifically pandemic response. However LIDAR data could be fundamental in disaster management and response in other scenarios. One example of this is the damage assessment carried by MIT Lincoln Laboratory collecting robust post-disaster lidar datasests to assess damange. You can know more about this here. LIDAR can be a very powerful tool, not just to assess were the disaster will impact the most but also to analyse damange and deploy help and resources for a rapid recovery.
Zonal Statistics and LIDAR data is a project of IAAC, Institute for Advanced Architecture of Catalonia developed in the Master in City & Technology 2019/20 by Students: Jochen Morandell, Rovianne Santiago and Alejandro Quinto and Faculty: Diego Pajarito
https://agen138slot.powerappsportals.com/
https://35.239.22.44/
https://34.142.151.46/
https://34.118.203.169/