What is My Plaza for?
Implementing a Machine learning Strategy for Predicting The Events in the Urban Square
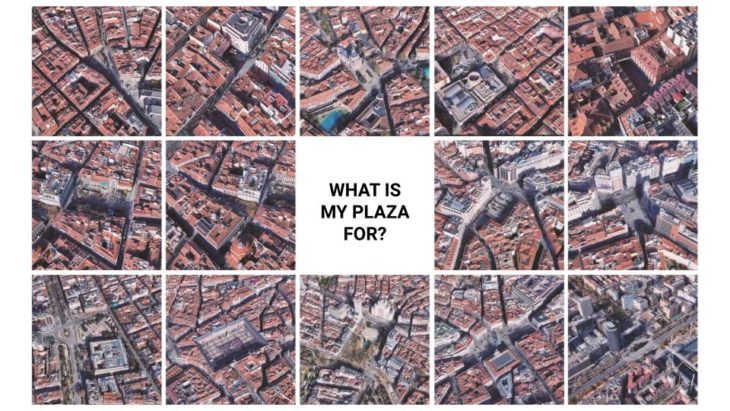
Plazas are an essential pillar of public life in our cities. Historically, they have been seen as public fora able to house public events that fostered trade, interaction, and debate. However, with the rise of modern urbanism, city planners treated them as part of a grander architectural scheme overlooking their social importance. As a result, squares have lost their function and value. In these past years, awareness has risen of the need to re-activate these public spaces as a way to strive for social inclusion and urban resilience.

Our machine learning workflow is defined in 5 stages: Metric definition, Geometry generation, Dataset creation, training of the ML model, and evaluation of the results.

METRICS DEFINITION
The metric factors to measure the livability of the plaza are the number of people and the high degree of comfort, which are evolved from three subcategories: external, shape, and design factors.

METRICS DEFINITION | FEATURE EXTRACTION
According to Jan Gehl’s theories in Life Between Buildings: Using Public Spaces, outdoor activities in public spaces can be divided into necessary activities, optional activities, and social activities.
Because necessary activities are essential, the physical environment can only have a slight influence over their occurrences and they happen in nearly any condition.
On the contrary, for optional and social activities time and place also should be suitable. Because the occurrence of activities relies on outer physical conditions particularly, improvements in the conditions in public space can support social activities indirectly. Thus, the degree of comfort and amount of people that a place can gather, increase its attractiveness and the likelihood of one type of activity or another occurring in it.

METRICS DEFINITION | FEATURES EXTRACTION
We extracted some of the features for our plazas from open street maps and others geometrically from rhino and GH.

GEOMETRY GENERATION
The analysis of the initial 15 study cases is reduced to plazas located in the city of Madrid.
This decision simplifies the process by assuming that all the items share the same cultural and environmental conditions.
To try to include as many urban situations as possible in this research, squares of different sizes (small, medium, and large) have been selected.

Analyze 15 existing plazas to define their features and create an initial dataset.

Therefore, the initial hypothesis considers the probability of any of our target events occurring in a place is much more dependent on its design factors than on its size.

TARGET EVALUATION
The amount of ACTIVITY and degree of COMFORT of each plaza in the initial dataset is analyzed and scored to label them according to one of the events to predict.

DATASET CREATION
An initial dataset large and balanced enough in samples and urban situations is needed to train the classification model. The process is achieved by generating a Kohonen Map that interpolates the values of the initial squares and produces around 2000 unreal items.
After testing different combinations to determine which size of board better allows the seeds to occupy the boundaries of the map (30×70, 40×50, and 45×45), the square ratio of 45×45 seems to produce the most distributed results.

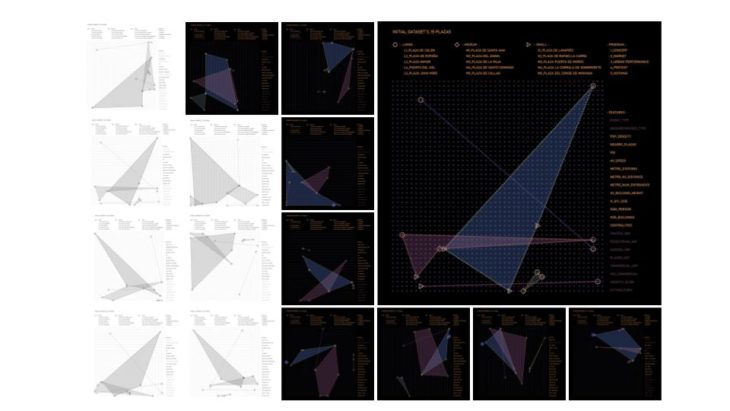
INITIAL DATASET – 15 PLAZAS
The first attempts to produce a dataset show that two of the initial large squares (Pl. de Colón and Pl. de España) are always positioned at the limits of the board, while the others tend to be grouped together.
Despite the modification of the initial attributes, these two items condition and unbalance the dataset, since the program assigned to them is overrepresented compared to the rest of the event types.

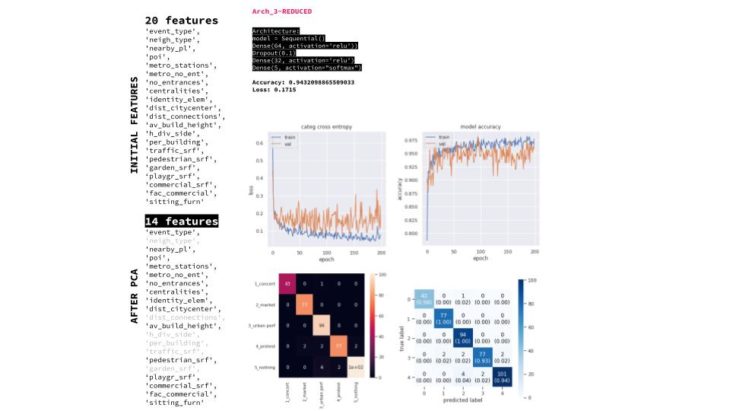
MACHINE LEARNING | SL CLASSIFICATION MODELS | REDUCED FEATURES

UPDATED DATASET – 13 PLAZAS
After excluding these two samples and repeating the analysis with the same variation of parameters, it is found that the programs tend to become more mixed and occupy larger portions of the board.
However, in most cases, the initial items do not span one or two ends of the board, causing the majority of events to be underrepresented in the initial dataset.
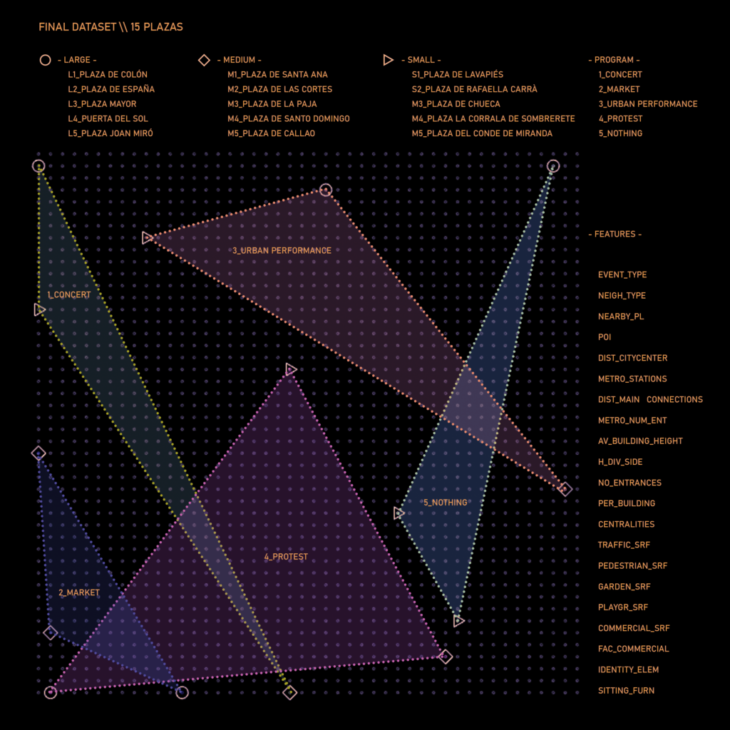
FINAL DATASET – 15 PLAZAS
Finally, two of the initial plazas (one small-sized and one medium-sized), whose urban features placed them extremely close to others of different use and, therefore, reduced the number of samples relating to both programs, are replaced with two other items with some geometrical factors that were overlooked in the first analysis.
The two large squares previously excluded, as they positioned themselves on the boundaries and expand the board, are reintroduced as a case study.
Finally, some of the metrics initially considered are modified or refined with the intention of avoiding highly correlated values (directly or indirectly) in the dataset.
These types of variations and backward steps in the creation of our dataset highlight, once again, the complexity of including the appropriate metrics to analyze public spaces without oversimplifying the parameters that define them.

MACHINE LEARNING | PCA ANALYSIS
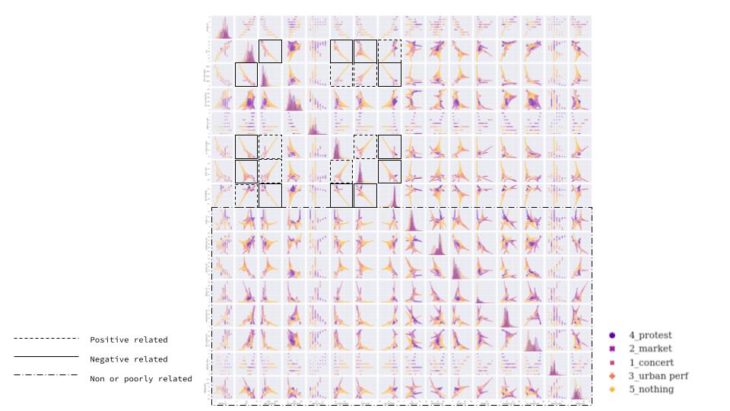
BIVARIATE DISTRIBUTIONS
By extracting a pairplot diagram we can understand the pairwise relationship between different variables in our initial dataset. From this first visual analysis we can interpret the following:
. In general, the type of event 5_nothing is the one that presents the greater variability among its items and the greater relationship of proportionality with certain factors compared to the rest.
. The following pairs present a positive relationship:
poi & per_building
dist_citycenter & av_building_height
dist_citycenter & h_div_side
. The following pairs present a negative relationship:
poi & dist_citycenter
poi & av_building_height
poi & h_div_side
per_building & av_building_height
per_building & dist_citycenter
per_building & h_div_side
. The following pairs have little or no relationship:
traffic_srf / pedestrian_srf / garden_srf / playgr_srf
/ commercial_srf / fac_commercial / identity_elem /
sitting_furn with any of the other parameters.
CORRELATION HEATMAP – PEARSON COEFFICIENT
By plotting a correlation matrix we can study the covariance between the features considered for our plazas and, in case of observing a high (direct or indirect) proportional relationship, analyze if that covariance implies causality or if it is due to the effect of a third variable, such as the type of event.
In this case, a high proportionality is observed between the number of nearby squares and the number of POIs.
When performing an exclusive heatmap for each type of event, these two columns present covariance for each of the cases, so we can consider reducing one of these parameters to simplify our study model.
Some relationship between other pairs of features is observed in the individual analysis per type of event, but they are not considered relevant for the model since this covariance is not observed in the general matrix.

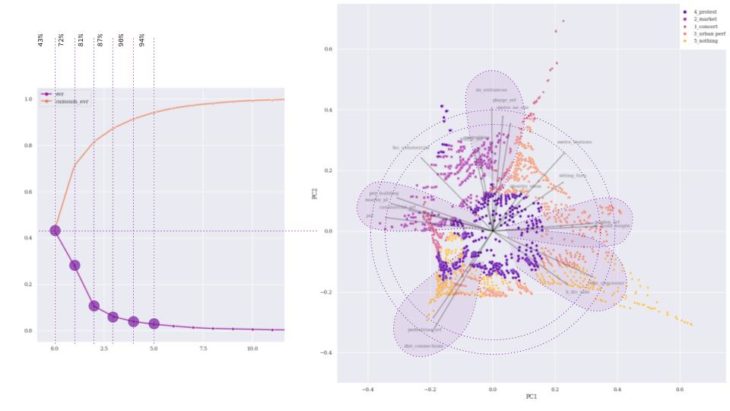
BIPLOT PRINCIPAL COMPONENT
By bi-plotting the results of our first two PCA analyses on a two-dimensional graph it can be determined (as in the subsequent heatmap) that, although some events are more related to certain parameters than others, most of our indicators have a similar relevance in the prediction of our target if we consider all possible events. In consequence, the first attempts of our classification model will consider all the initial metrics from the dataset.
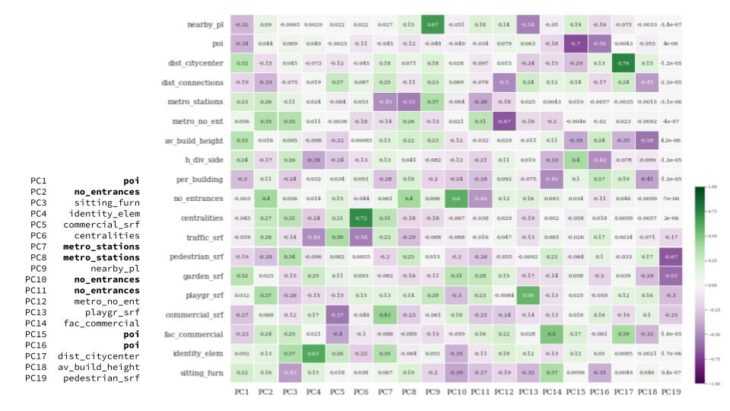
PRINCIPAL COMPONENT HEATMAP
In the relationship matrix between the features and the PCA analysis, we can observe that for the first three iterations none of our parameters stands out as highly determinant for the prediction of our target, which reveals that the definition of our initial metrics includes sufficient variability to the model.
MACHINE LEARNING | EDA
During the exploratory data analysis, we saw a lot of feature overlapping.

MACHINE LEARNING | SL CLASSIFICATION MODELS
Three SL models were tested. All giving a good performance over 93. Meaning possible overfitting due to our plaza encoding.

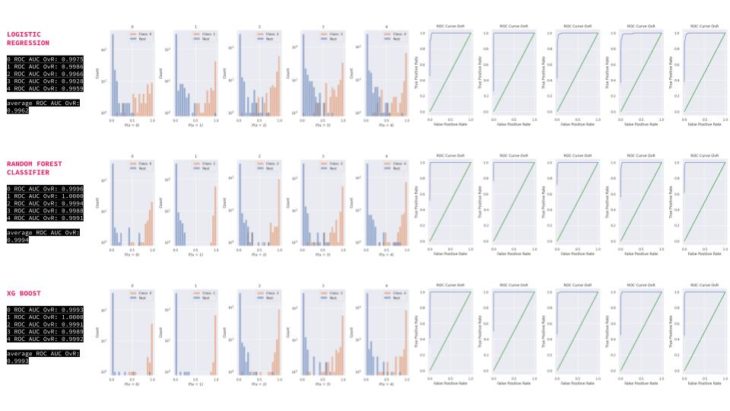
MACHINE LEARNING | SL CLASSIFICATION MODELS | ONE vs. REST
We followed the One vs Rest approach to see in detail model performance and confidence, most problematic labels are 4_protest and 5_nothing, also 3_urban perf.
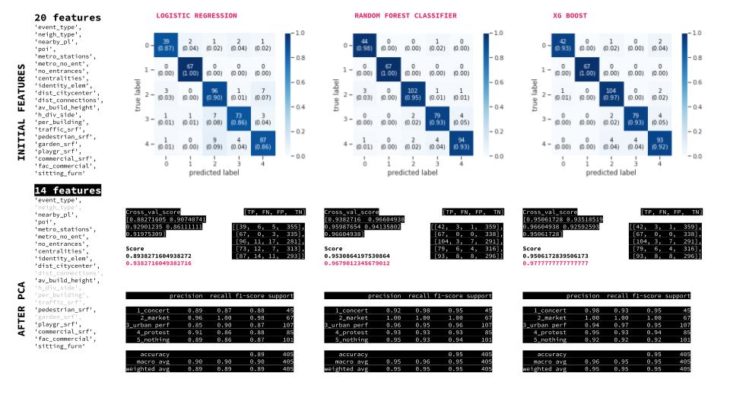
MACHINE LEARNING | SL CLASSIFICATION MODELS | PCA REDUCED FEATURES
Reducing features from the PCA gave a worse performance which is a good indicator of the relevance of our metrics.
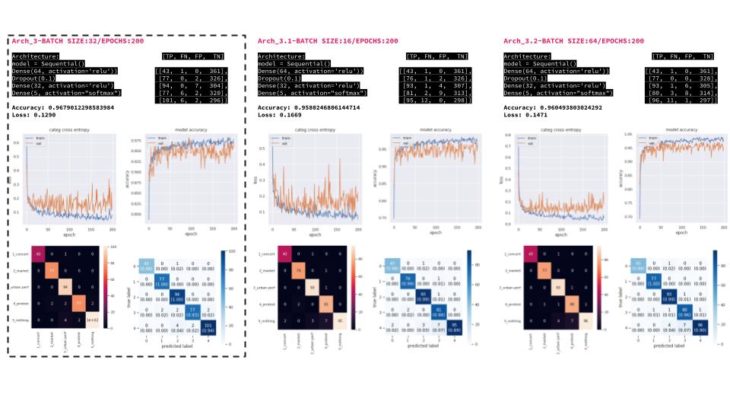
MACHINE LEARNING | ANN CLASSIFICATION MODELS | BATCH SIZE: 32 / EPOCHS: 200
We tried different ANN architectures that tried having good accuracy but also a low loss to avoid having weirdly labeled plazas with programs that would not work on them. Simple models tend to work better.

MACHINE LEARNING | ANN CLASSIFICATION MODELS
Changing batch sizes didn’t improve the performance and increased overfitting.
MACHINE LEARNING | ANN CLASSIFICATION MODELS | PCA REDUCED FEATURES
Reducing features from the PCA did not improve performance either
MACHINE LEARNING | SPOTTING THE MISLABELED | XG BOOST
5_nothing and 4_protest are the classes that have greater overlap with the rest, hence mislabeled plazas are mainly of these types.
With our current features, 2_market is the most accurately represented class by the features.
Negative values were created during the Kohonen map generation, making the measure unreal and perhaps difficulting for the model’s learning.
The gaps between different data points of the same class in different features confuse the model.

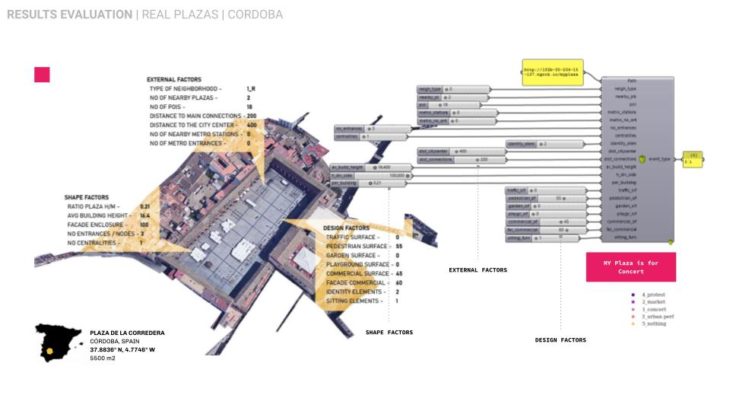
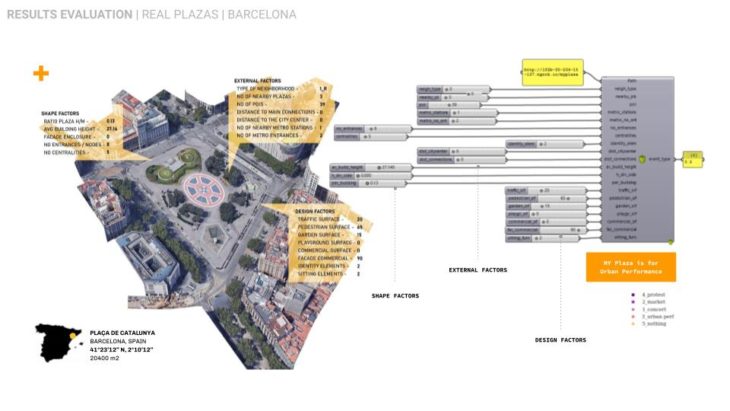
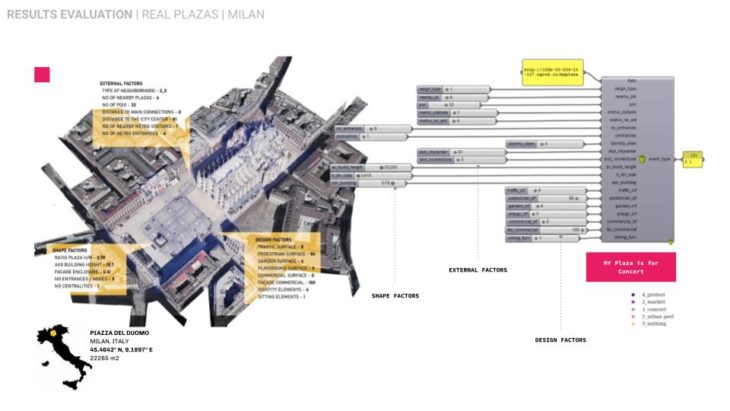
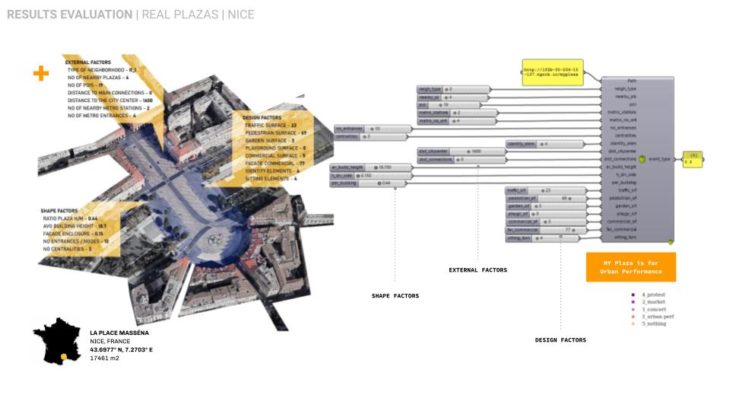
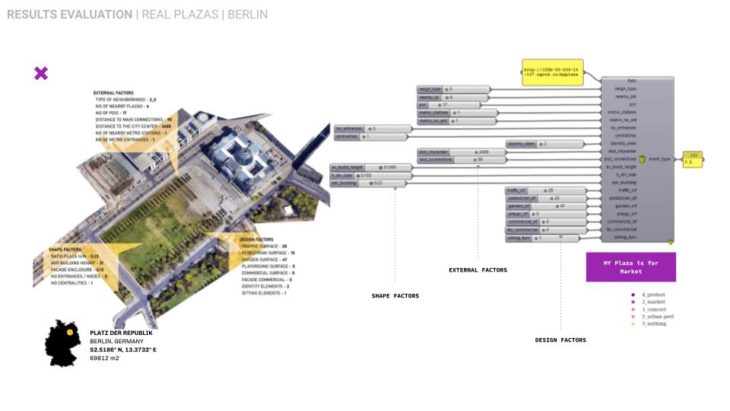
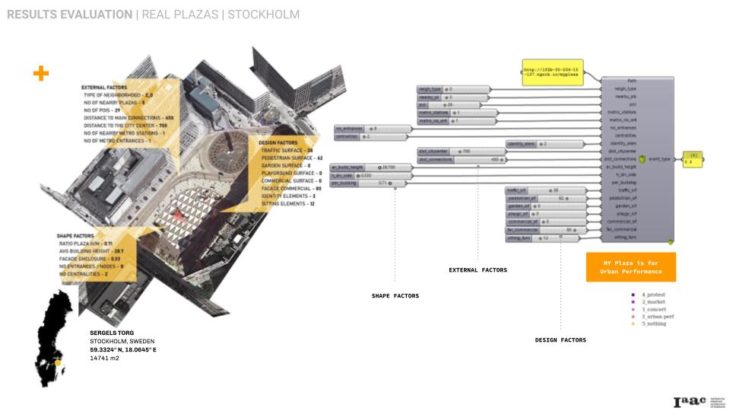
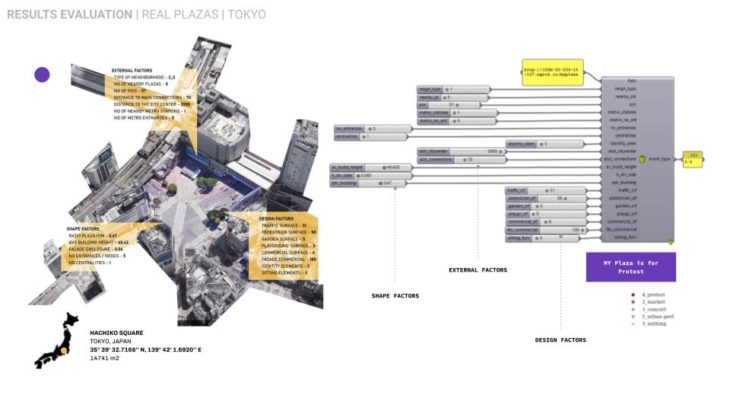
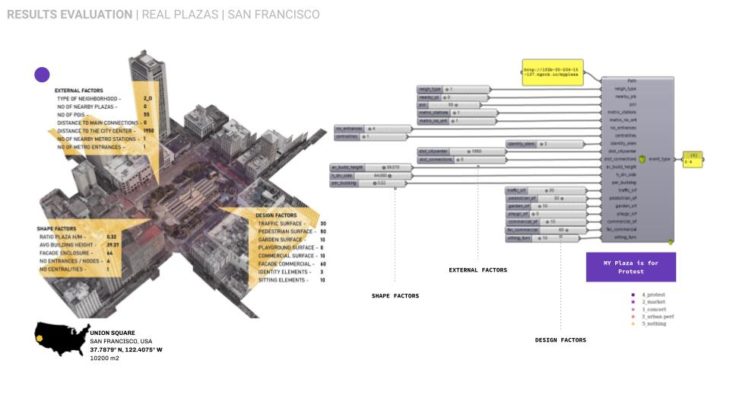
RESULTS EVALUATION | LOCAL ML PREDICTION/HOPS
Here’s a case study to predict/visualize a plaza using our ML model on a parametric geometry where you can define your own parameters in GH, with the surrounding environment from OSM

To predict the event on real plazas we deployed our model on a series of 9 plazas worldwide in respect of geographical proximity to Madrid sharing similar or different cultural and environmental conditions.

CRITICAL CONCLUSIONS / FURTHER STEPS
- In terms of the workflow level, we have found our approach to be very efficient by dropping out certain plazas and features and injecting them back to understand the complexity of the architectural model outcome.
- PCA and quick model training were used to understand the different features added to the dataset and improve how to measure the confusing ones.
- For the final dataset, removing the least relevant features from the PCA did not improve the models’ behaviors.
- Even though there was a clear overlap between classes for most features, SL models performed better than DL ones.
- After checking the mislabeled plazas, we realized that the Kohonen interpolation had introduced unrealistic values that probably hindered the model’s performance.
- In Evaluation Some of the real plazas didn’t predict accurately, due to the single-label classification.
- For further research, applying some techniques can enhance the model like re-curation of the dataset especially checking the borders of the Kohonen map, originating a multi-label classification where each plaza may belong to several predefined categories, a further refinement of model hyperparameters and architecture, especially for the ANN could enhance the learning process.
- In order to handle the main three key attributes of contemporary urban space: complexity, diversity, and uncertainty, we need to construct complex ML models of multiple distinct approaches, operating in some combination of parallel and sequential synthesis.
WHAT IS MY PLAZA FOR? is a project of IAAC, Institute for Advanced Architecture of Catalonia developed at the Masters in Advanced Computation for Architecture and Design in 2022 by Pablo Antuña Molina, Lucia Leva, Jumana Hamdani, and Faculty: Gabriella Rossi, Hesham Shawqy.