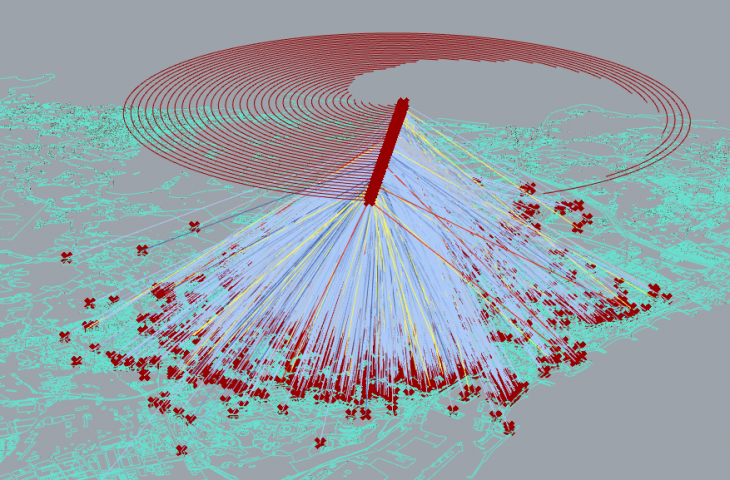
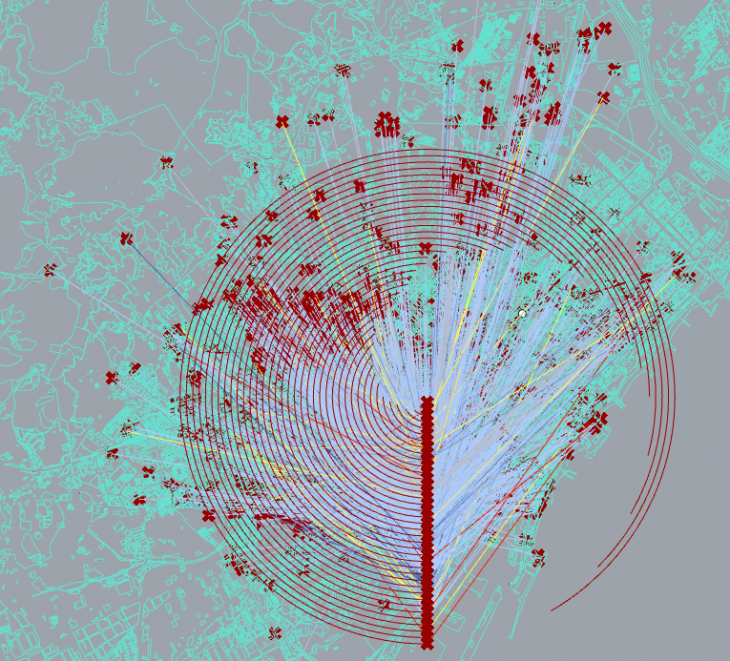
The concept of this project was to visualize the closing hours for restaurants at 6pm on a Friday night. I did this by taking restaurant data from OpenDataBCN and geolocating it up against a Barcelona Shapefile. The restaurants connect to an “Arc-Clock” which is an arc that starts at 6pm and the length of the arc determines how long the restaurant is staying open in the same way a clock’s hourly hand would.
The first step of the project was achieving the data from OpenDataBCN. I found the restaurant data set, and noticed that it contained the opening and closing hours for each restaurant. The data set needed to be cleansed a bit, so I ran a couple of different google sheet equations in order to do that. These equations included determining which hourly schedule was for Friday, converting the time in duration to a number format (since past midnight closing hours start with durations of 0:00), and isolating rows from the data set until I had unique Friday night hours for each restaurant.
Now that I had the restaurant data set, I inputted both the data and the Barcelona polygon shapefile into Grasshopper. The next step in the Grasshopper file was to georeference the data such that the data points lined up with my shapefile. Once I did that, I started to construct the “clock.” The clock would be a collection of arcs, each with a different arc angle. To determine the arc angle such that it represented the correct movement of the hourly hand, I created a formula within Grasshopper to determine the angle. After that, I positioned my clock to be in the midst of the restaurants and extruded it for visual purposes. The final step was to connect the restaurant geolocations with the start of whichever arc represents their store hours.
Although I do like this concept in blending time with geolocations, I do believe the visualization could be improved with more Grasshopper funtionality. Moving forward, there are a couple of styling ideas that could have improved the visualization. I would have liked to show the volume of the arc somehow (possibly extruding it based on the amount of restaurants), and labeled the closing hours as well. I also believe color gradients and other color decisions would have improved the map.
City Data View is a project of IAAC, Institute for Advanced Architecture of Catalonia developed in the Master in City & Technology in 2019/20 by Student: Andrew Saltzman Faculty: Rodrigo Aguirre