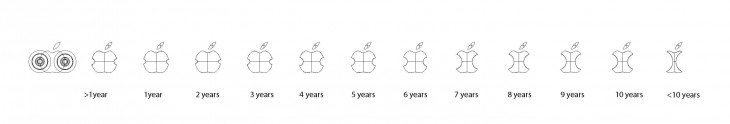
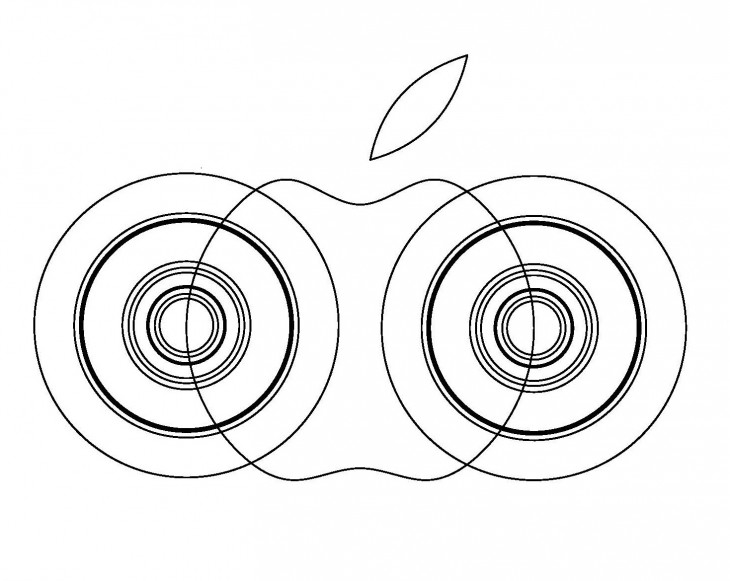
In this assignment I decided to visualise the age of the cars in Barcelona as bites on an apple. The oldest the car, the bigger the bite.
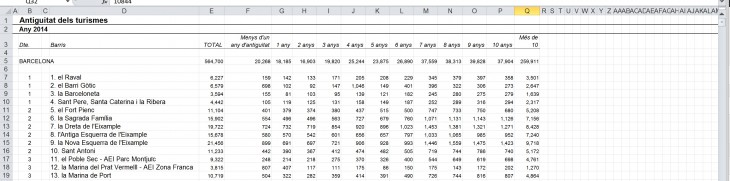
At first, I found my necessary data and I organised it in an excel sheet. It had a lot of information, so I created new columns placing the number of cars in the whole city, not in every neighborhood.
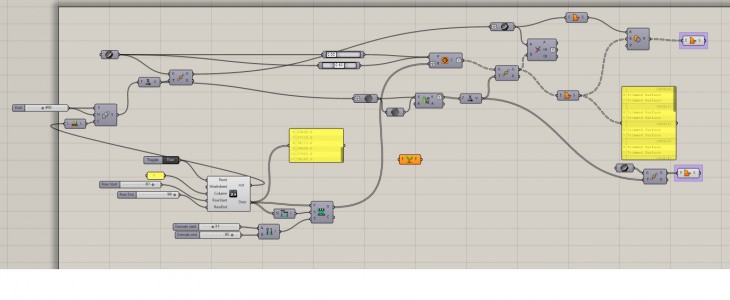
Then, I created the grasshopper definition in which Lunchbox was used in order to get the data from the excel file.
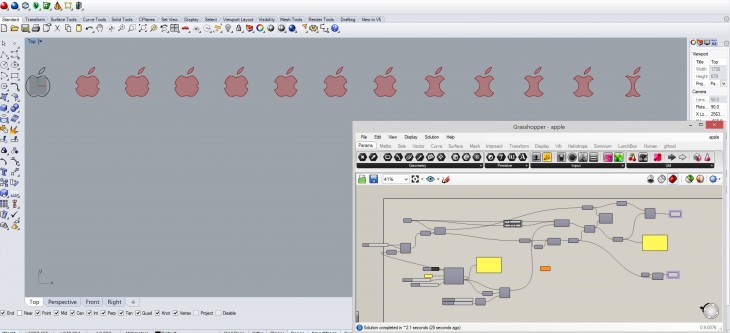
finally, I had several bites in the apples. The diameter of each bit represents the age of the cars. While at first they appeared overlapped, I change the distance between them
Geolocation:Age of Cars in Barcelona is a project of IaaC, Institute for Advanced Architecture of Catalonia
developed at MAA01 in 2015-2016 by:
Student: Maria-Klairi Chartsia
Faculty: Luis E.Fraguada, Rodrigo Aguirre