Visualising Data | Accidents in Barcelona
Data is no more than a set of numbers on which one acts to extract certain characteristics which in turn can be made into information. Data thus is the material by which we create understanding and knowledge. While seemingly objective, the way data is obtained, stored, and retrieved must always come under scrutiny, as any of these steps could be manipulated in order to influence certain informative conclusions.
Today we have access to data in many forms and from many sources. Increasingly, we too can become sources of data through many new initiatives.
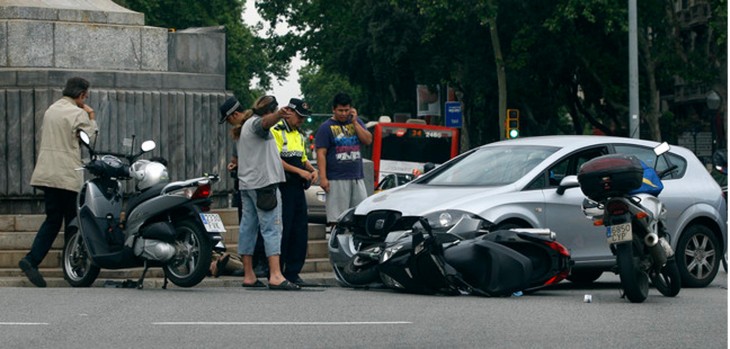
The data to visualise is Accidents in Barcelona city. Accidents are very common in a country like mine (India). However, in Spain. there is only one accident that I witnessed near Sagrada Familia. Hence, I looked further for more statistics to visualise where most acccidents happen. This information might help in controlling the traffic and pedestrians and be more careful.
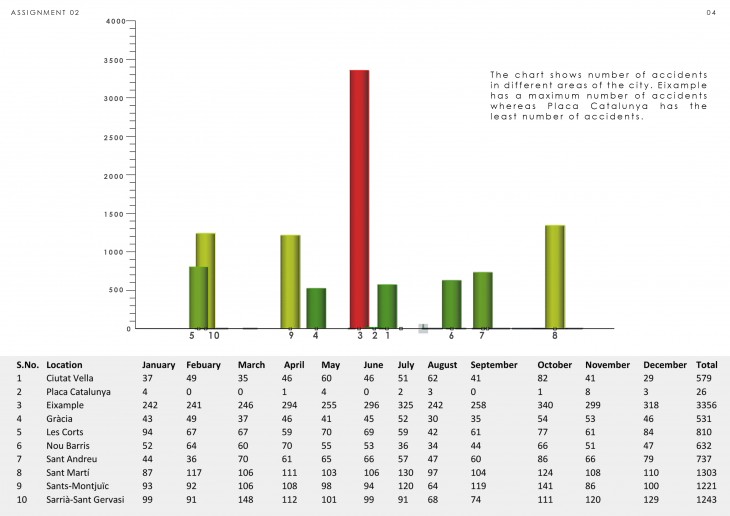
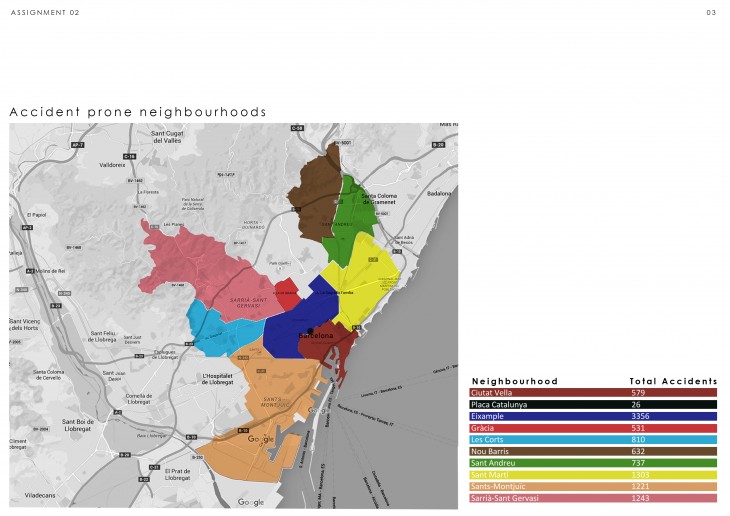
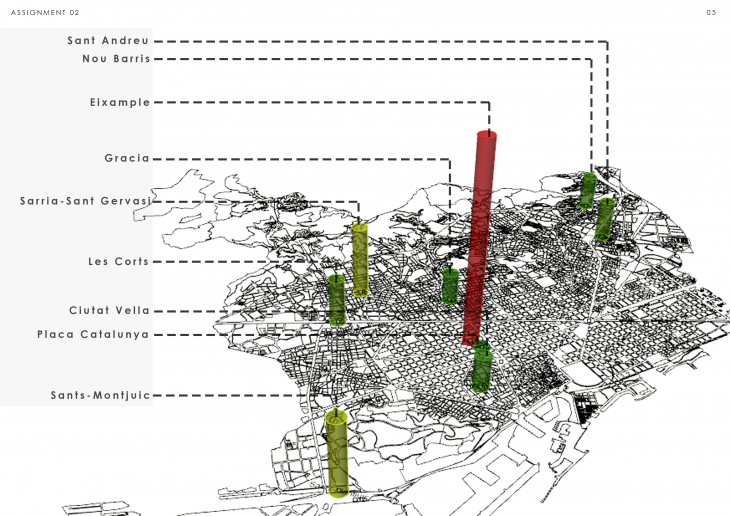
The chart shows number of accidents in different areas of the city. Eixample has a maximum number of accidents whereas Placa Catalunya has the least number of accidents.
Visualising Data | Accidents in Barcelona is a project of IaaC, Institute for Advanced Architecture of Catalonia developed at Master in Advanced Architecture in 2015-2016 by:
Students: Viplav Goverdhan
Faculty: Luis Fraguada