Abstract
According to the UN, the projection of shifting from rural to urban areas has increased over the years is expected that two-thirds of the world’s population will be living in cities by 2030. Not least because of their population density and climate changes, cities have now become a huge focal point when it comes to sustainable development. By 2008, more people were living in urban areas than in rural settings (3.3 billion) leading to the so-called Megacities.
These are not the only signs of increased urbanization with the numbers of small and medium-sized cities also growing steadily. This phenomenon brings limited access to land in cities, high costs of food, water, electricity, transportation, housing, education, and healthcare, as well as contributing to urban poverty and inequality. Rapid urbanization growth requires vision and responses, like the ones defined in the Sustainable Development Goals (SDGs). To realize the promise of the Sustainable Development Goals (SDGs), governments and international organizations need to improve the way to identify and support the urban poor and we as architects should be in the lead of that understanding.
Our project aims to explore processes for a network of metrics for urban analysis that could lead to possible interventions directly associated with the UN sustainable development goal in a certain built environment not based on just environmental analysis but rather focus on social and infrastructural needs.
Objectives
- To explore a new workflow with the potential of quantizing and predicting on social and infrastructural needs of a city based on the UN SDG indicators.
- To unveil the possibility and efficiency of using web interfaces as a means of sharing the data analyzed to various stakeholders in developing a city such as policymakers and real estate developers
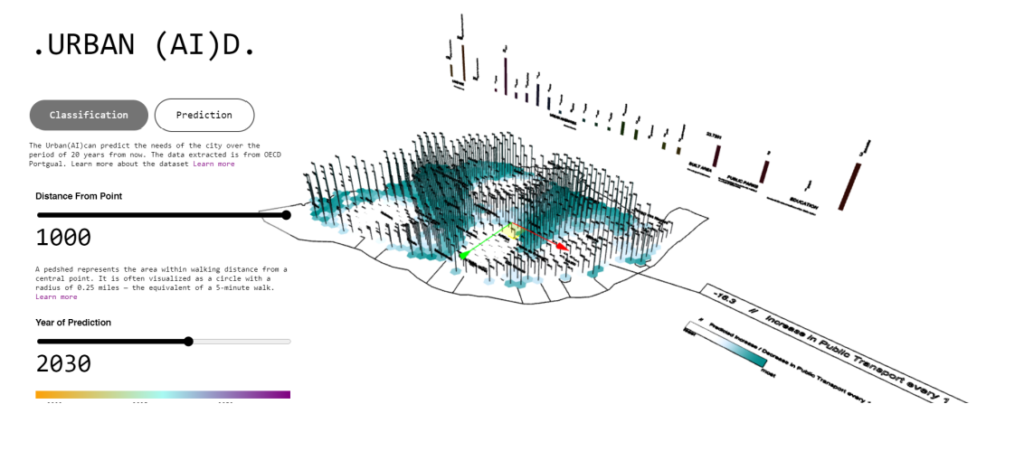
Here is a video preview of the Urban Policy Artificial Intelligence tool to understand the tool better. The link is live on –
https://urbanaidlisbon.wixsite.com/urbanai.
</p>
Research Process and Method
1. Understanding SDGs + City data
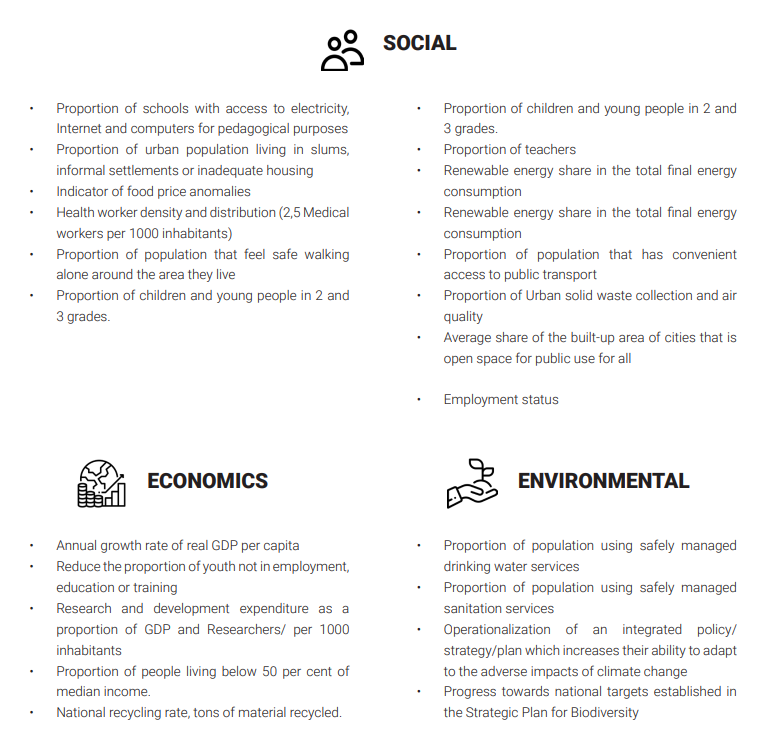
As our first approach, we tried to understand the difference between the SDGs and their indicator and how they are divided. With a total of 17 goals and 247 indicators, they can be grouped into 3 main areas – Social, Environmental, and Economic. Starting from there, and as shown under, we have collected a sample of SDGs that could be applied to the Lisbon study case.
2. Data processing using PCA
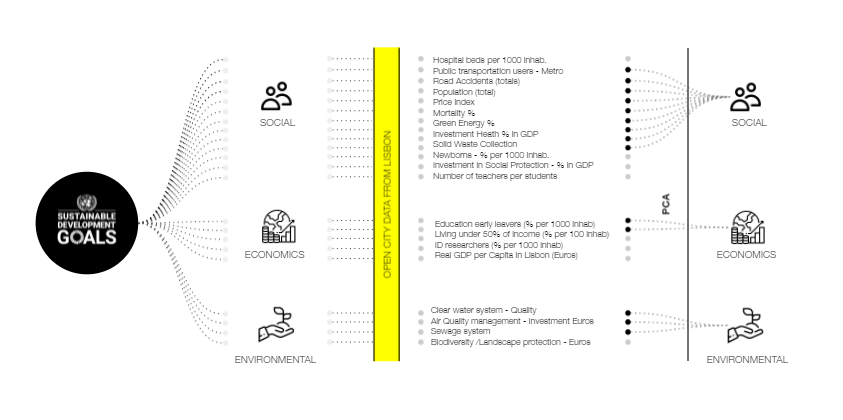
After choosing the 23 Sustainable development goals that could be more relevant to our location, the next step was to correlate them with different open data available from the city of Lisbon and run a Principal Component Analysis (PCA) to narrow it down to the most relevant datasets PCA.The procedure of PCA is usually used to reduce the dimensionality of multivariate datasets, which can be an important step for the Indicators data processing – as we have 247 SDGs indicators which relate to the urban environment.
In our case study, we analyze SDG indicators in relation to the Lisbon open dataset to understand the correlation between the different indicators. By doing it we can understand which ones are most relevant (less correlated) to be used in our machine learning training process.
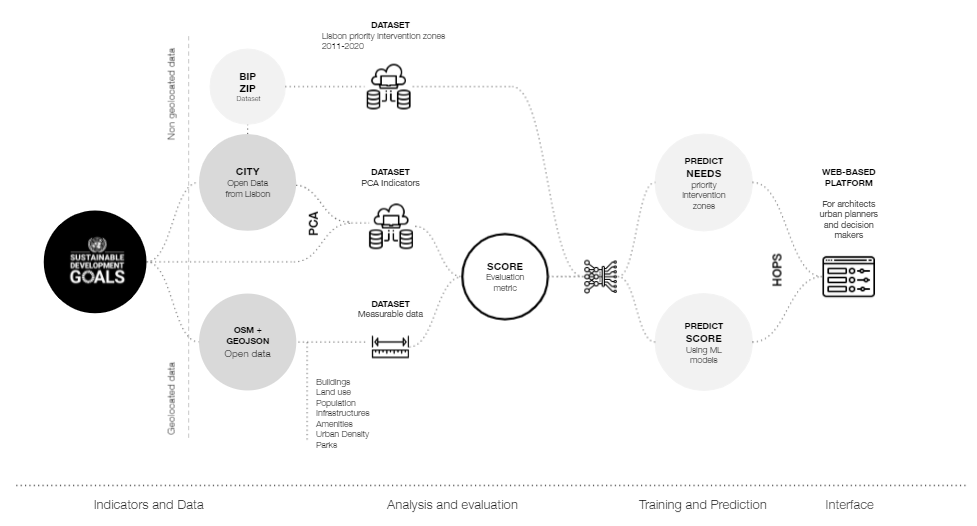
3. Deriving Overall Desirability of Each Locality
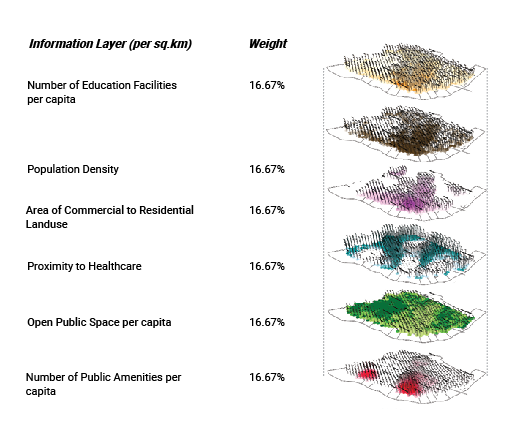
Our workflow starts from the SDGs goals, a total of 247, and finds correlations to the available data, geolocated or non-geolocated. The geolocated will be used mostly for measuring features and amenities while non geolocated to measure KPIs for social, economic, and environmental ratings in the city. The overall score of each locality broken down into chunks of 1 sq.km (based on SDGs) referred to by the city is derived by distributing the different metrics in equal percentages across the overall score.
The percentage weight for each metric derived in the overall score is as shown on the right. The overall score heat map generated then helps us understand which parts of the city are desirable.
After gathering the data in an evaluation metric, we use it to predict the infrastructural needs of the city over time in the near future (for the next 20 years), as a tool for urban planners and decision-makers using ANN regression.
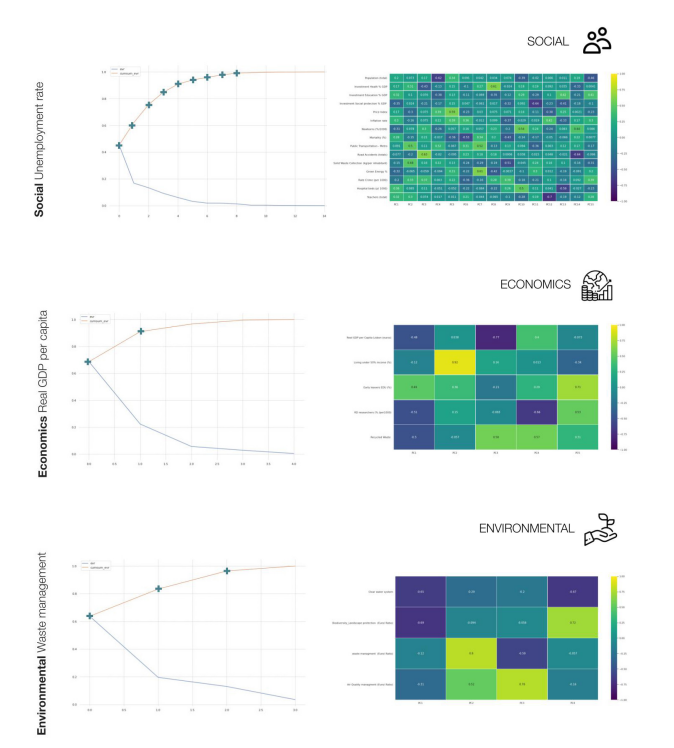
4. ML using ANN Regression
Using the results of the PCA, we have then built our own Indicators dataset for the city of Lisbon using the open data available between 2001 and 2019. The Lisbon indicators dataset was used to train our machine learning model. We have created 3 different sets of correlations corresponding to Social, Economic and environmental themes and trained our ANN regression model. At the end, the model trained can be used to obtain the existing evaluation for the current year, as well as our predictions through a workflow that uses Rhino.Compute App Server, Hops component in grasshopper and Flask Application.
5. User Interface Development Workflow
The workflow consists of 2 types of datasets – one from the Open Street maps (OSM) which is an open-source geographic database and the GEOJSON data by the organization BIPZIP managed by the Lisbon City Government. In combination, we have used OSMx library to extract the open-source data and the Flask App is used to push the ML predictions to the cloud. The data is then visualized using Node.js and Rhino compute app server in a web interface where the users can interact and display the data.

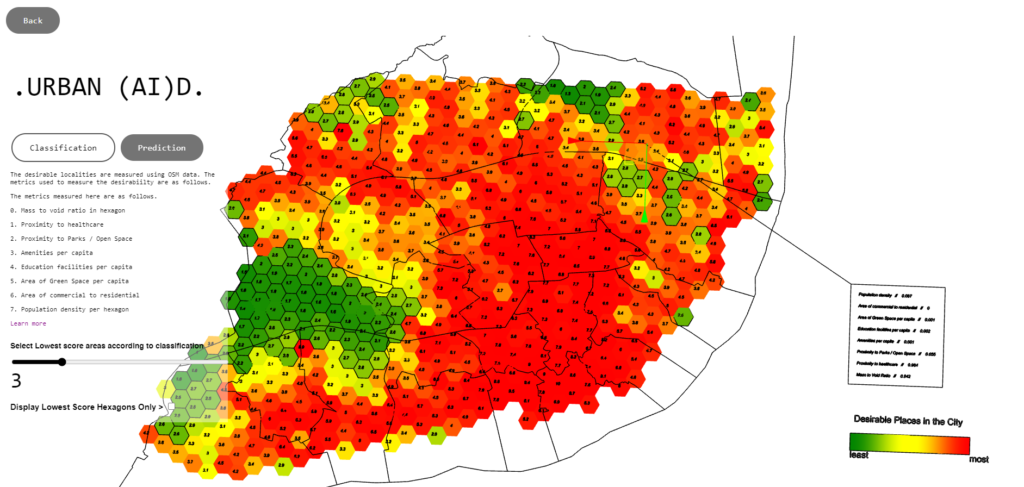
By using OSM we can extract a large amount of geolocated information and some of it corresponds with some parameters defined in the SDG’s. The distances to Health cares, Urban parks or Educational buildings are some of the examples of parameters to measure and follow up life quality in the urban scene.SDGs are defined in some cases by the sense of proximity to amenities or institutions. Proximity to public transportation or urban open parks, as well as the number of research institutions around us, are some of these indicators and can help to evaluate, for example, our quality of life or innovation status.
The city map is divided into a hexagonal grid of 1 sq.km and devised a way to come up with an evaluation score showing the most desirable parts of the city shown in red and the not so desirable parts of the city according to the criteria shown in green.
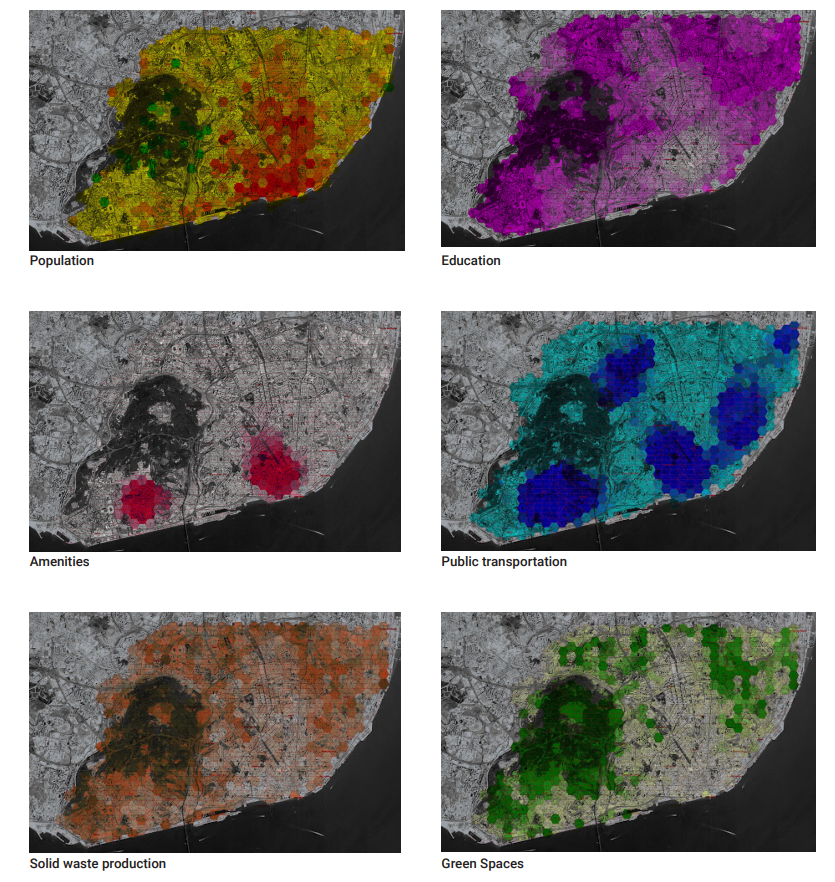
6. Predictions
Since we have data for the past 20 years it was possible to predict the needs of the city in the future. For that, we had to correlate the non-spatial metrics for the past 20 years with the spatial metrics. For example, we realized that the percentage of newborns is directly related to the healthcare amenities as the number of newborns increases the number of healthcare amenities required to take the load has to be more. Similarly, population density is directly proportional to the solid waste produced. In a similar manner, we have defined 5 correlated metrics as shown. In the figures below, the darker colour shows the increased requirement where the lighter colour shows less requirement of each of the metrics shown.
Prediction samples
- Predicting Requirement of Green Open space in m2
- Predicting Population over time
- Predicting Requirement for number of Amenities
- Predicting Requirement for Public Transportation Nodes
- Predicting requirement for the number of Education Facilities
- Predicting the solid waste generation in tonnes
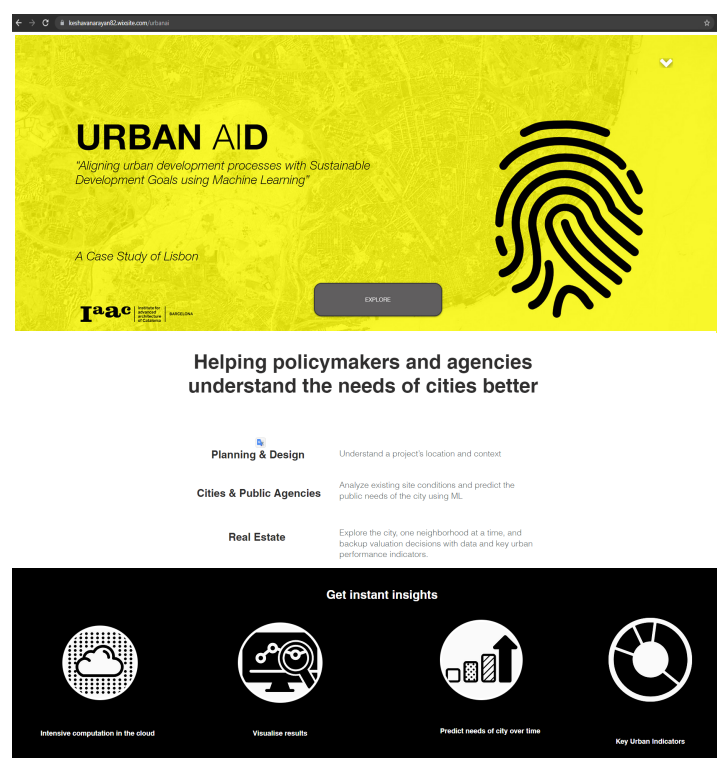
7. Urban (AI)D Interface
With the goal of helping policymakers, architects and urban planners to evaluate and understand the needs of the city better, Urban (AI) have its own APP. This app can be used in Planning & Design, Cities & Public Agencies and Real Estate. The app uses Rhino.Compute with Rest API. The Urban (AI)D interface is live at
https://urbanaidlisbon.wixsite.com/urbanai
.
Findings/Conclusions
1. On Workflow
We believe that this research has presented very positive results in breaking down the workflow between urban indicators analysis and machine learning and it can, in our opinion, be considered as a workflow for further exploration. The workflow methodology seems to translate well the SDGs indicators and it shows that machine learning methods along with pure statistical methods such as Principal Component Analysis (PCA) can help to narrow down the complexity that sustainable development goals represent.With the final goal of output performance metrics of the urban environment that can guide architects and decision makers to informative interventions, the Urban (AI)D workflow seems to respond positively not only in its results but also in its capability to be replicable.
2. On SDG indicators
The direct translation from indicators to data cannot be done directly. The choice of indicators is quite dependent on how much a city is developed. While some indicators gain meaning, others lose. In addition, the use of only public open data can limit the final results, which makes us believe that collaborations with institutions with direct access to official data can be an advantage.
3. On the app
The deployment of the application made us understand that there is a possibility of making AI accessible for urban planners, real estate developers, and policymakers. However, sufficient back-end work was done by us to integrate the data with the predictions and display it in a visually understandable manner. Since the data used now is completely open-source and the workflow completely established, the next step is to make this available for every city with minimal human/developer intervention. For eg extend the app for various cities like Mumbai / Moscow / Barcelona with the click of a button.
Urban (AI)D is a thesis project of IAAC, Institute for Advanced Architecture of Catalonia developed in the Master in Advanced Computation for Architecture & Design in 2020/21 by the students Pedro Arrozeiro Ribeiro and Keshava Narayan with Faculty Angelos Chronis.
REFERENCES
- UN Sustainable Development Goals –
https://sdgs.un.org/goals
- UN SDG Report 2020 –
https://unstats.un.org/sdgs/report/2020
- The role of AI in achieving the SDG –
https://www.nature.com/articles/s41467-019-14108-y
- AI for Good — How Artificial Intelligence can Help Sustainable Development –
https://medium.com/@C8215/ai-for-good-how-artificial-intelligence-can-help-sustainable-development-58b47d1c289a
- Megacities –
https://en.reset.org/knowledge/megacities-07152014
- Urban Threats –
https://www.nationalgeographic.com/environment/article/urban-threats
- Using AI to help achieve Sustainable Development Goals –
https://www.undp.org/blogs/using-ai-help-achieve-sustainable-development-goals