Understanding Barcelona
Despite economic growth and reductions in overall poverty worldwide, the gap between rich and poor has increased between 1990 and 2015, creating economic and social challenges.
As cities change, they frequently become sites of discord and confrontation. This rising inequality is due in part to a decrease in middle-income jobs, lack of affordable housing, poor access to higher and further education, and neighborhoods that are largely segregated by income and race. In cities like London, social equity has improved overall.
Nonetheless, the city remains unequal in terms of wealth and income, with 50 percent of wealth owned by the richest 10 percent of households and the poorest 50 per cent of households owning just over 5 percent of wealth.
In the specific case of Barcelona, the aging of the population and the increase of international migration (needed to keep the economy up) has led to phenomenons such gentrification and socio-economic segregation in some parts of the city.
In addition, the exponential growth of Tourism caused aggravation in the of the people in Barcelona. This is partly due to urbanistics laws like Decret 159/2012 that allowed the increase of Housing used for Tourism (Hut(s)) in the city and the rise of ‘sharing economy’ platforms such as Airbnb.
All of these factors have created a social challenge of coexistence that needs a different dynamic strategy towards how to tackle the issues in the city.
Projects like Llei de Barris (2004-2011), Pla de Barris (2016-current), restrictive laws like PEUAT or initiatives like B-Mincome try to improve the needed neighbourhoods of the city and combat inequality in the most deprived areas.
However, cities are being made and remade at a faster pace now than ever. Consequently a more dynamic approach needs to be addressed. An hybrid approach where statistical data gets supported by Big Data.
“By reviewing existing segregation studies, we feel that it is time to think about a new metrics that can deliver a dynamic and multidimensional view of segregation in cities. But what features should this metric have? What things need to be measured?”
– Conquer the Divided Cities by Yang Xu and Carlo Ratti
Methodology
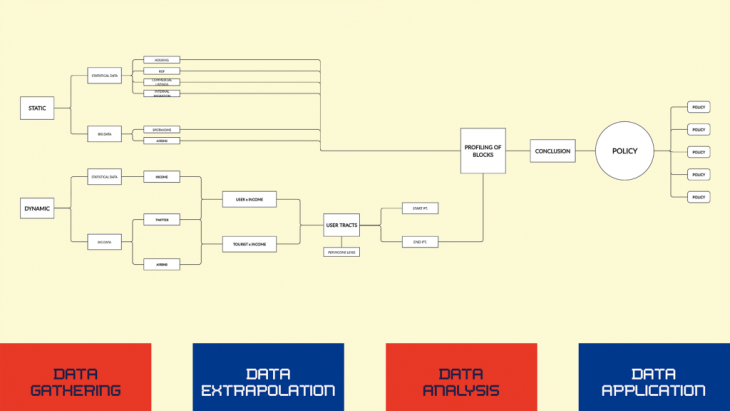
The methodology is divided into two main parts: static approach and dynamic approach. Each process has its own set of data as these will be the foundation of our analysis. In the end, these two approaches will be compared and will be used in creating policies.
Static Approach
The first approach to measure segregation within cities is to take the more traditional profiling approach, where a segregation index is calculated for a certain space within the city.
This method is typically driven by the data available within that space. Luckily in Barcelona and through Open Data BCN and Censal data sets, there is a bunch of data available to the public’s disposal for both neighborhoods (barrios) and sections (secciones) which we combined with our Airbnb and big data sets (Spotahome).
The first step is to brainstorm any factor that would lead to a segregated neighborhood. We listed out all of these factors from A to Z and then selected the metrics that by itself could tell a story about segregation. We landed on several metrics and realized that they imply segregation at either a spatial level, or a social variability level.
The metrics were the following:
- Social Density (Spatial Segregation): Airbnb Density, Commercial Density, Population Density, and Residential Area Density
- Social Variability (Class/Demographic Segregation): Class Variability (metric created to measure a space’s variability in income, unemployment rate, index RDF, cost of rent), Airbnb Price Variability, Spotahome Price Variability, and Immigration Rate
Each of these categories have 4 separate metrics each (8 in total), of which we created a score 1-5 for each by segmenting their standard deviations within their respective subset.
Once we had the scores for each metric, we could average them together to develop an overall segregation score.
This method was done for all 70+ neighborhoods and 1030+ sections which created the ability to catalog all of their segregation scores.
According to our index and methodology, the most segregated neighborhood would be Canyelles with a segregation score of 4 and the least segregated neighborhood is Raval.
Dynamic Approach
Like any other cities, Barcelona is constantly growing and becoming more dynamic. At the same time, its people get more dynamic both in the physical dimension and the digital dimension.
Thus, when understanding urban segregation, one should not limit it to the static conditions of the city. Dynamic factors such as paths each individual makes should also be considered. A dynamic approach is needed.

With the aid of big data, the goal of this approach is to give more focus on the people and their dynamics in understanding urban planning. For this case, urban segregation, coupled with static indicators. It will include time as a new added layer in relation to space as it gives us an insight to when the movement of each individual happened in a physical space.
Given the limited access to other data sets, our group maximized the potential use of Twitter data. Since it is known for its tweets, we are able to trace movement of a person across the city from the first tweet to the next tweet and up to the latest tweet.

This is not the most precise method to track movement. With these set of points, however, we could know where the user tweets and identify its typical location, and what could be the potential reason why this user is there.
Time period of the data set is from November, 2017 until January, 2020 with a total of 476,777 geolocated tweets. As a result, it leads to some certain limitations and biases. This show that using Twitter data excludes a big chunk of the population from the analysis. It includes a small representation of the population in terms of numbers and age.
Nevertheless, this is a good starting point in developing the approach and understanding how people respond and move across the physical fabric of the city alongside influential factors that affect their movements.
The Engine
Our goal is to understand how mobility and human interaction affect social integration. For that we start with analyzing the dynamics of socio-economic segregation.
This is done using a computational framework based on coupling large-scale information such as twitter with people’s socio-economic status.
</p>
The framework can be used to depict segregation dynamics down to the individual level and provide aggregate measurements at the scale of places and cities, and their evolution over time.
</p>
The output is a time-resolved analysis that reveals the changing landscape of urban segregation and the time-varying roles of places. This can be aggregated into any scale; the districts, neighborhoods or the section.
The Policy
How can then BIG DATA and STATISTICAL DATA inform better policy decisions in Barcelona?
Given the current PAM (Municipal Action Programme 2020-2023), we have highlighted some of the Government objectives such as:
- Use AI and Big Data as an engine of a more proactive administration that offers more personalized services in accordance to citizen needs.
- Defend the right to housing
- Boost legislative rules in the state and autonomic to put an end to abusive rent and speculation against housing
- Keep working to generate opportunities to the neighbourhoods of the city defining new plans of integral interventions on the neighbourhoods that have not been part of the Pla de Barris programme yet.
- Keep track the impact of interventions on the most vulnerable neighbourhoods, being these a continuous and changing back and forth approach
How can Big Data can support these Government Goals?
The proposed will consider:
- To ensure the best operations of sharing economy platforms and fighting against inequalities in the city, these will provide data to the city council. This will ensure:
- Monitoring performance and illegal economic activities to ensure the correct functioning of activities.
- Inform on a daily basis about the listings and identifying potential inequalities and city irregular phenomenons.
- Telephone companies will reveal anonymous (but profiled) data to support the previous and help to fight against socio-economic segregation in the city.
“It is found that behavioural indicators extracted from mobile-phone usage can accurately predict an individual’s socioeconomic status. Other urban datasets, such as census and residential property price, also contain valuable information about urban residents”
– Conquer the Divided Cities by Yang Xu and Carlo Ratti
In addition, this method has been seen recently in recent newspapers with the use of tracking phone data to fight against Coronavirus. There must be a shift on the way we look at the city, to be ready for rapid and dynamic shifts to confront uncertainties like the one we are in now.
Further ideas:
- What if we could reprogram areas of the city depending on the use and the profile of the people that uses those spaces?
- What if we could cluster time and areas to inform flexible decisions of the city?
- How individual and collective data would be managed in this?
- Can we differentiate between physical and digital segregation?
urban SEGREGATION: a dynamic approach for Barcelona is a project of IaaC, Institute for Advanced Architecture of Catalonia
developed at Master in City & Technology in (2019/2020) by:
Students: Alejandro Quinto Ferrández, Jianne Libunao, Andrew Saltzman, Kushal Saraiya
Faculty: Luis Falcon