URBAN LIFE TACTICS
Historically, great cities of the world have been determined by geographic location, demographic diversity, infrastructural quality, industrial innovation, vibrant culture, and global connectivity. A few of this settlements have grown to what is now known as mega-cities, which host in some cases populations the size of what a continent used to host a few centuries back. In emergent cities the increase have been carried out in a matter of decades.
With the rapid urbanisation and the large population numbers, then unknown systemic problems emerged: global warming, overpopulated streets, unplanned urbanisation, high inequality, excessive pollution, poor service access… Most of these so called mega-cities suffer from great stratification at all levels and essential service access disparities, where key benefits of urban life are kept among a few. The extent to which all of a city’s population shares technological progress and its material benefits becomes an important benchmark for comparing cities and a way to learn from each other.
Most of the coming global challenges have to deal with cities, the way we benefit from their infrastructure, how we live in them and the types of relationships that we build as societies.
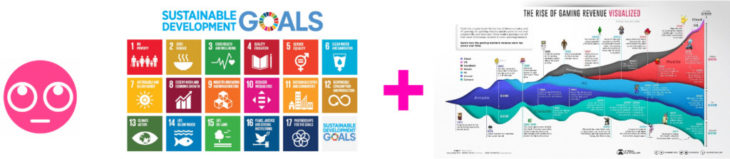
In recent years a great part of the blame for urban decay is put on mainstream technologies. However, its widespread use is also an opportunity. Studies have shown that playing video games encourages critical thinking, improves motor skills and promotes key social skills like leadership and team building. They are also effective tools for teaching educational skills as gaming helps to deepen learning and understanding.

We believe that using video games could help rising awareness about cities and how to have a healthy urban live, aligning to the UN 2030 Agenda.
Harnessing the power of technology for educating in urban sustainability and inclusiveness is what we have called URBAN LIFE TACTICS.
ULT is an educative game for future generations of urban dwellers. It raises awareness on the importance of urban decisions by letting the players input what they believe would make a better city and outputting a future stage of the cities development.
Since the emergence of computation, there have been many attempts to depict complex behavior. During its first decades of life, when it was a rather experimental field, scientist tried coding algorithms that would generate complex systems that followed a handful of simple rules. However their modest complexity demanded hardware that was not available at the time.

With the widespread of the industry and a few technical improvements such as the keyboard and the display, a bunch of misfits started developing scripts that would allow them to interact with the machine, giving birth to what we know now as the game industry. The basic principle of any computer game was to control an agent that needed to profitiently interact with its environment in order to win and continue playing.
During the coming decades, the experimental and math-bound field developed in parallel to the more user centered games. This came to an end firstly with the appearance of arcade games that hugely increased the interest in computer games and human-machine interaction and secondly, and more definitely, with the appearance of the personal computer. The democratization of computers, even though it meant a huge leap forward for the whole industry, it also shifted the interest towards using them as tools meant to do tasks one could fully control instead of letting them be part of a creation/generation process. Since then, the game industry has been key for the development of the field and breakthroughs initially meant for it are now key in important research fields, like the GPU is for AI.
With the current hardware development, most of the initial issues are solved, and thanks to the data rich time we live in, multiple areas of computation have greatly developed in a matter of years. However, for fields like architecture and urbanism, it is not that easy to benefit from today’s information abundance. Computers help in production and analysis tasks, but finding clean architectural data is difficult, generating it is costly and the amount of factors that come at play makes it a rather complex topic. To all this, we must add the cultural aspect of the field and the bias the architect or urban planner might unintentionally induce in the dataset while creating it.
Most of the coming challenges humanity faces in the coming decades have to do with the way we live and the settlements we design. Coding tools that accurately predict urban life is a growing topic, yet their complexity makes them difficult to grasp even for designers. However, educating in the importance of one’s actions in the city as a whole is key to start building environments that will help us thrive.
In this thesis we explore the use of a simple cellular automata approach to depict urban life and how our actions impact urban quality. The final product is a web based tool that could help us understand the impact certain urban policies may have in urban life. If further developed, we believe it could help planners get a better idea of the functioning of the city and educate coming generations on the importance of urban life.
METHODOLOGY
The research could be divided in three stages: Data gathering, base values and rule design, and web deployment.

M.01 DATA GATHERING:
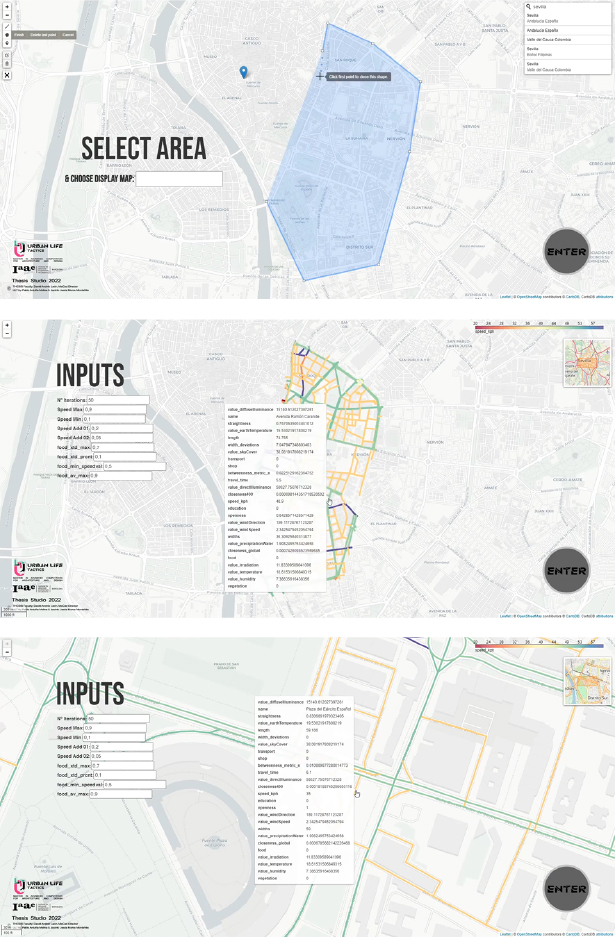
First of all we wanted to make a global game or platform, what do we mean by this? That users would be able to analyse, investigate and create in any area, be it city, town, desert or sea. This last one is a bit complicated as it has no streets but time to time.
The user will draw a polygon that covers the game-study area that interests him and then the map will be shown with the collected data that we will explain below.
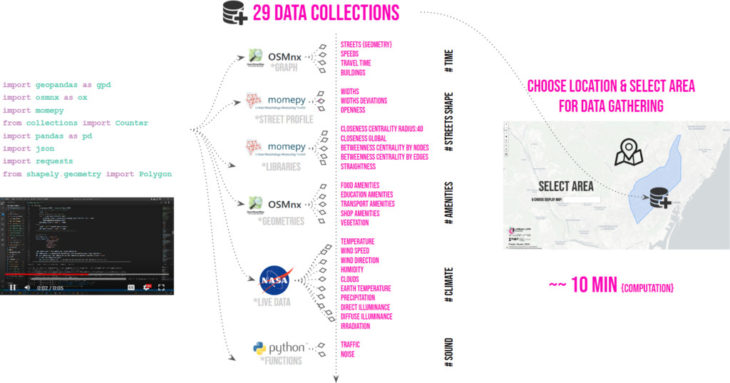
As it is global, we found it necessary to use the OSMNX, Momepy, POWER NASA data and algorithmic functions that will provide us with data for any place.
The OSMNX library is the basis of the project itself. From here we take the streets, the buildings, the amenities and the velocities of the streets. So we have geometry to work with and data associated by proximity to the streets. However, we didn’t want to stop there and we used momepy’s functions to extract spatial data from our streets to better understand the area. Being able to find out street widths, the proximity between them, the importance of each of them in terms of travel, traffic and noise. Last but not least, the climatic aspects such as temperature, wind, humidity, shade, illuminance and radiation. These data are taken from NASA POWER in real time.
M.02 BASE VALUES DESIGN:
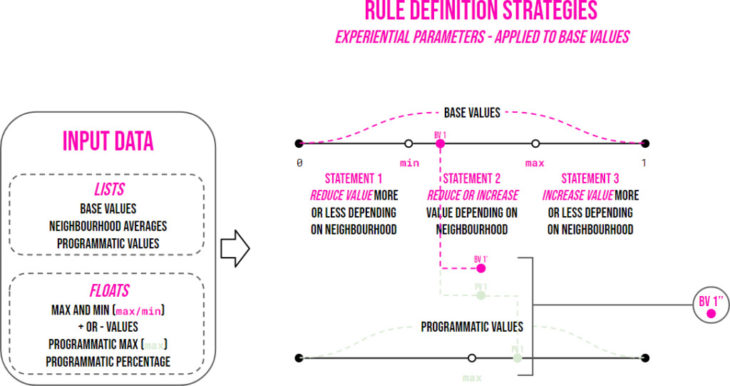
All the previously gathered data can be divided in static and dynamic parameters depending on how quickly they change. The former ones relate with the more physical and infrastructural aspects of the city, while the latter relate to human behaviour. Within this last category they are divided in programmatic, related to economic activities, and experiential, linked to urban experience.
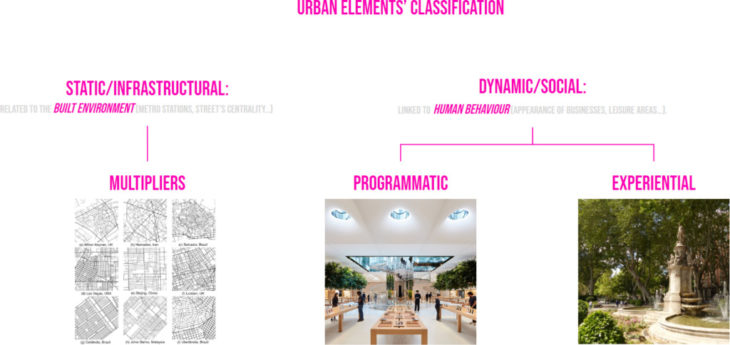
To curate what we called base values, over which the rules iterate, static and experiential parameters are combined. Static ones are understood as multipliers whose static value always affect the street grading in the same way. Experiential parameters change with each iteration. For both categories, the player can choose to what extent they affect the combined value.
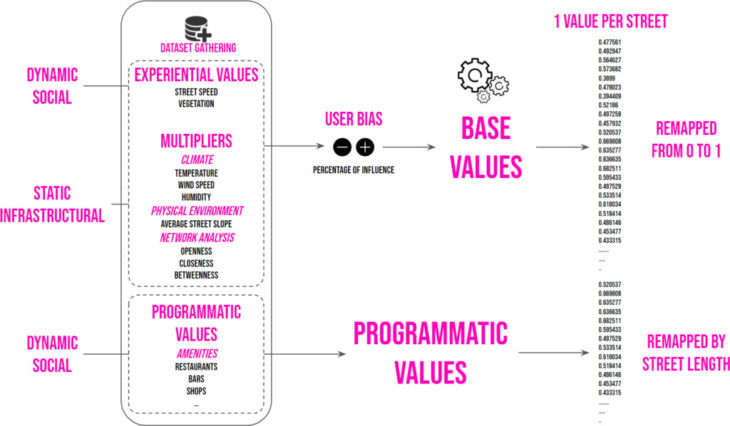
Programmatic parameters do not affect the base values directly. However, their value ends up affecting the experiential values, hence they have an indirect effect.
M.03 RULES DESIGN:
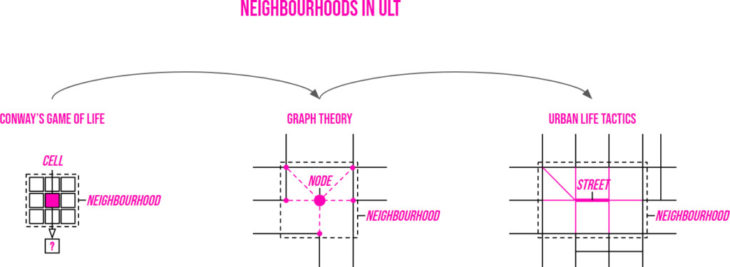
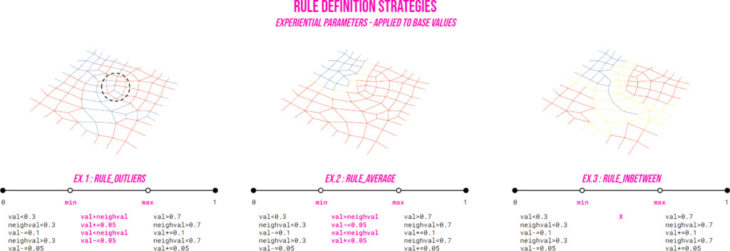
The logic behind the game is based on Conway’s Game of Life. So the rules are basically if-else statements applied in each iteration to the values from the previous iteration. Conway’s neighbourhood concept is reinterpreted from surrounding pixels to streets that share an endpoint.
Rules can be divided in two depending on if they affect programmatic or experiential parameters:
01.Experiential parameters’ rules take two types of data: lists and floats. The lists are the base values one over which they iterate, the list of neighborhood averages, and the list of programmatic values that affect the final values on each iteration. The floats, on the other side, are the maximum and minimum values – from 0 to 1 – that split the domain and set, depending on which domain a given base value is included in, which if statements apply. Two values that are added or subtracted depending on the statements fulfilled. A maximum value for the programmatic list that sets the threshold over which a percentage of the final value is added or deducted, which is the last float.
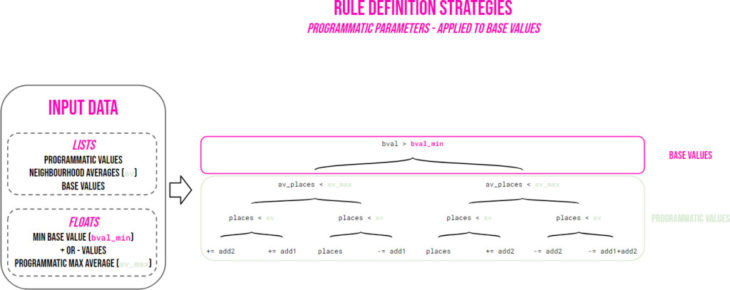
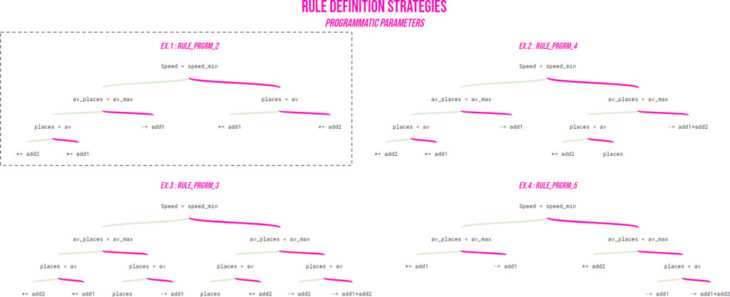
02. The programmatic parameters’ rules work similarly and take lists and floats. The lists correspond to the programmatic and base values of each street and the neighborhood average programmatic value. The floats are the base value limit that defines which statements apply, the two values that are added or deducted depending on the statements fulfilled, and a neighborhood average maximum to punish concentration.
The rule design was carried out mainly in Grasshopper. At the beginning of the research the scripts were done using native components for adjusting the weights and the Anemone plugin for the display of the weights through the iterative process. Even though this method displayed a visible result for each iteration, achieving interaction between values was cumbersome and urban life tend to get stuck after a few iteration. To avoid this, the best way to keep developing the rules was by using Python code for the iterative process. 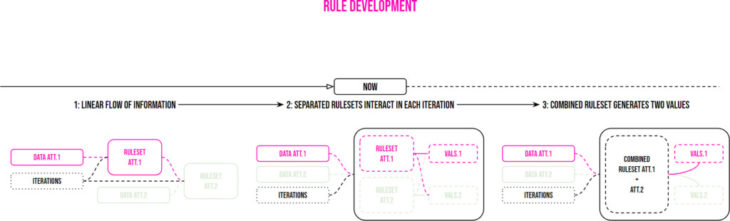
Finally, all the rules were scripted in Python to reduce computing time in Grasshopper and Rhino.compute first, and to achieve better performance with the final website deployment in the end.1

M.04 WEB DEPLOYMENT:
So the big question… How do we get users to be able to use it?
This was a big headache for us, as every step we took in the project led us down a different path. We started the workflow of getting the data out of Google colab and transferring it to rhino via hops. Then with rhinocompute we implemented the maps created in rhino. It was not a lot of work but the high computational effort and the few known resources for the style led us to decide another way. The path we finally took was to use Flask. A Python library that gave us the possibility to do everything in the same platform and to be able to implement it later in heroku. Here the effort was to transcribe everything done in grasshopper into Python language.
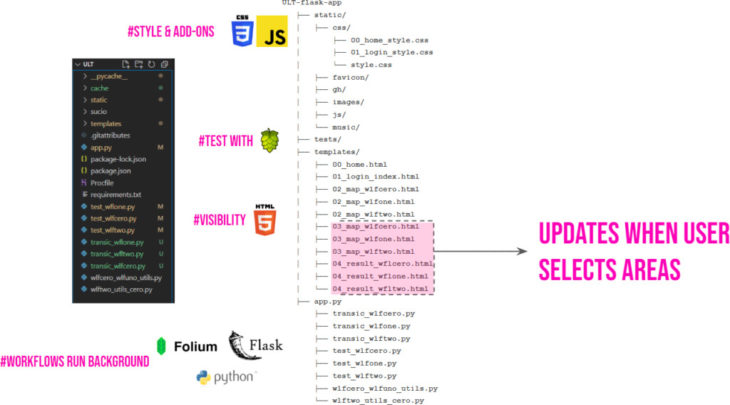
The structure is relatively simple, it could be divided in 3 parts: a static one where we host the images used, the music, the css styles and the javascript that we use punctually for some action, the second part will be the templates where the htmls are hosted. Third and last would be our main Python file that will carry out all the functions created for the game, linked to other Python files to call external functions. Inside our main app.py we find implemented Flask that collects and creates the inputs in the htmls and displays the information executed in our Python functions. For a better territorial and city visualisation we used Folium map, which gives us the possibility to use geocoders, legends to visualise different maps and to see the evolution of our automata cell along each iteration.
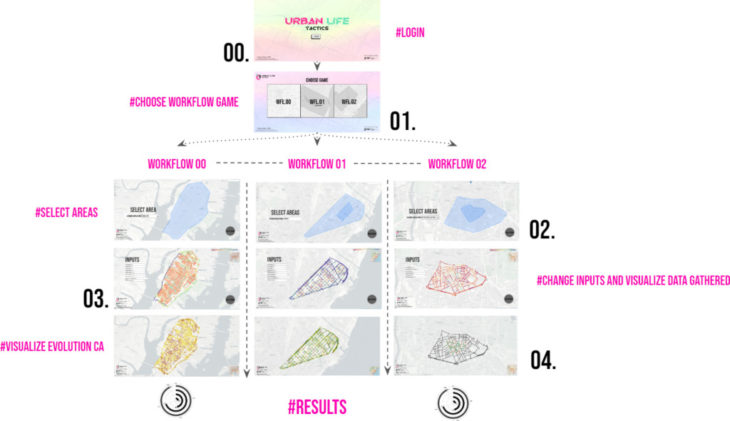
The website consists therefore of a home page where the user clicks and is taken to the next page where he/she can choose what kind of game or workflow he/she wants to play. Then the area with his data will appear and he will have the possibility to change the values to finally know the effects that his actions will have on the city.
WORKFLOWS
This research uses graph theory and network analysis applied on urban grids. A graph is a way to represent information and it is composed of nodes and edges where nodes are generally understood as the key part of the network, holding most of the information, and the edges are the means to get to them and the information they hold is related to how useful and quick they are to move around graphs. Applied to the urban fabric, edges represent streets and nodes are the crossings between them.
For this research we understand streets as the basic element for urban life and the usual paradigm of graph theory shifts, giving streets the main role and the most information and using nodes just as connectors.
For this thesis, urban information was divided in to groups:
– Geometrical information: street layout.
– Quantitative information: numerical data extracted from different sources (explained in the Methods chapter).
Three different workflows that differ on the amount of urban information available were tested:
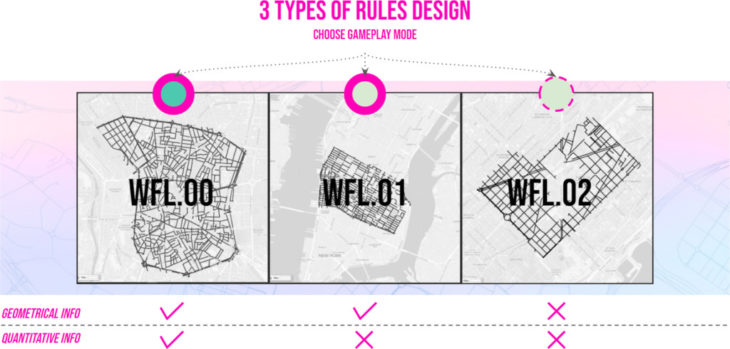
– Workflow 0 (WF0): The goal was to depict the evolution of urban life with all the previously explained urban information gathered.
</p>
– Workflow 1 (WF1): For the second workflow, the quantitative information is reduced simulating the intrusion of urban life in a newly developed street layout or an informal settlement from which little information is available. At the beginning information was completely removed from the streets, however, with the previously explained rules the newly created settlement got stuck in zero values. The way to make this work is either by giving a different random value to all streets, or by giving them the same value over a certain threshold – a higher value does not mean a higher average end result -, or by adding a value to the streets related to a physical aspect of the network.
</p>
– Workflow 2 (WF2): The third workflow has both types of information removed and it simulates a void inside an urban fabric that is to be filled. It is divided in two parts: the generation of the new street layout following certain parameters, and then the intrusion of urban life as done in WF1.
</p>
FUTURE STEPS
Tests were carried out in different cities and towns, as expected, bigger settlements have more available data, and the game becomes more plausible.
As we developed the application, we saw the countless advantages and developments that already exist in the web-urban sector. We think it is feasible that free public platforms that offer the user a great range of possibilities will arrive, although for now most of them are private.
For now, as we do not fully understand the implications of the logic behind the rules scripted, many of the value correlations seem far from our understanding. The idea of making it an open tool allows for users to improve it and tweak it for their needs.
The initial development of the rules shows promising correlations. However, to make ULT more accurate in its depictions, rules would need to be fine-tuned and, depending on the cultural background of the city it is being implemented into, some aspects should be tweaked.
Depending on the parameters considered for curating the initial base values to iterate from, the results vary greatly. In further developments and with a greater dataset, the users could select what parameters conform them. This way they could see the different results depending on what they take into consideration.
Google Colab has been a great support for us to test the scripts, we realised that thanks to the cache the scripts were faster but using platforms that reinitiate you from the beginning can be a disadvantage.
Besides being an educational tool, ULT has the potential to become a credible urban life simulator for videogames that following a series of simple rules and slightly modifying certain values can generate a unique game experience for every user.
As the base for the rule’s development was Grasshopper for easy visualization purposes and familiarity, we were bound to GhPython that lacks most of the sophisticated libraries. Implementing Python libs like Numpy and Pandas would improve performance and allow a better control of results through iterations.
Urban Life Tactics is a project of IAAC, Institute for Advanced Architecture of Catalonia developed in the Master of Advanced Computation in Architecture and Design 2021/22
Students: Pablo Antuña & Jacinto Moros
Thesis Advisor : David Andres Leon