URBAN ARTEFACTS
FILLING THE VOIDS
THE PROBLEM: Underutilized and overutilized public space
The project Urban Artefacts that takes place in the city of Vienna. Our project presents itself as a response to a very simple question. How can we make better use of our public pedestrian space and improve the quality of the outdoors in Vienna by finding and filling these voids with the necessary and required amenities?

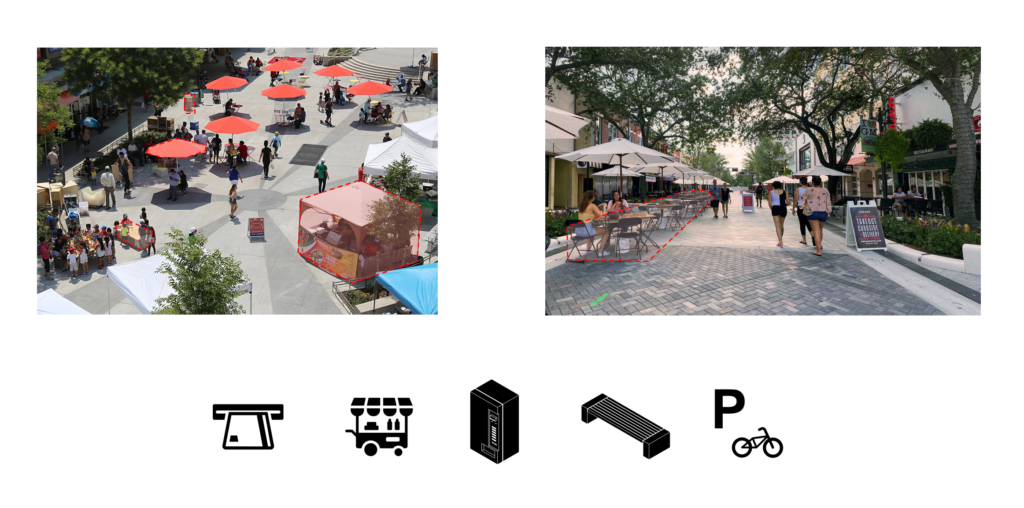
THE SOLUTION: Augmenting and Optimizing public spaces
Our proposed solution will be to augment and optimize the streets by planting the necessary amenities where required; A bench, a vending machine, bicycle parking and so on. All of these will be calculated depending on the existent conditions, then acted upon for optimisation.
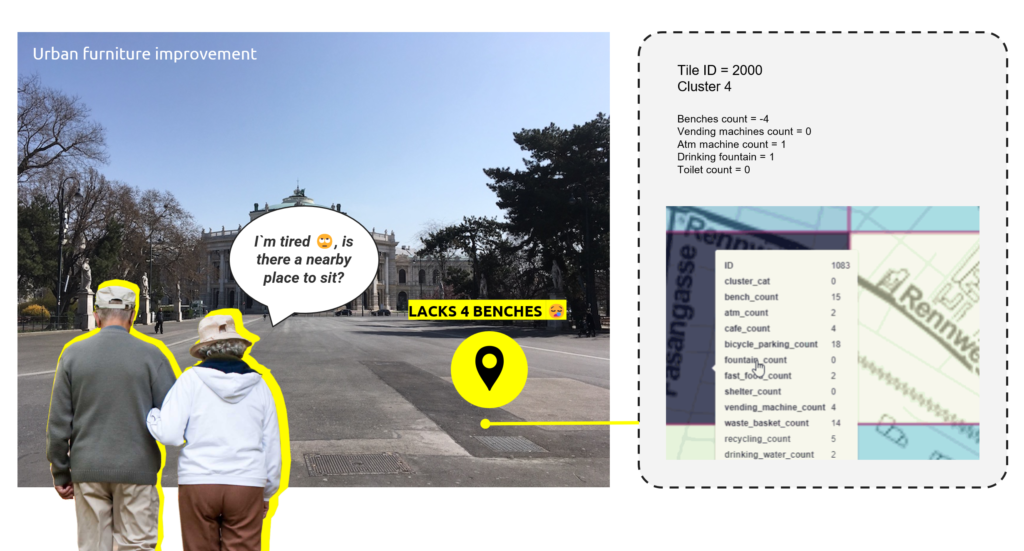
THE USER STORY
Let’s set the case of an old couple looking for a bench in an underutilized urban zone. Of course, there is a potential for a bettering here. Our project allows a systematic approach to understanding the amount of necessary amenities in public spaces and help in the management of these assets.
THE METHODOLOGY: Data and AI
Two sources and four categories of data were used for the project.
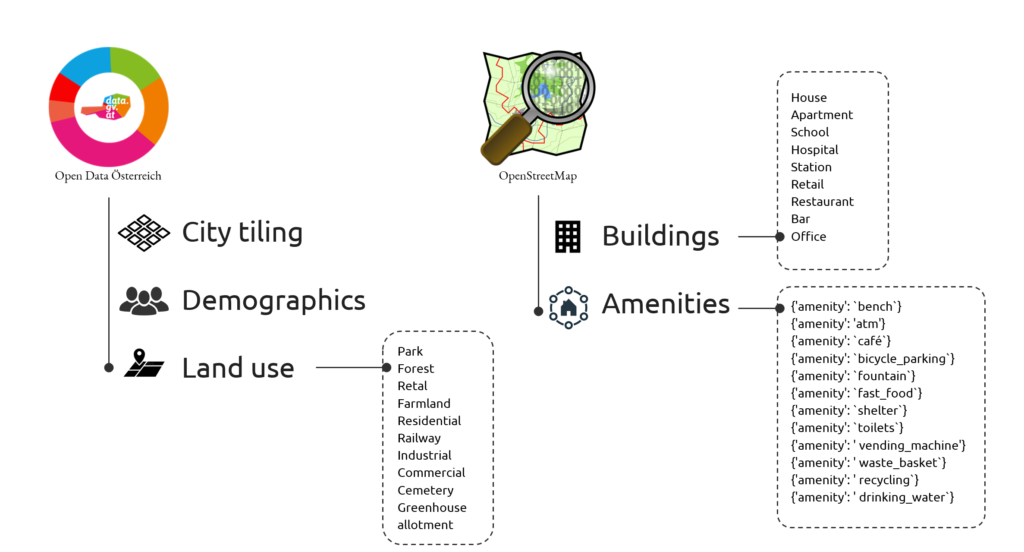
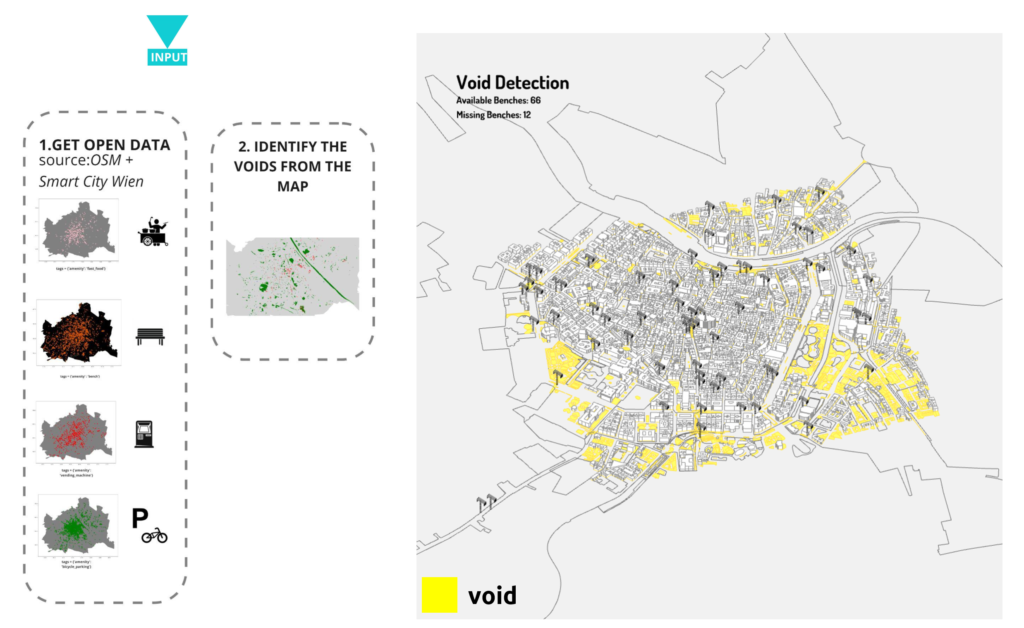
1. OPEN SOURCE DATA COLLECTION
Data about the city can be gathered from open sources such as Open Street Maps and government websites like in the case of this project. Data could further be collected about amenities for example through manual collection or through image segmentation of street images to collect counts of certain amenities.
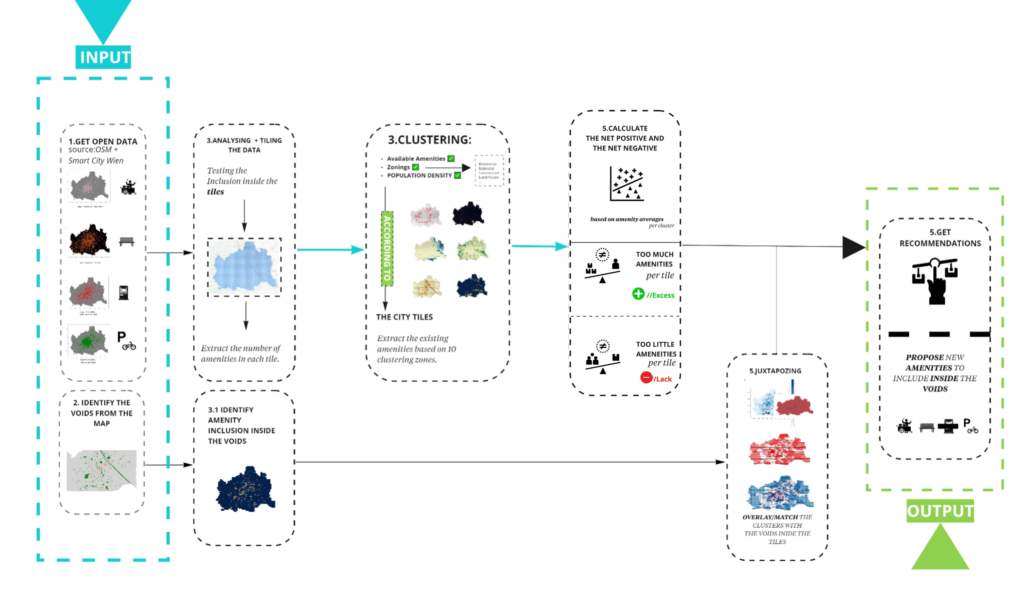
2. VOID IDENTIFICATION
Pedestrian voids are identified across the city through open street maps which are often ignored or not evaluated in urban planning due to the small scale.
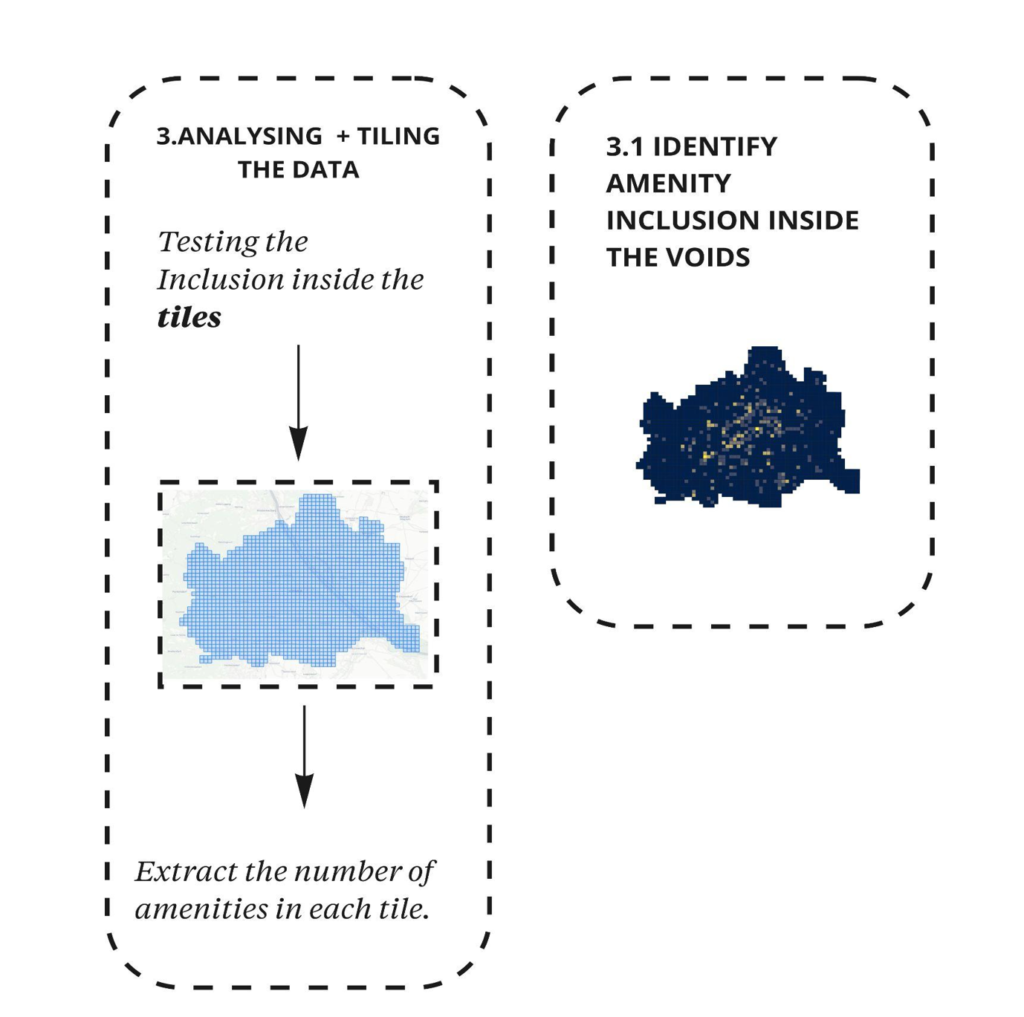
3. AMENITY LOCATING AND TILING
with the selected amenities counted across the city, we then grouped them according to which grid tile they were located in within Vienna. This same method was undertaken with the voids. The result gave a clear evaluation of what the current distributions are in Vienna.
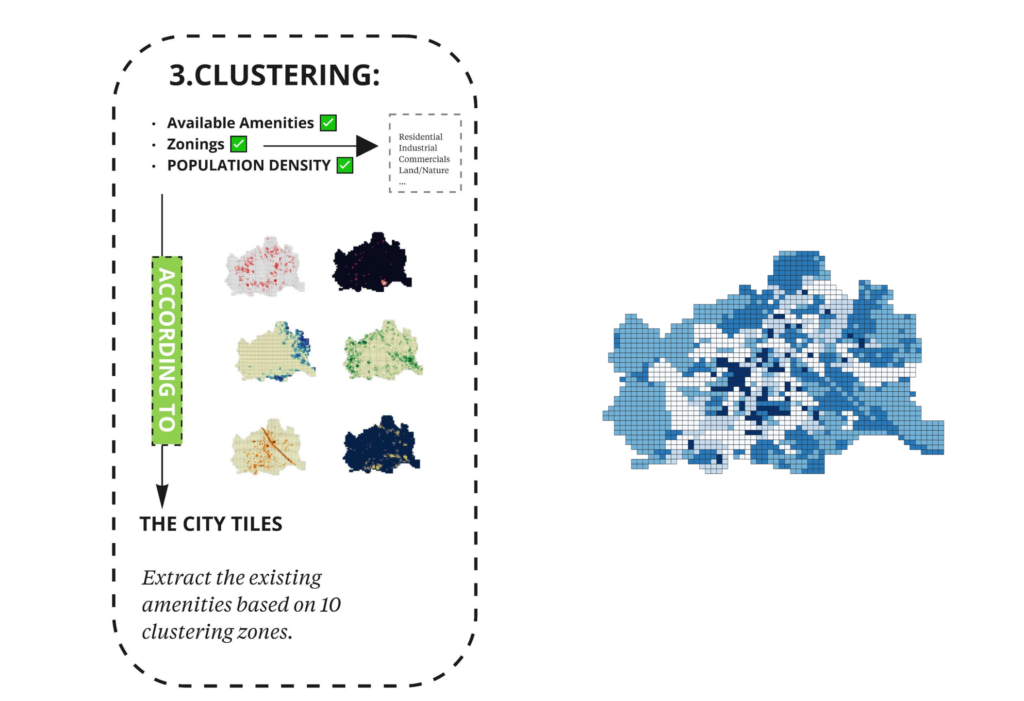
4. K-MEANS AMENITY CLUSTERING
The next step involved the use of AI to determine select zones across Vienna which represented a certain characteristic of the city. Specifically we used the K-MEANS algorithm to to cluster the tiles based on population density, landuse and amenities. We chose these three categories as they would give a good description of the demographics and area. Through manual analysis of the K-MEANS clusters visually through charts and other evaluation methods such as the K-MEANS elbow graph we determined that 10 clusters would accurately describe the city zoning. The amenities could then be averaged based on which cluster they landed.
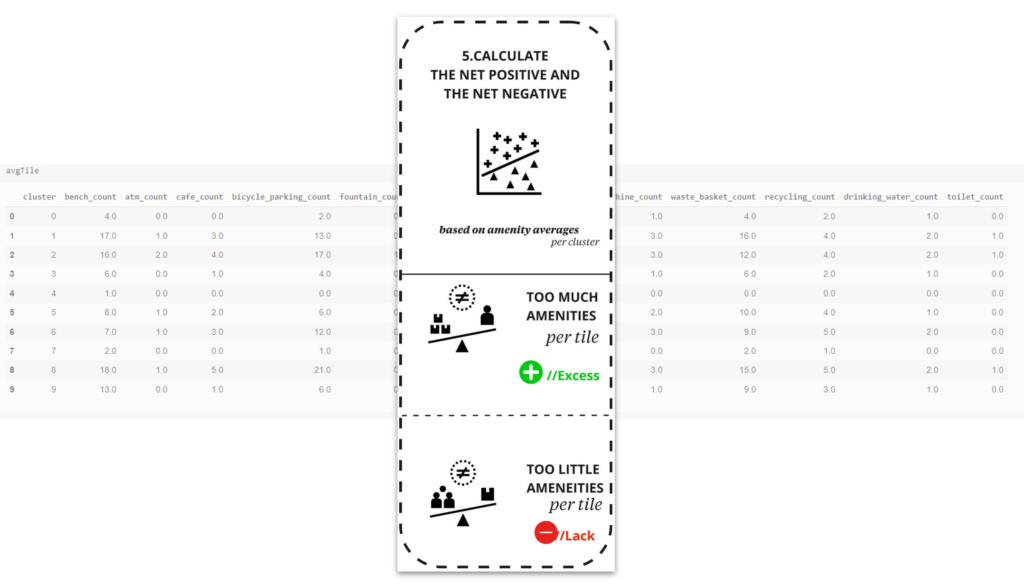
5. CALCULATION
Now with all the data frames created, we could make basic calculations to determine the distribution of amenities in the city. By taking the average count for all of the tiles within the created clusters ( as shown in the dataframe here which are 10 groups) and deducting them from the currently existing amenity tile count depending on which cluster they are located, we are presented with a number showing how far from the cluster average the current count is. This number does not give an absolute truth but more of an indication of what the amenity situation is within each select tile. These numbers could be further augmented in the future though district policies such as targets in certain areas to increase recycling.
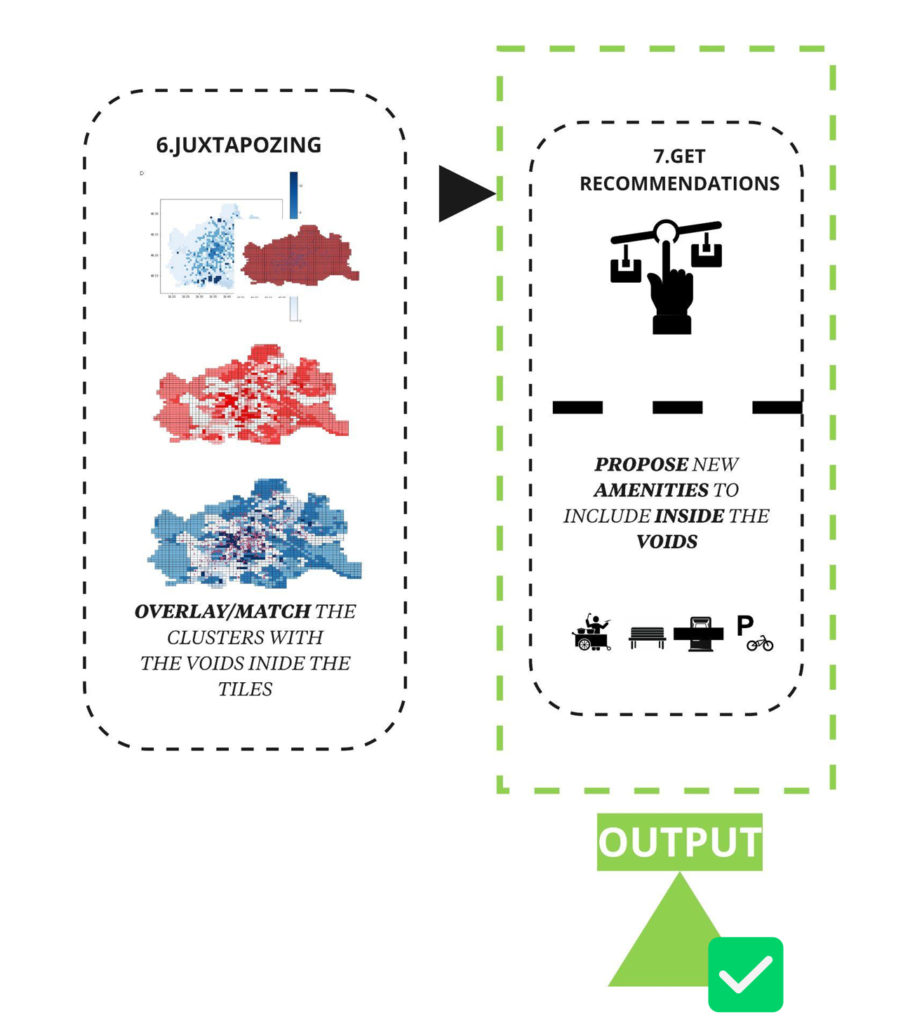
6+7. VOID MATCHING AND RECOMMENDATIONS
The final step then involves overlaying the voids collected from the early stages with the tiles holding the new recommendation values. If the void intersects with the tile, then the amenity differences are shown within that void. Through this method each void will receive a list of numbers for each of the amenities.
7. THE RESULT
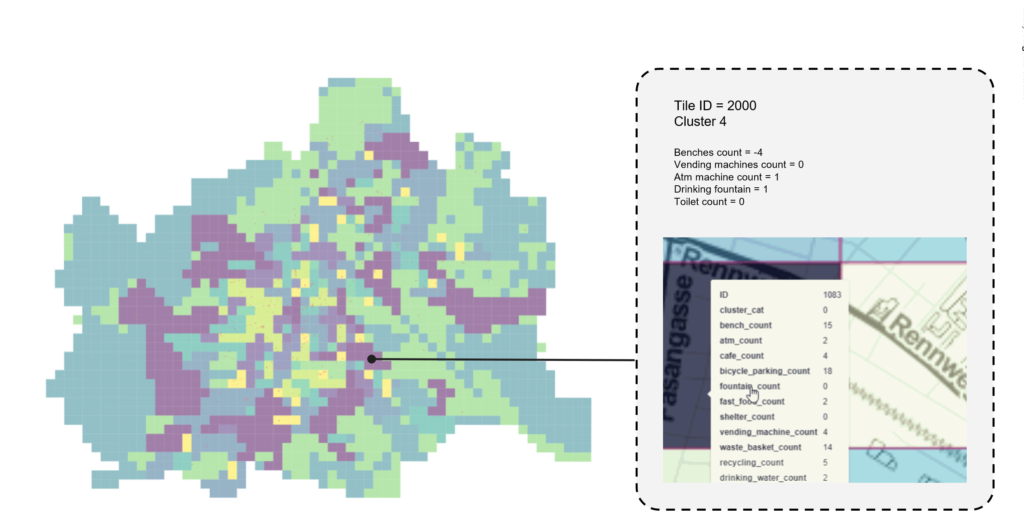
The final result is the representation of amenity clusters by tile through a coloured heat map., Each tile is clustered by different static layers which is categorized by amenity density as metrics for our recommendations. The pop up recommendations show the tile id, which cluster the tile belongs and the amenity features it current has.
Aside from the tiles we also overlaid on our map the polygon of the voids that we have identified and displayed a popup that show where the void is located in the tiles of vienna, which cluster it belongs to and a list of amenities if it is in excess or is lacking in those types of amenities
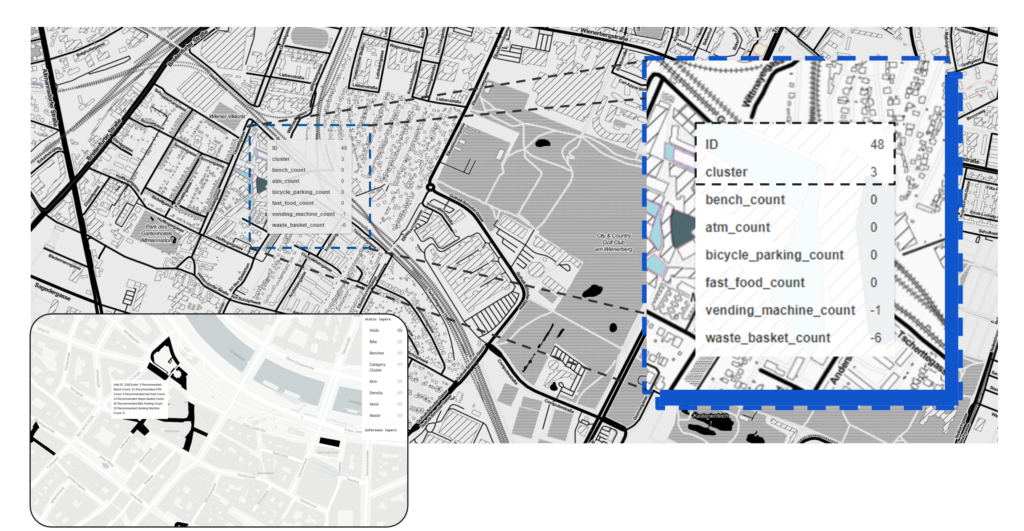
For our web interface you can see in light green on the dark layer its showing all the identified voids in vienna when hovered pops up different amenity features it has. This could be then laid over by another layer that shows a tiled heat map that show the density distribution of that particular amenity.
Users of the site could gain insight on the different possible lacking and excess amenities of each tile in vienna and for future steps for this project users could add amenities on the map and see metrics on how each tile would perform with that user intervention.

For the conclusions, we can note that the machine learning methods rely on good available data, the quality of the predicted recommendations will always rely on clean data. Also we noted that the data availability is mainly focused on the city center. So maybe gathering data of the outskirts is also needed in order to include the other neighbourhoods. For the third 3rd point: Civil society and communities could also help, they can give by themselves the input of recommendations needed – and for that we can imagine multiple frameworks that would welcome their input, maybe a website? Data refinement is of big issue also, for now AI technologies such as object detection can help along with the human input for a possible correction.
Urban Artefacts is a project of IAAC, Institute for Advanced Architecture of Catalonia developed in the Master of Advanced Computation in Architecture and Design 2021/22 by Students: Michal Gryko, Neil John Besrsabe, Mahmoud Ramdane and Olga Poletkina Faculty: Angelos Chronis, Faculty assistant: Aleksander Jastrzebska, Serjoscha Duering and Nariddh Khean