Uber defines a shift in mobility with an introduction of transportation as a technology platform. Unlike public transportation it is driven by the same values as service design platforms such as Airbnb regulated through customer service. In this regard, it is capable to be more flexible with the complex fabric that is urban mobility.
Before Uber, there were many ways to get a taxi. Either you had to call and request a pick-up ride at a specific time or you had to be lucky enough to live on a busy street where 2 to 3 taxis drive by every minute, or you had to be close to a taxi station.
Today with Uber, you can request a ride at any time and any place to get to the airport.In our project, we selected multiple areas around the city of Barcelona using boundingbox.com. we requested 100 points in each box and set the final destination to the airport in Llobregat area. We then proceeded to data mine over a period of two days at 4 different times of the day ( Sunday to Monday) using an Uber developer token.
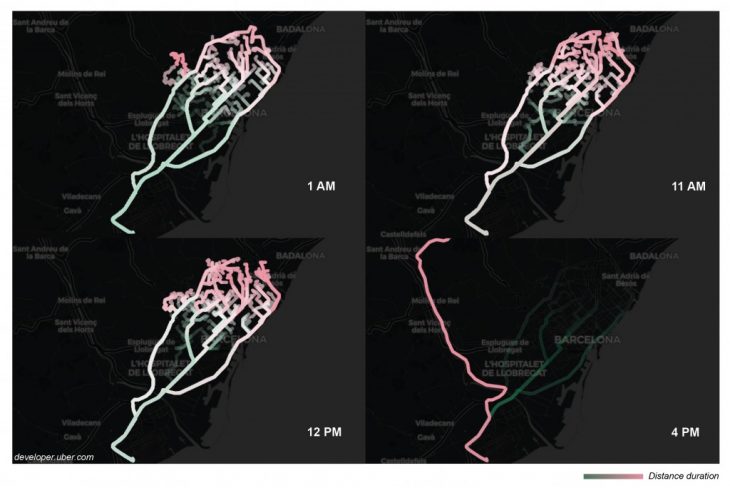
We used open route service to track the routes of uber drivers and to better visualize them on a map. We used seaborn in order to provide a high-level interface that was attractive and informative.
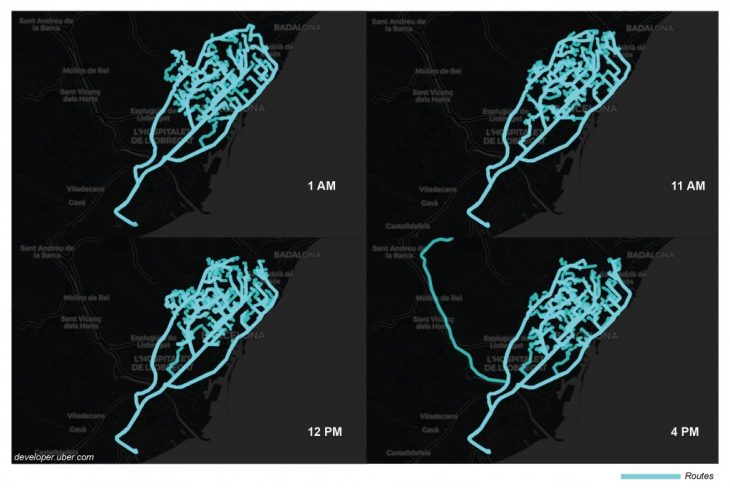
Using python, we ran codes to get routes from openrouteservice, read these routes, get uber rides and data visualize these rides, at different times in a day.
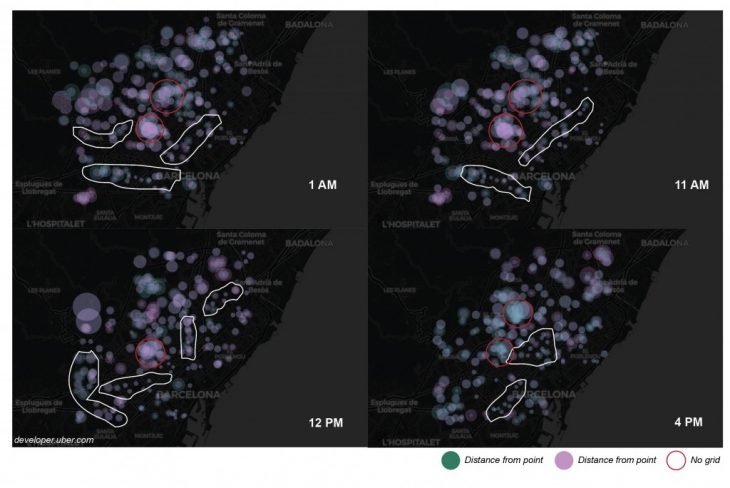
Realizing, that this was not enough information to make deductions, we decided to take a different approach.Because the data set from Uber is dynamic, it was important for us to create a buffer map by setting the coordinates request to 2 in order to create a loop allowing us to gather two data sets in one request: loop one in pink is the location of uber driver at minute x and loop green the location of the uber driver at minute y. The circles on this map are the estimated pick up times which is represented by a radius with 1 min = 100 meters. Represented with two colors, the circles on the map indicate the wait time until pick up. The pink circle being the pick up time at the time of inquiry of the data, and the green being the pick up time 4 minutes later.
 In order to better understand the average pick up time, we visualized this dataset in a series of histograms for each using python jupyter plug in.
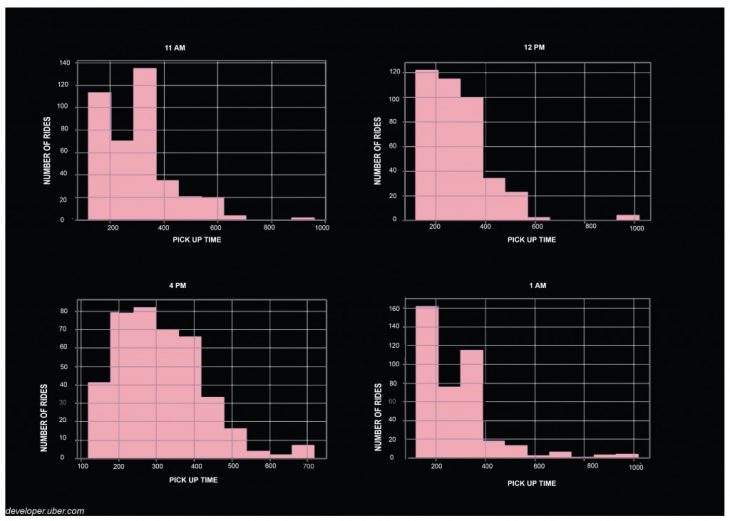
The average uber pick-up time is 6 to 7 minutes according to our survey.
After, analysing the clusters in the buffer map, we found certain pattern repetitions. Some zones seemed to consistently have a longer pick up time( (larger circles).
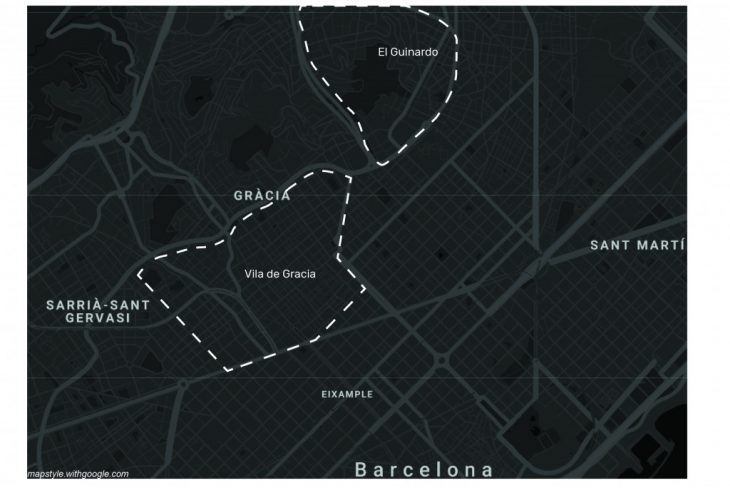
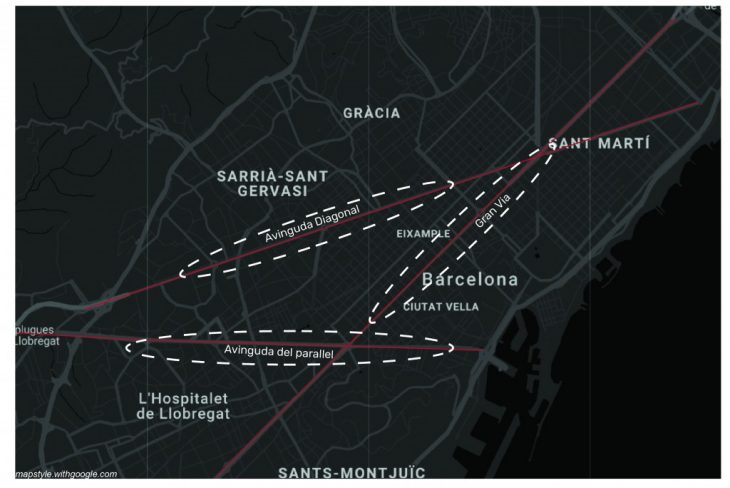
Upon, further analysis, we realized that these zones were areas without a city grid making trips longer. On the contrary, the clusters with the shortest pick up times (smaller circles) were located along major street axis: Avinguda del parallel, Avinguda Diagonal and Gran Via.
Sources
Openserviceroutes.com
Leaflet.js – an open-source JavaScript library
for mobile-friendly interactive maps
mapstyle.withgoogle.com
Seaborn.pydata.org
www.politico.com/states/new-york/city-hall/story/2014/10/uber-lyft-and-the-end-of-taxi-history-017042
developer.uber.com
boundingbox.com