TWITTER CITY
The following project aims to understand and map a city by twitter data.
Since social media has a lot of potential to provide us relevant data, is always important to process in has the best practices to use different tools to interpolate data and by doing this generate a cartographic evidence that could inform and document a screenshot of a city.
METHODOLOGY
This workflow consist in scraping data from 5 hashtags (peace, beer, oil, lucky and anxiety) in the middle of Boston with 5 km radius range. First we get the drive network to plot the main lanes of the city of Boston, to do this we convert this graph into a .geojson to finally import inside rhino. The same process was made for amenities data . Later one we parsed the geolocation data from every tweet to then generate a geometrical representation inside rhino/grasshopper.
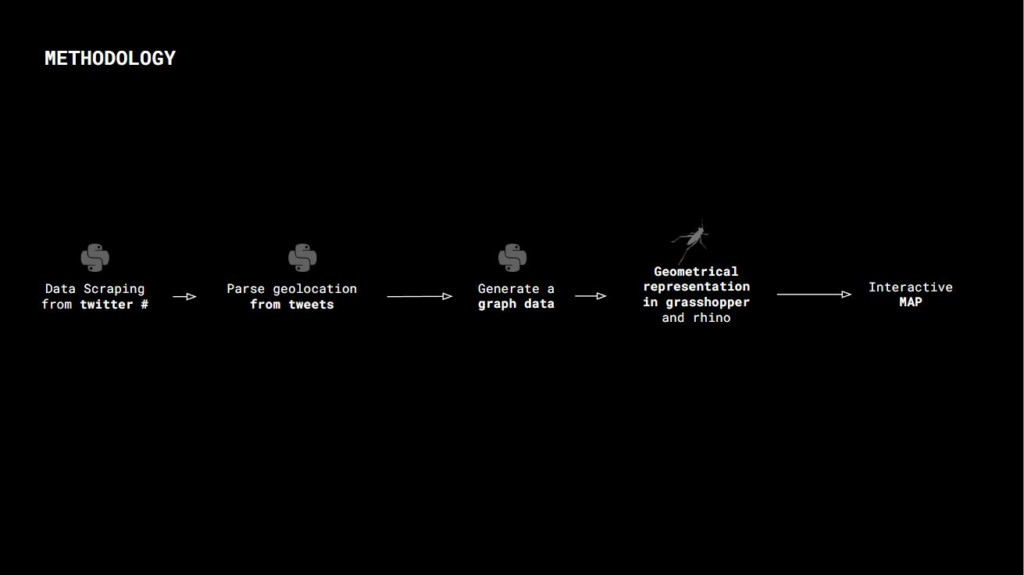 fig.01 workflow
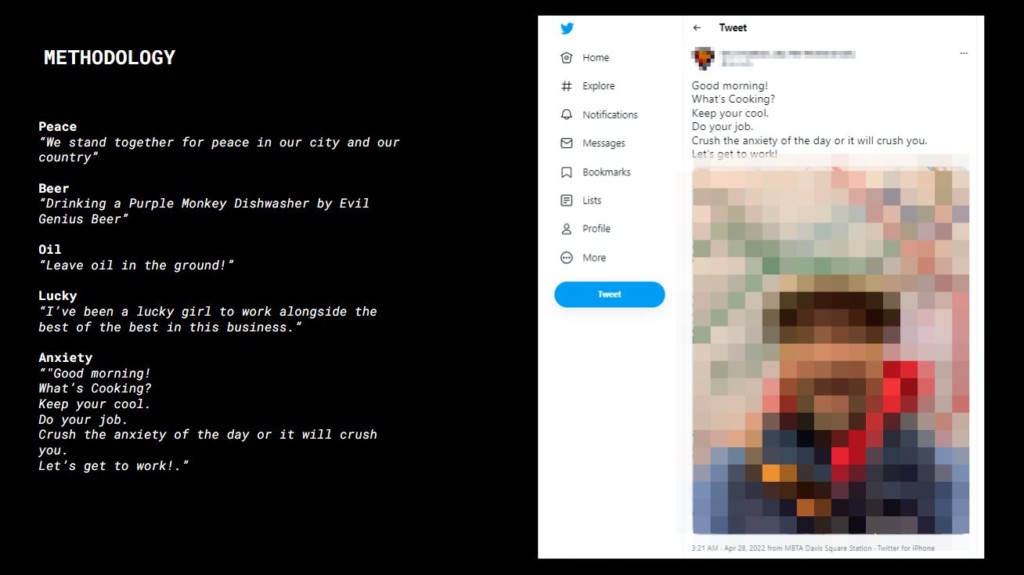 fig.02- tweets hashtags
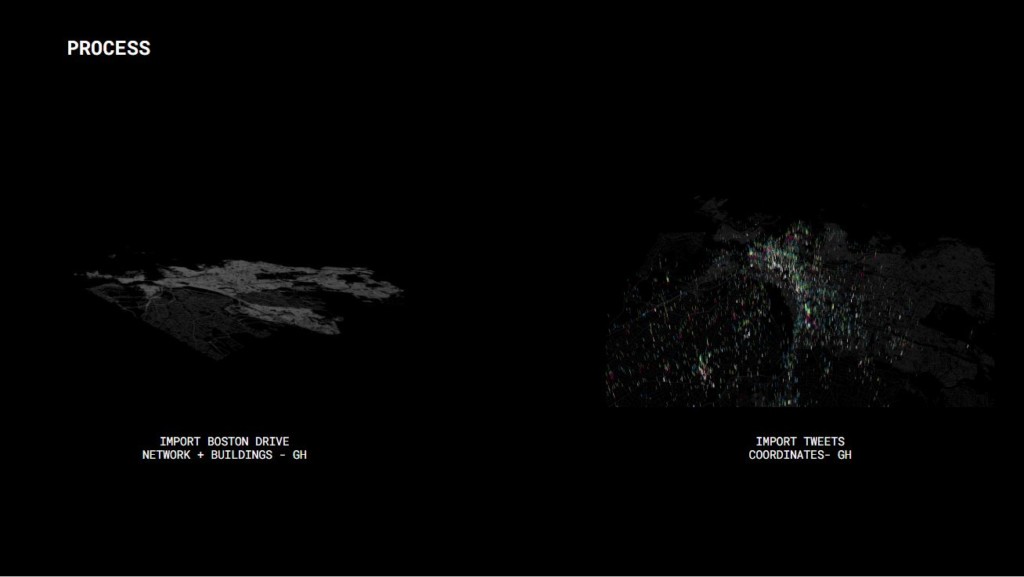 fig.03 – python to rhino (tweet visualization)
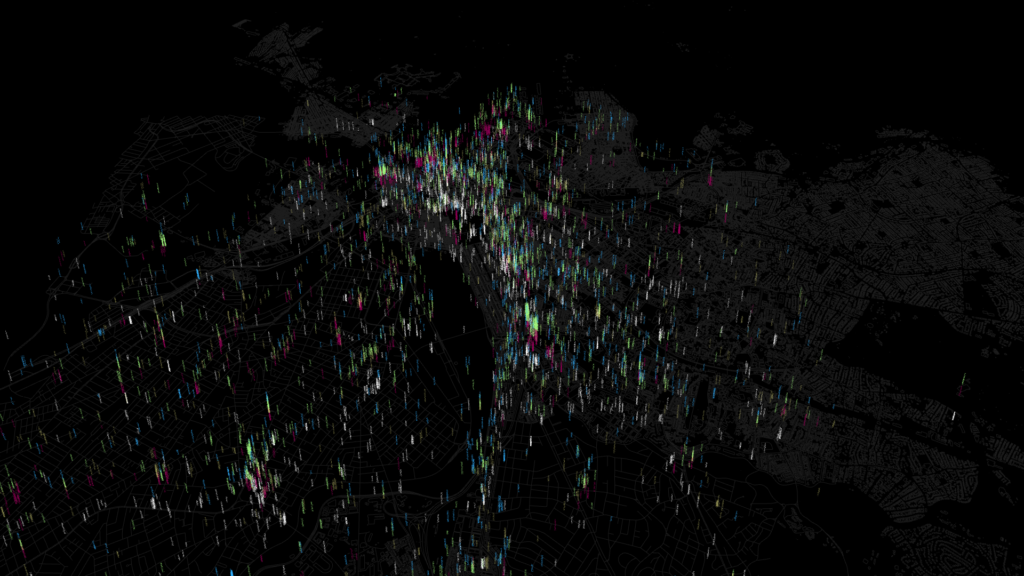 fig.04- tweets visualization
 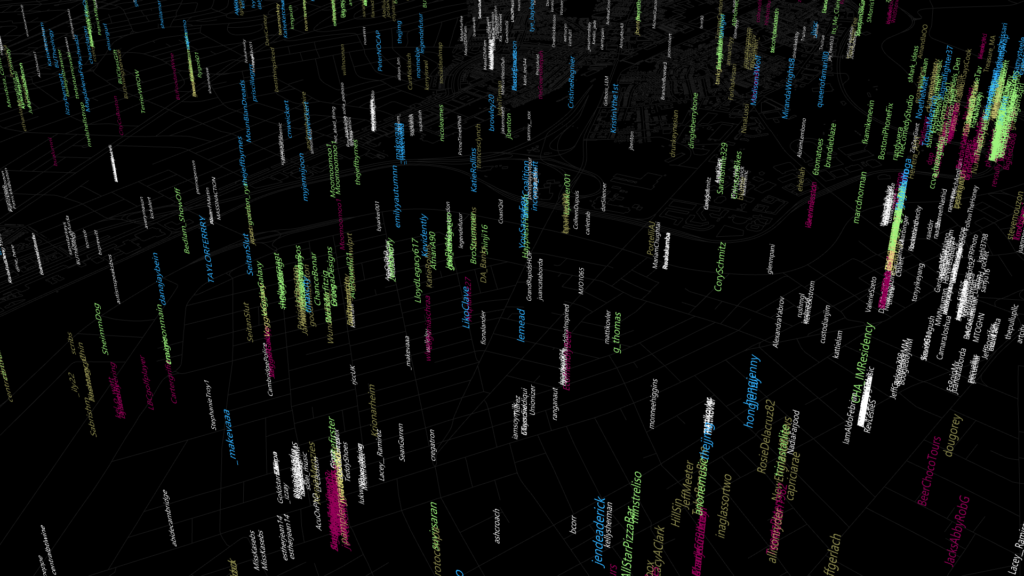 fig.05- tweets hashtags

fig.06- tweets walkthrough

fig.07- tweets walkthrough
GRAPHS
The intention of the following graphs is to cluster the interconnection between nodes by a group o 13 nodes. This process help us to build in early steps the density of each hashtag. Interactive Map:
Finally based on the coordinates from each tweet we found the nearest node from our street network to interconnect each tweet from each hashtag to simulate and agent running the shortest walk between all nearest nodes from the corresponding hashtag.
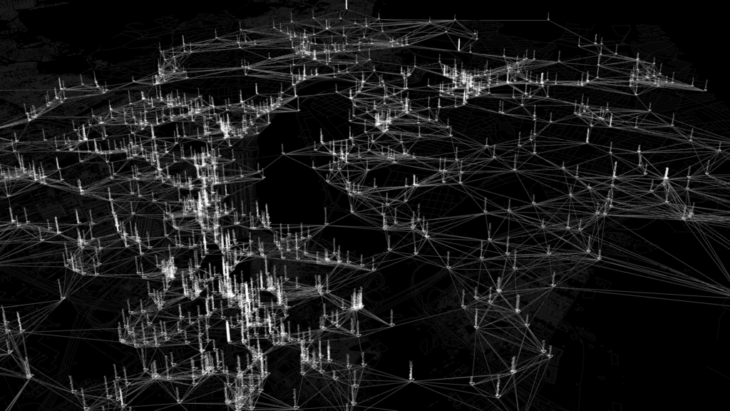 fig.08-peace graph
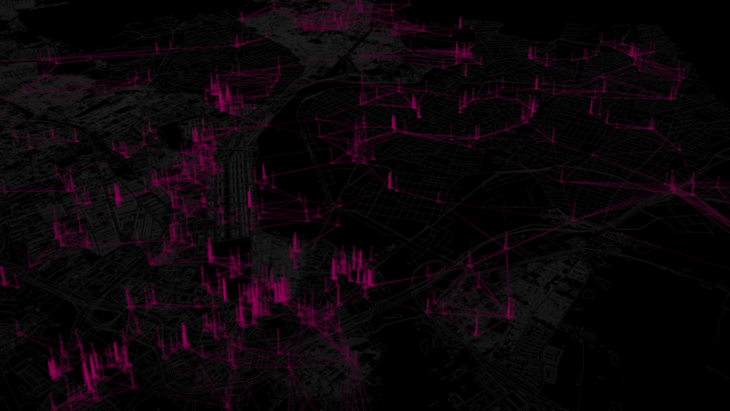 fig.09-beer graph
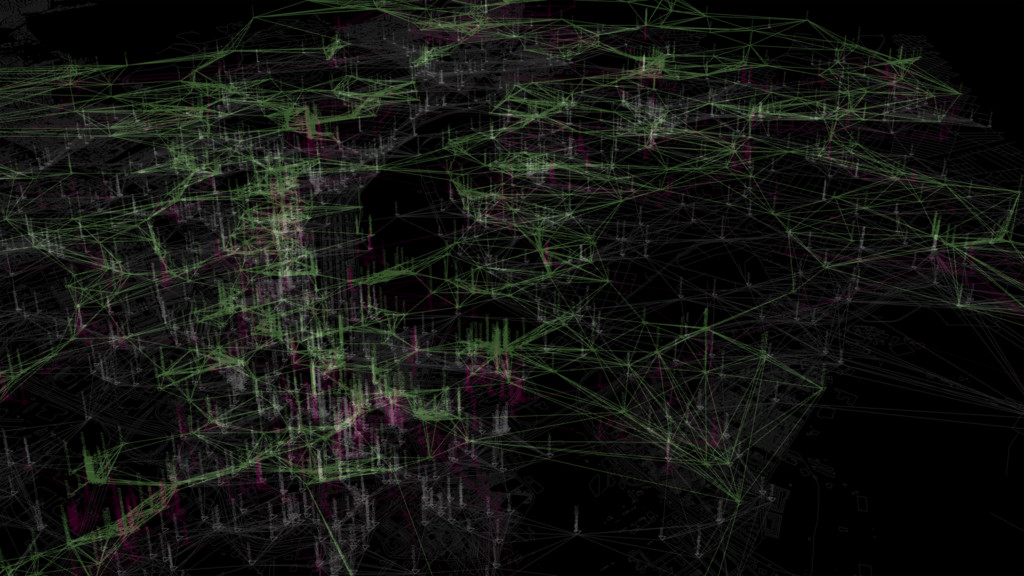 fig10-lucky graph
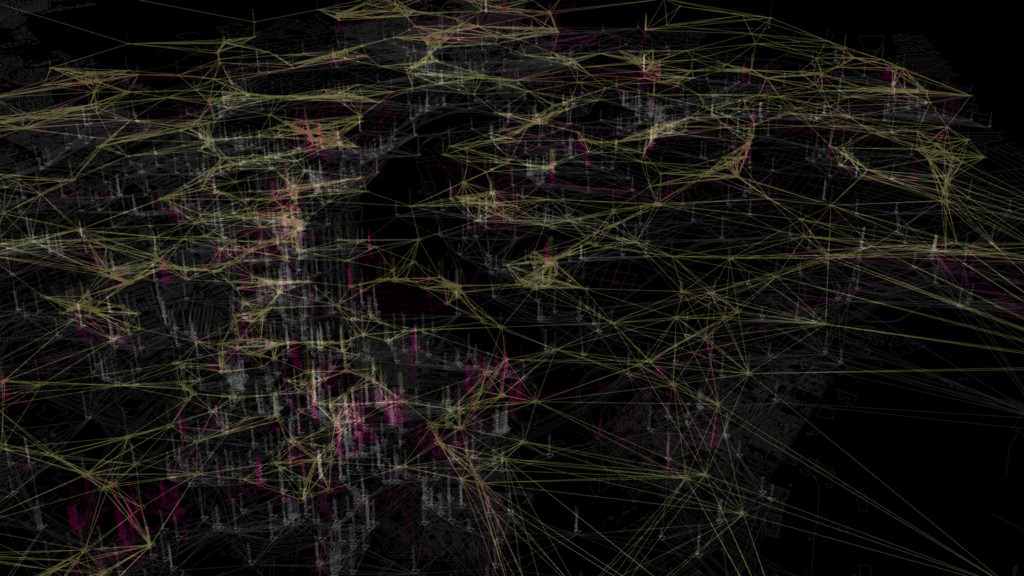 fig.11-oil grap
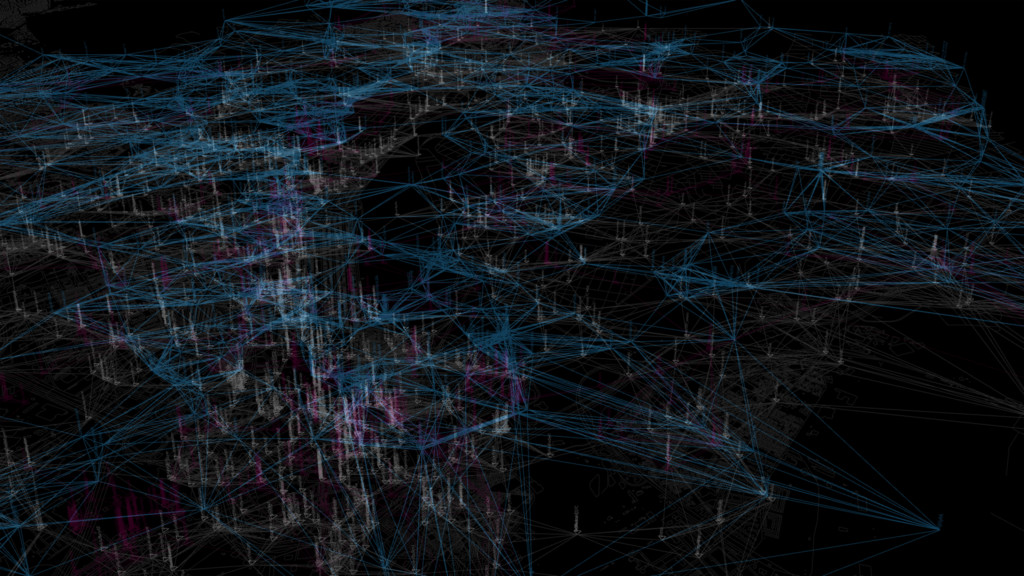 fig12- anxiety graph
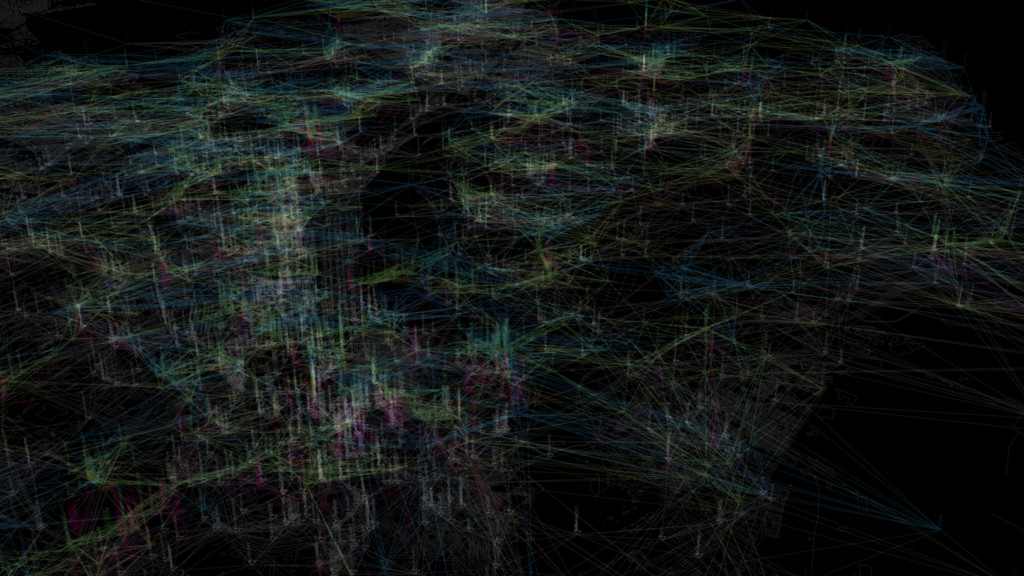 fig.13-overlapping graph
INTERACTIVE MAP
Finally this is our interactive map. Where we found the nearest node between geolocation and street nodes.
The agent is simulating the shortest walk between all nearest node from beer hashtag.
 fig.14- shortest path between tweets (gif)
FURTHER APPLICATIONS
After exploring this workflow between graphs and social media data, we conclude that has a interesting potential since we are able to simulate by a single agent this could be applied to delivery services and other applications like public transportation or an health emergency transportation.
CREDITS
Twitter city is a project of IAAC, Institute for Advanced Architecture of Catalonia developed at the Masters in Advanced Computation for Architecture and Design in 2022 by Salvador Calgua and Charbel Baliss and Faculty: David Andrés León, Dai Kandil.