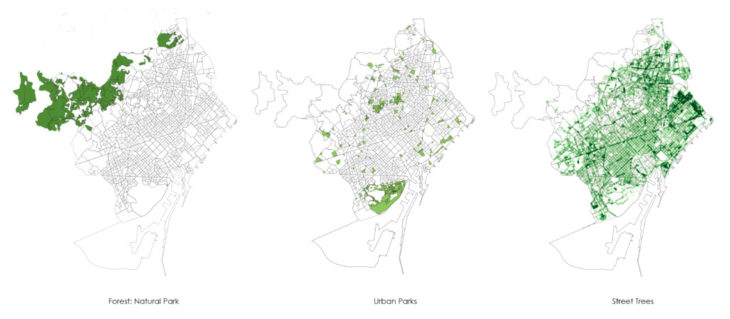
For our course Digital Tools and Big Data – 1, we used our Internet of Cities project as the base to conduct data merging and analysis using Pycharm and QGIS. Our project “Drive in Nature” targets the issue of the increase in green within Barcelona city which sadly has not resulted in any increase in biodiversity. Looking at the existing patches of green (forest and herbaceous vegetation) in the Barcelona Metropolitan, it can be understood how the larger forests are fragmented by the motorways. Hence the wildlife cannot travel from one territory to the other.
The project aims to mitigate this matter at two different scales. One would be to connect the existing natural parks across the motorways using wildlife corridors. Second would be to then bring this continuity into the city. Once in the city, in the urban scale, there are more parameters to encounter. Inside the municipality of Barcelona, the “green areas” are divided into forest, urban parks and street trees. The city has a fair share in the natural park of Serra de Collserola to the north which is shared by eight other municipalities. Collserola is the only natural park that is in such close proximity to the urban fabric. The parks that are adjacent to Barcelona but detached are Parc del Garraf to the west and Parc de la Serralada de Marina to the east. The wildlife corridors connecting from the east and west would provide for the filtration of green into the city horizontally and Collserola would provide for connections to be made vertically to the coastline. We used datasets of urban parks and street trees from Open Data BCN to produce the following maps in QGIS.
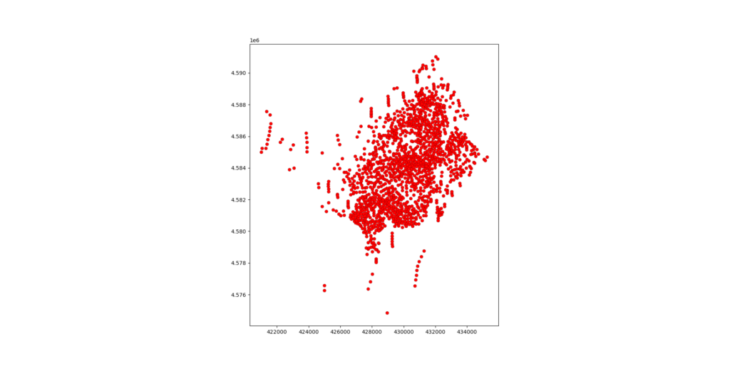
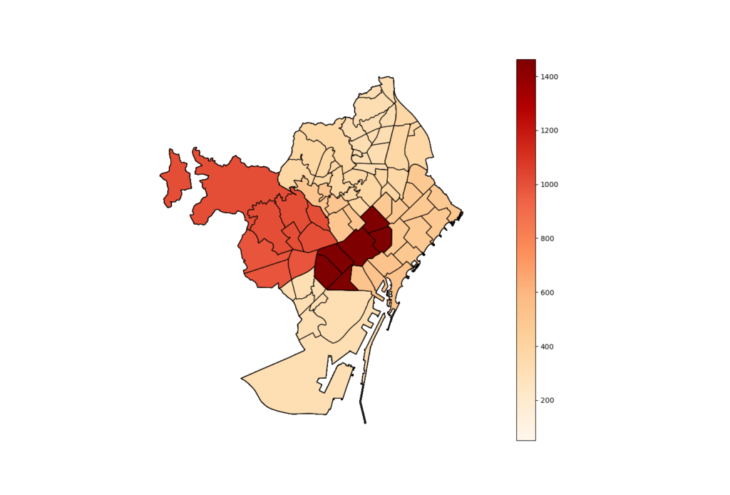
After mapping the density of green, the focus shifted to the mapping of the population density. Barcelona has a population density of 16,000 people per square kilometer approximately. This figure makes Barcelona one of the most densely populated cities in Europe. Also the population density for Spain is actually much lower, which is 94 people per square kilometer. To understand the population density, Panda was used to read the JSON file for population density and plot using matplotlib.
In addition to the population density, we then added the property price per square meter.
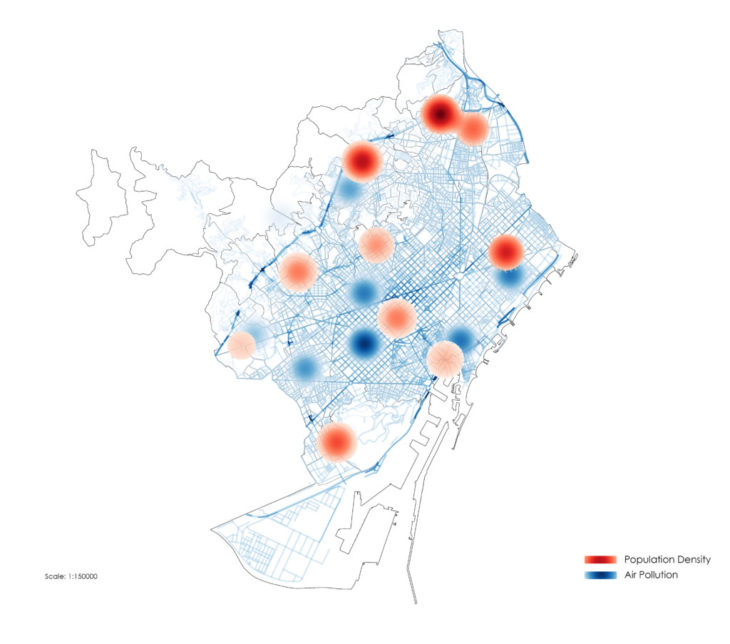
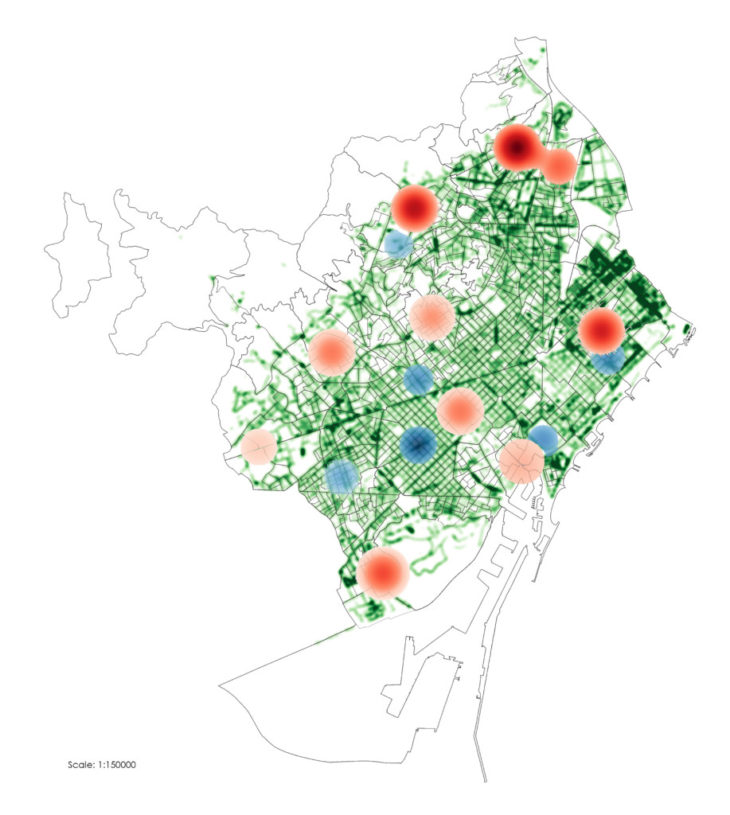
To add another parameter, we also mapped the air pollution data and merged that with population density. This map allowed us to understand how the two may or may not correlate. The air pollution is shown in blue and the population density is shown in red. We can see the population density is higher in the areas that are closer to the outskirts but the air pollution follows mainly the motorways and major streets such as the Avinguda Diagonal and Gran Via de les Corts Catalanes.
In the end we overlaid the three layers of information to identify possible locations for intervention.
The project plays a pivotal role in the analysis of population density per neighborhood and visualizing that data with levels of air pollution and different types of greens in the city.
References:
https://www.copernicus.eu/en
https://opendata-ajuntament.barcelona.cat/en
Trees VS Humans, Humans VS Trees is a project of IAAC, Institute for Advanced Architecture of Catalonia developed Master in City and Technology in 2021/2022
Students: Aida Hassan, Karim Abillama, Maria Magkavali
Faculty: Diego Pajarito