Preface
Transport systems of existing cities have been based on technological advancements and/or limitations of their time. Moreover, they conceptualized overlaying existing settlements. Before temporal, transport is relative to spatial factors. With purely geometrical constraints, the network must enable population flow, through whichever medium and meet its demand. This is considered a seemingly crucial factor in transportation but is additionally challenged by non-geometrical aspects like density and its like.
Introduction
The enormous expanse of AI capabilities coupled with web development has offered a broad range of applications in many fields. While statisticians and computer scientists deal with improvising these advancements, it is only apt for designers like us to experiment with the ease of operation it offers and incorporate it within our workflows. This project poses the question:
How can we use readily available tools to simplify city planning?
Rhino 3D is a CAD software used by jewellery, product, building, urban designers etc. Especially for added value by the integrated Grasshopper visual scripter and its plugins. Urbano, for instance, offers to load OpenStreetMap data inside McNeel’s Rhino for evaluative decision-making with zero lines of code.
On the other hand, Network Theory – an entire field dedicated to representing complex relations as a graph, is made available with the help of a Python library called NetworkX. The interoperability is very relevant for planners who encompass factors of sociology, ecology, public health, etc. in their strategy.
Hence a combination of the two is a superpower aiding design to that which is more data-driven.
Methodology
This methodology construed a fictional upcoming metropolitan city that required its transport system to be materialised from scratch.
The Grasshopper plugins in focus for this experiment are:
- Decoding Spaces – free software toolbox providing “a collection of analytical and generative components for algorithmic architectural and urban planning”
- Lunchbox ML – components for regression, clustering, and neural networks
Algorithmic Generation
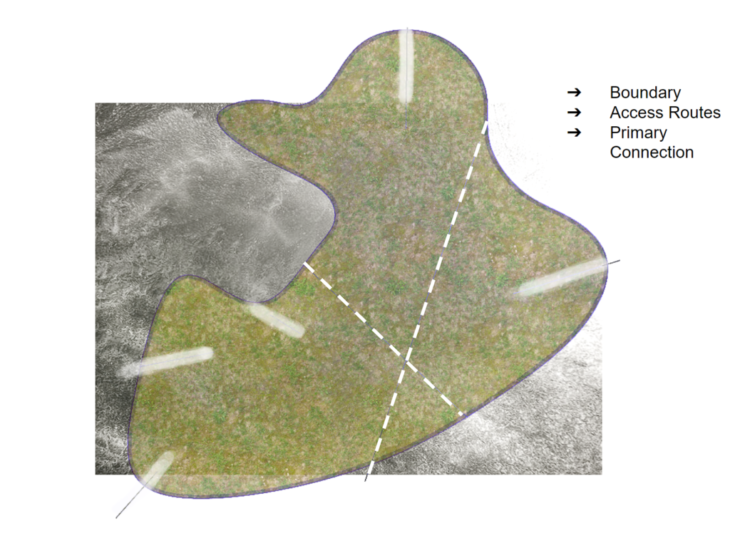
The first step to generating a city was creating the boundary. Using Decoding Spaces, input for minimum road lengths, street angles and seed values were specified. This also accounted for paths incoming to the city limits and existing non-negotiable connections. The result of it was multiple secondary and tertiary angled connections.
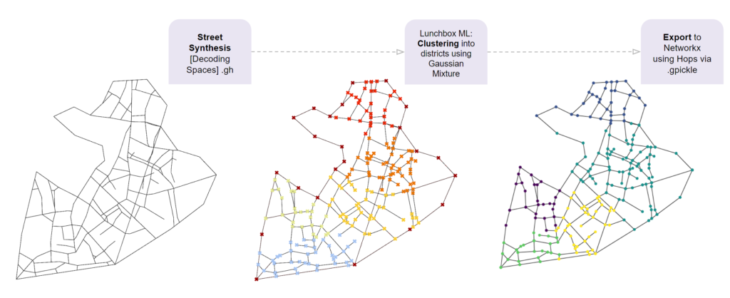
I then used Lunchbox ML over the layout for clustering with the help of a Gaussian Mixture algorithm. This algorithm represents normally distributed subpopulations with an already existing overall population, which would mimic segregation into districts having non-uniform density. Voilà we have a faux city!
The Role of Web Development
My next move was to embed some non-geometric information onto the ensuing geometrical layout. To enable this the network had to first be transferred from the Rhino 3D interface into a development environment. To maintain its context the geometry was converted into a graph with the help of the native Rhino 3D Hops component. The script accounted for the input of points, lines and district typologies. Then, node attributes of density were attached to these points of varied clusters with additional programming. And finally, I converted all of the data above into a .gpickle file extension to be read by Python in the Google Colaboratory Notebook, where NetworkX is brought into play.
Graph Optimisation
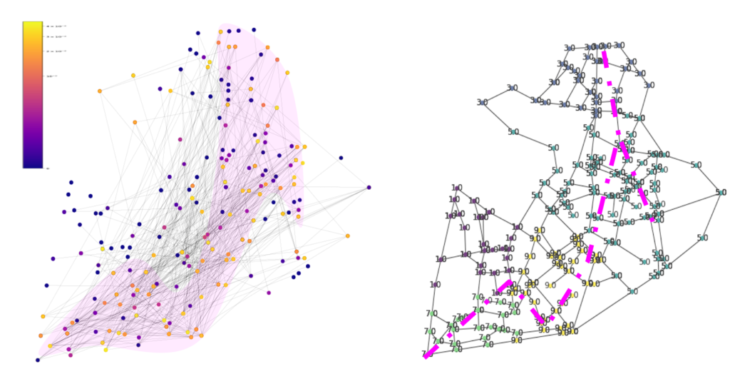
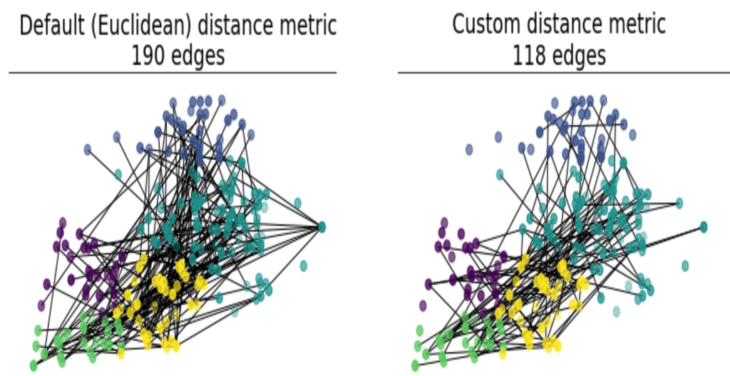
A transport network multigraph is created connecting all nodes. Node attributes of density influence the weights of the links. A function of the NetworkX library enabled a graph based on a specific distance as a threshold (theta), beyond which connections were limited, securing varied neighbours for each node.

Analysis Using NetworkX
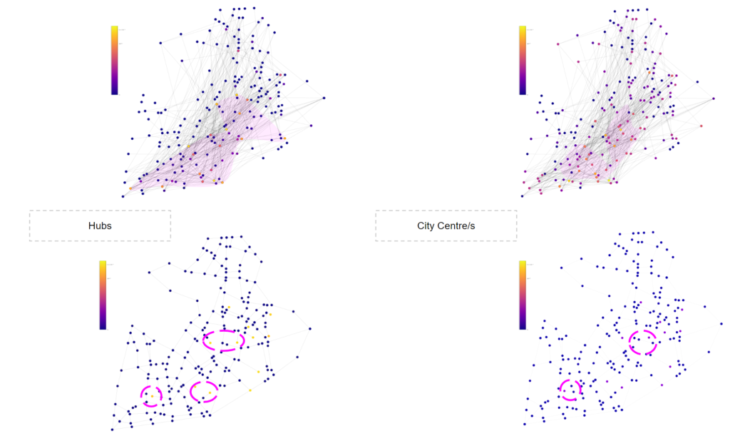
The resulting network was analysed and compared with the density-based Betweenness-Centrality. Overlapping amongst the most frequented nodes on the shortest path route helps identify a transport corridor over the city. Similarly, some other analyses could also be performed and visualised; such as,
Closeness Centrality: Points coinciding as the one closer to all other nodes are potential transport hubs
Node Degree Analysis: Nodes connected the most could serve as a city centre
Next Steps
The workflow served as a base for geospatial data processing. It would be interesting to add a layer of time-based metrics instead of Euclidean metrics to influence the graph threshold based on the time taken from each transport type. Further implementation seemed like a matter of exploring the multiple functions available at hand.
Credits
Webbing with the Web is a project of IaaC, Institute for Advanced Architecture of Catalonia developed at the Master’s in Advanced Computation for Architecture & Design in 2021/22 by Student: Maryam Deshmukh under Faculty: David Leon and Faculty Assistant: Dai Kandil