The project is a part of the analysis conducted for “The Energy Citizens”, an idea to create an Energy Community oriented towards self and efficient energy production and consumption. To understand the demand and supply of energy and its relation to its cost, the idea is to understand the stakeholders, and how the rates of energy are decided in the Spanish energy market.
OMIE is the designated electricity market operator (NEMO, according to European terminology) for the management of the daily and intraday electricity prices in the Iberian Peninsula. OMIE acts as a marketplace for the energy generators and energy traders to decide the rates for the trading between themselves. This trading happens always a day before, i.e. the energy rates for tomorrow are decided today.
The data analysis was made through python scripts, which were coded in a way that it is automated to download the data of the energy rates available in OMIE’s website for the past year from the present date. The Idea is to further analyze this data in different parameters and time periods, so as to understand the energy curve in a more specific and accurate manner. This can help to maximize the benefits for the Energy Community by exploiting the energy rate differences.
ANALYTICS
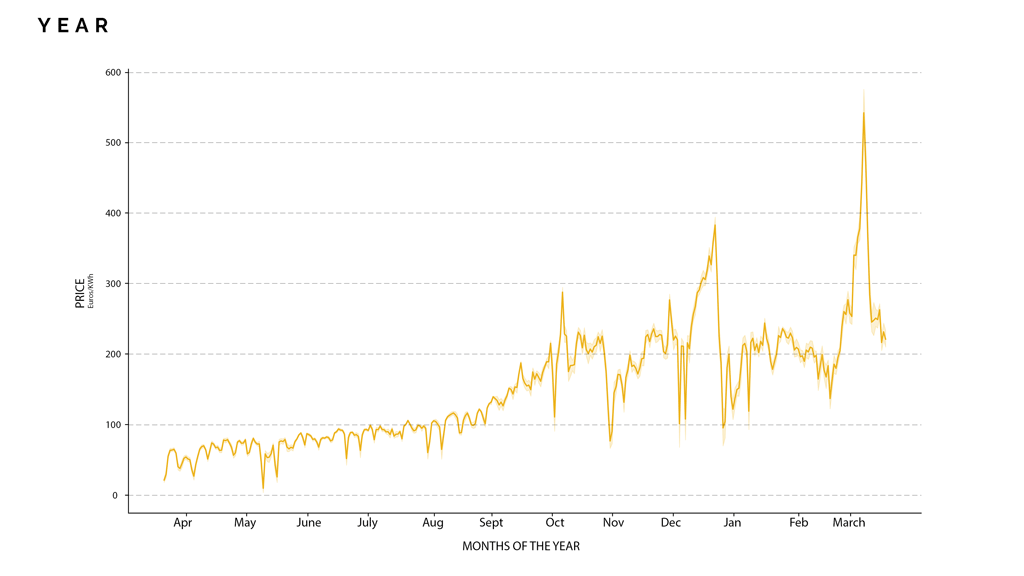
To get the holistic understanding of the fluctuations of the energy rates throughout the year, and to extract patterns between the energy curves, a variety of graphs for the past year, month and week were plotted.
NORMALIZED PRICE
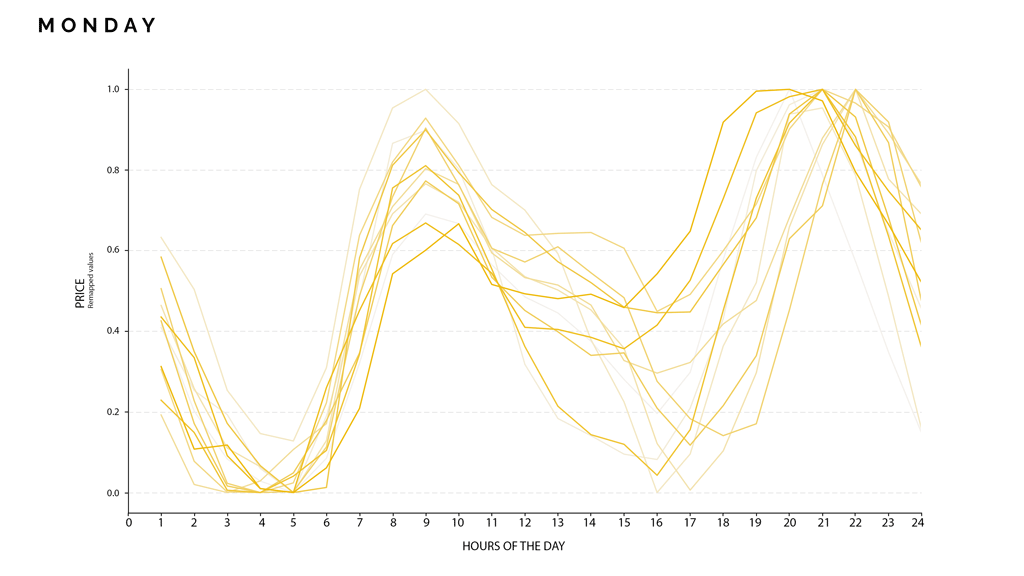
Retrieving the data produced in the first iteration of the analysis, a trend was identified when comparing the graphs of the days of the week. Thus, a pattern was extracted for the energy curve by plotting the graphs for every same day for the 52 weeks and remapping the values from 0 to 1.
TRENDS
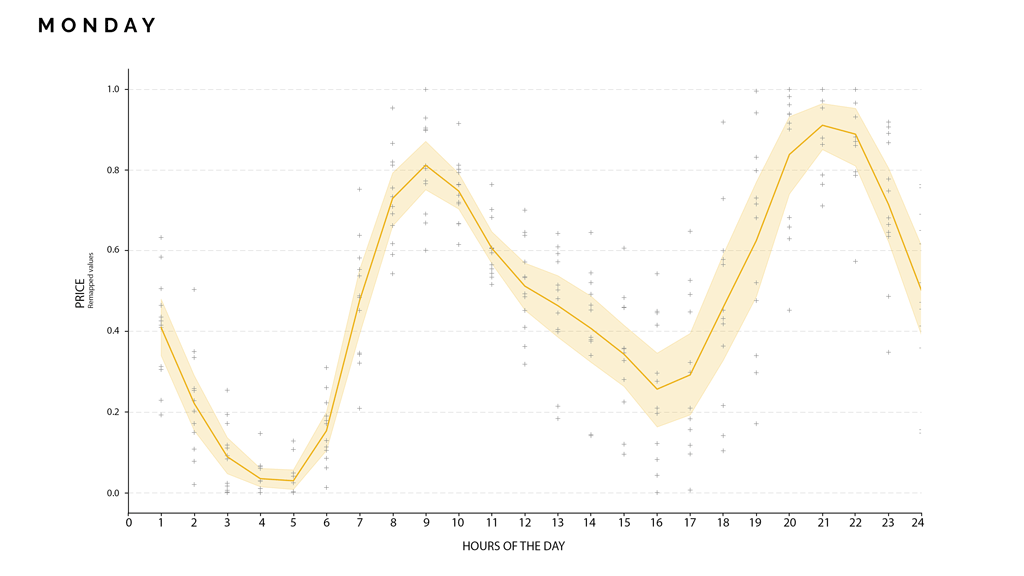
To establish a trend for the curve we calculated the mean for every hour of every day of the year and plotted it as the mean curve for the specific day of the week. Based on this policies were proposed based on the trend curve for the specific times of the day for the highs and lows energy rates.
TOMORROW
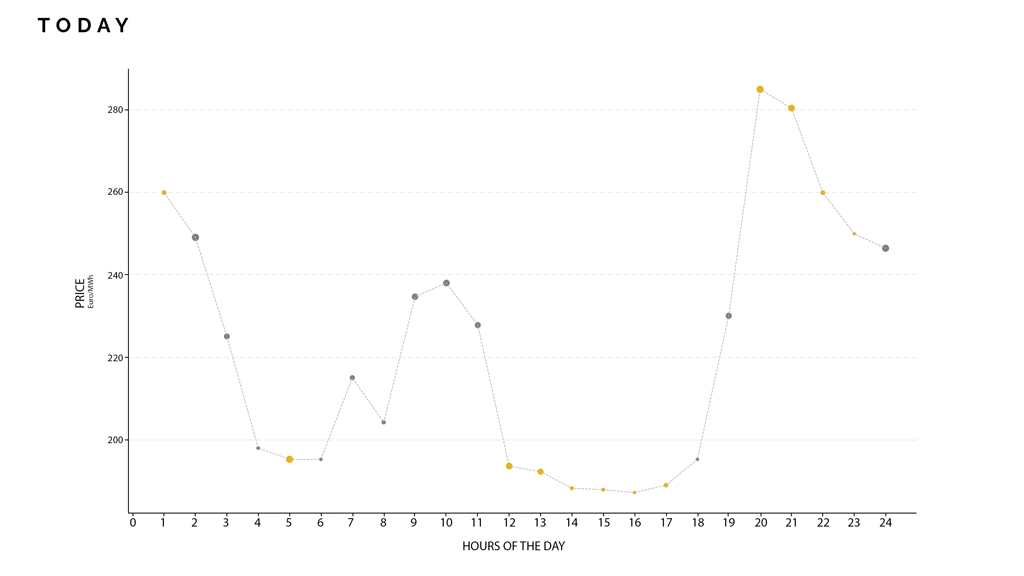
Taking the advantage of energy rates being decided one day earlier, the five highest rate hours and seven lowest rate hours are plotted to give the people an advance idea to manage their energy consumption for the next day.
DASHBOARD
All the graphs and statistics produced form a part of the energy tracking section in the dashboard for the project “Energy Citizens”. The graphs serve as an important part for raising awareness for the Energy Community and giving guidance for efficient energy usage in the neighborhood.

DATA SOURCE
OMIE – Operador del Mercado Ibérico de Energía
Available at: https: //www.omie.es/
‘Track your Energy’ is a project of IAAC, Institute for Advanced Architecture of Catalonia developed in the Master in City & Technology 2021/22 by Students: Maria Augusta Kroetz, Robert Youssef, Karim Abilama and Pushkar Runwal and Faculty: Diego Pajarito, Assistant faculty: Tugdual Sarazin.