We’ve all seen this scenery around town
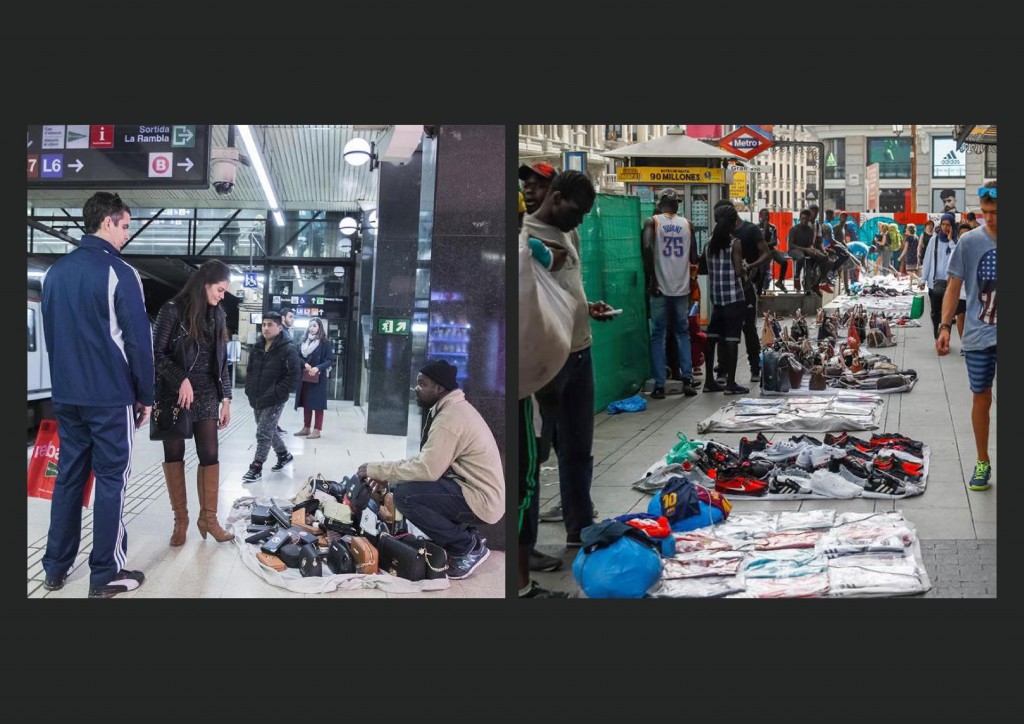
But who are these people?
#Topmantas
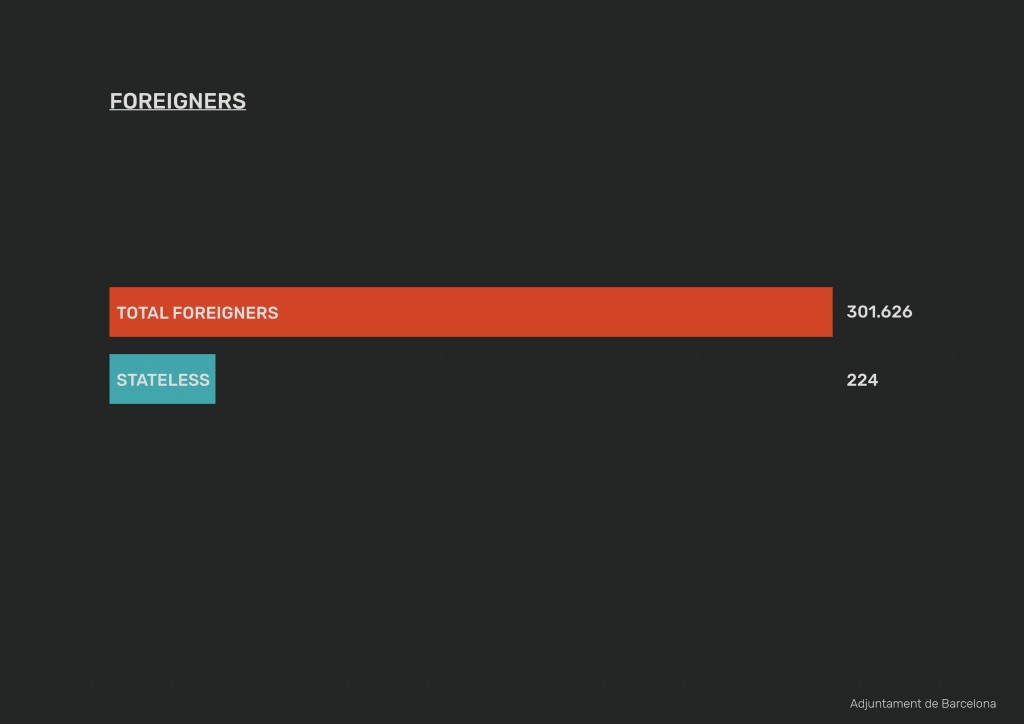
They tend to be undocumented foreigners.
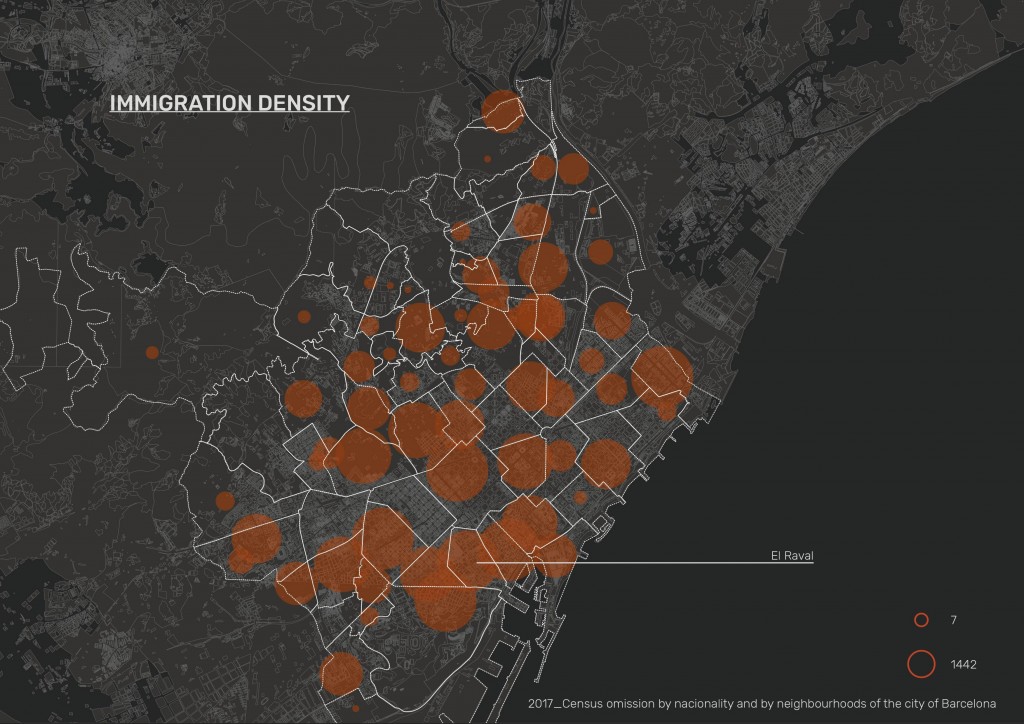
Mainly found in El-Raval area
As it seems, everyone has an opinion about them, we wanted to sample that using twitter.
Purpose:
To be able to see how immigration policy is affected by #topmantas and what does it mean for the urban framework.
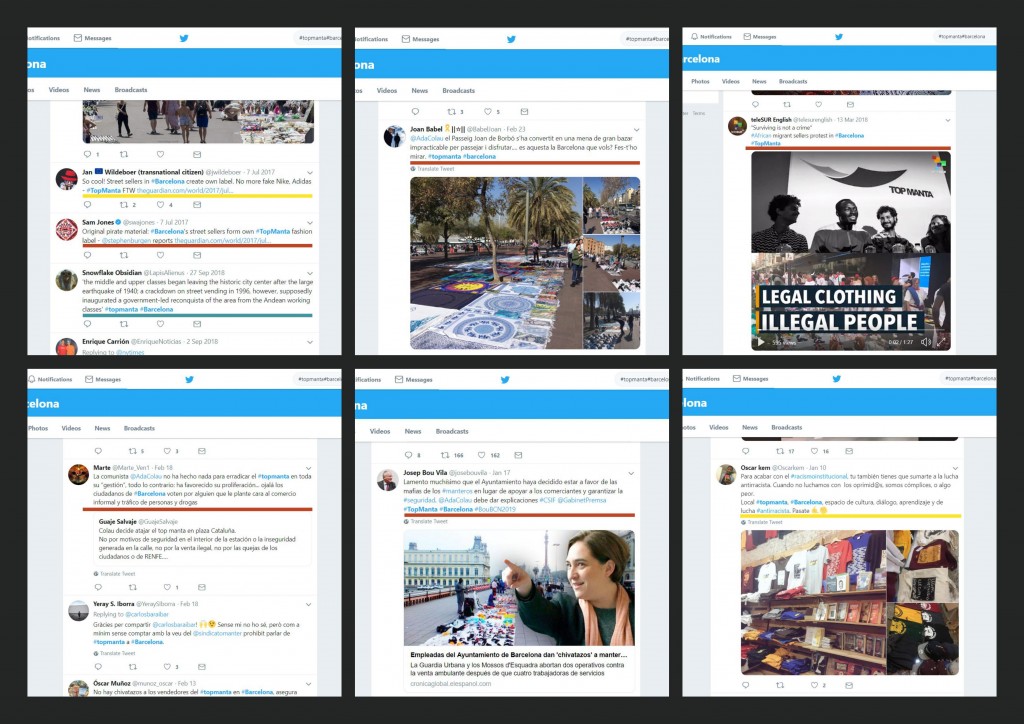
Tweets: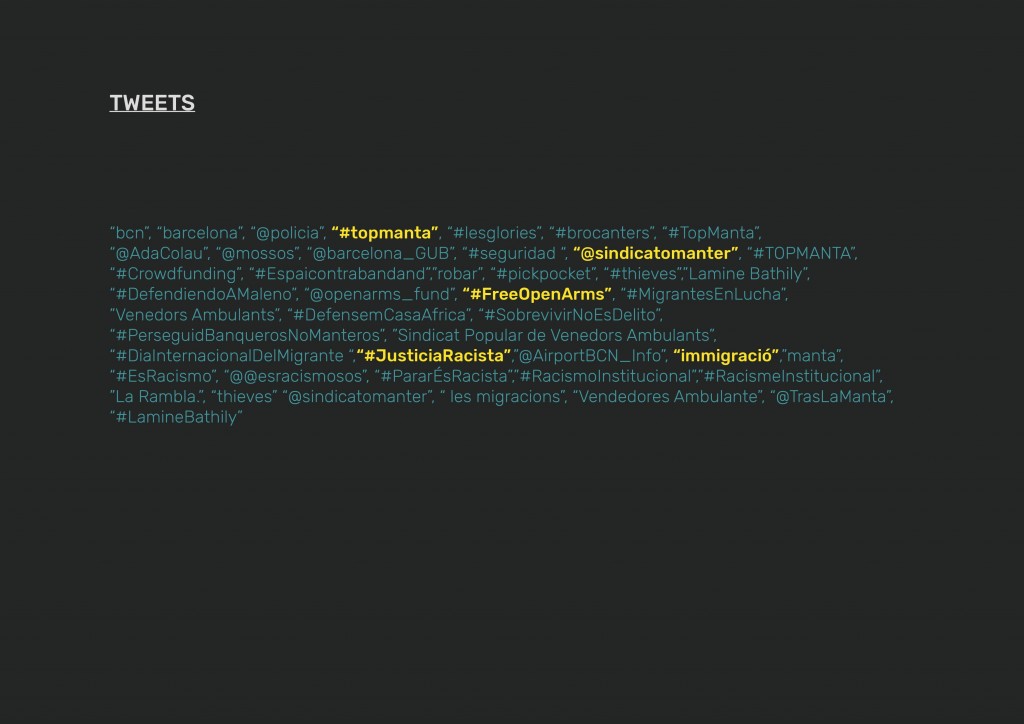
use of different hashtags for searching data
Examples:
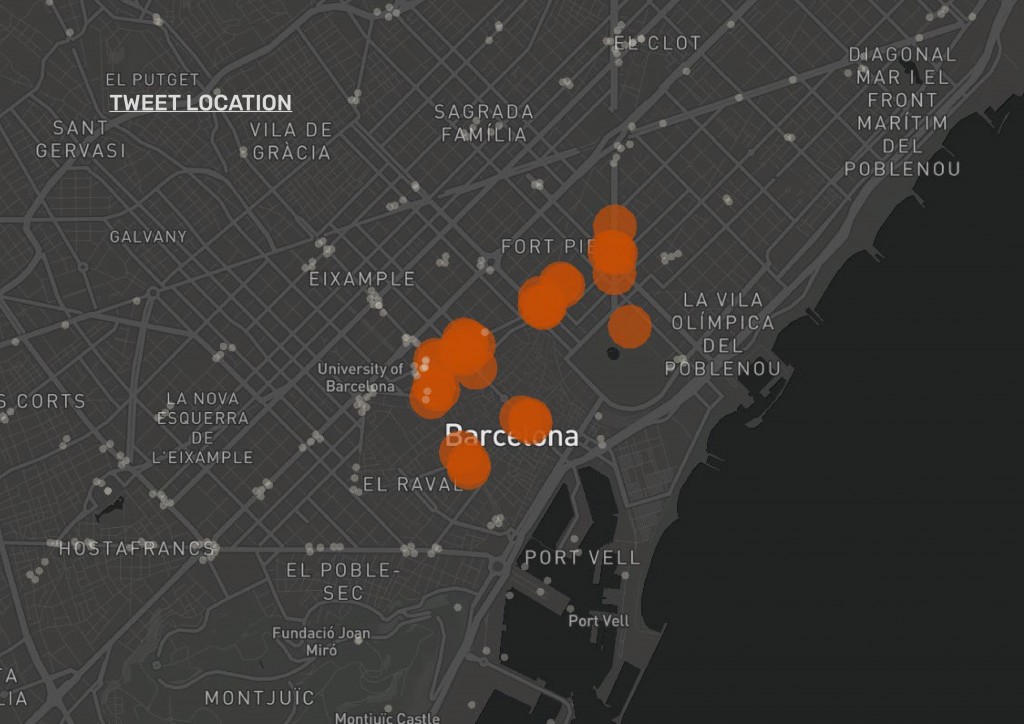
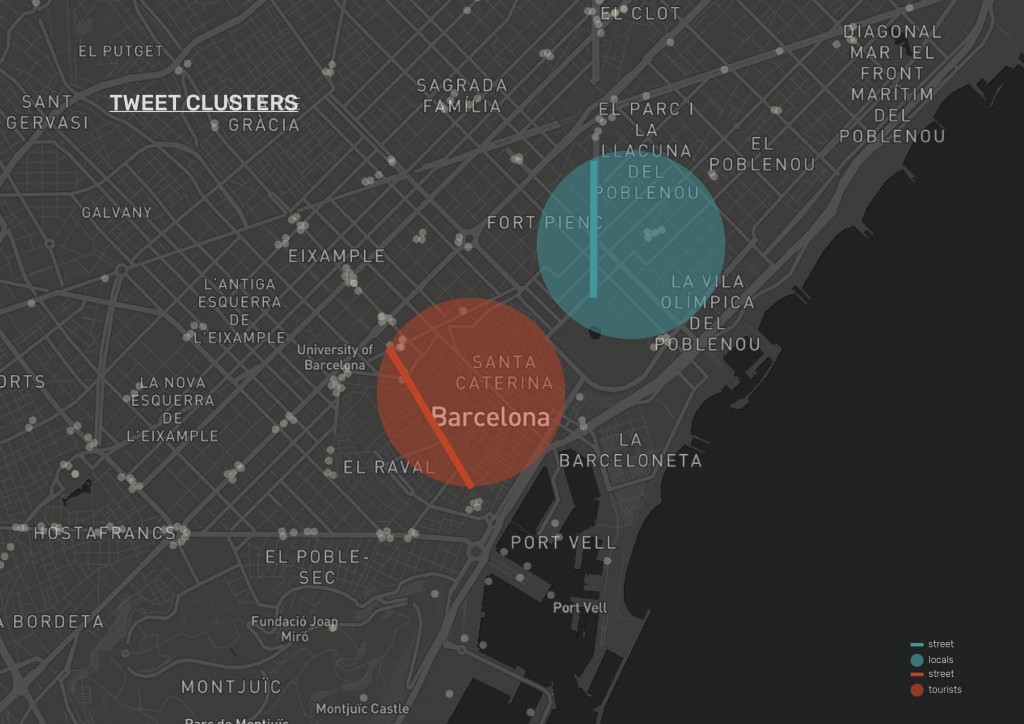
After mapping the tweets found using mapbox, we noticed that most of the tweets are centralized in the center.
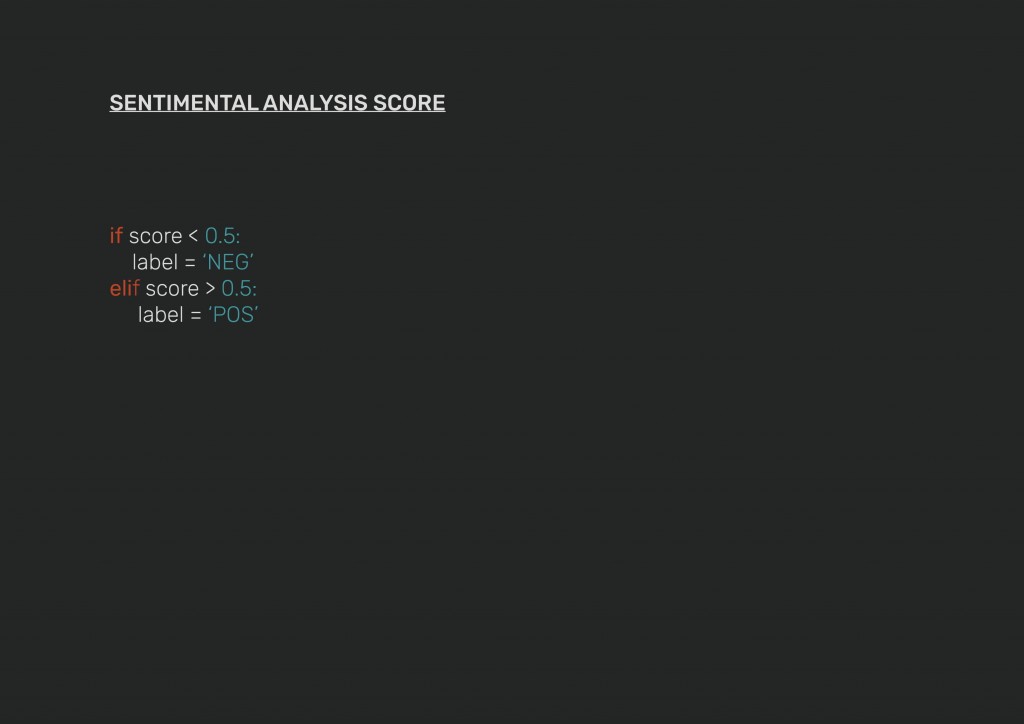
In order to understand the opinions behind these tweets, we trained the data set-based on the sources below:

Later, assigning a sentimental analysis score:
The result as shown in pie charts below, represent the percentage of positive to negative tweets in each location. The yellow represents the negative analysis, whereas the blue the positive one.
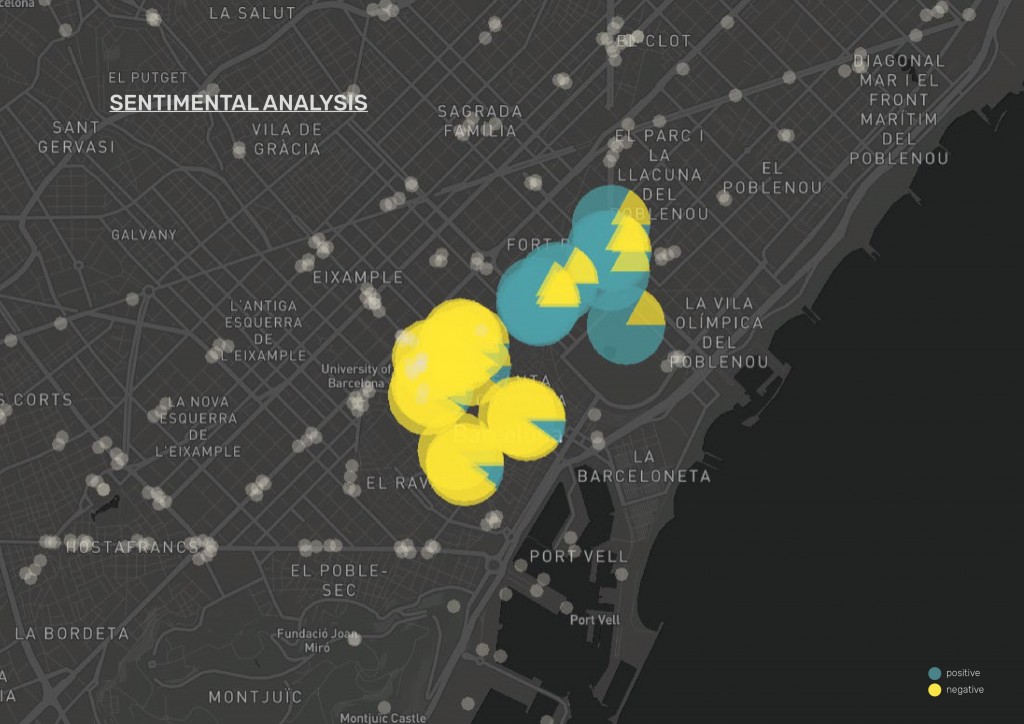
Tweet clusters show that most negative tweets are mostly located in the touristic areas, whereas in the local areas we see less negative tweets.
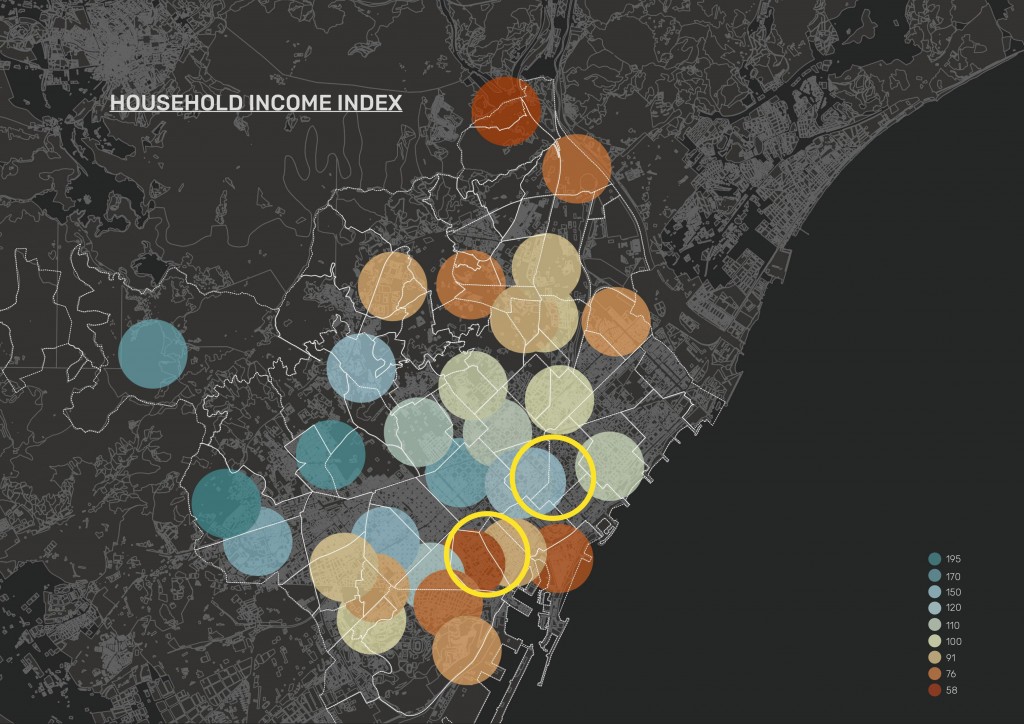
Comparing these areas to the household income:
Conclusion:
Sentimental analysis accounts to time and quantity, in this course we were able to collect over a small period of time. To be able to have a better level of accuracy we need to collect more data concerning our subject.
#topmantas is a project of DIGITAL TOOLS & BIG DATA II of IaaC, Institute for Advanced Architecture of Catalonia developed at Master in City and Technology in (2018/2019) by: