THE PULSE OF A CITY
The fact that tweets are timestamped fascinated us, that meant we could know what was happening, when, to the millisecond. The pulse tells a lot about a person’s’ mental, physical and emotional state, stressed or relaxed, active or chilling, excited or depressed. So our question was, if we considered the city as a person, could we know what’s it doing? how is it feeling or what is it thinking? If successful, would we start treating and holding it to the same standards we do ourselves and each other?
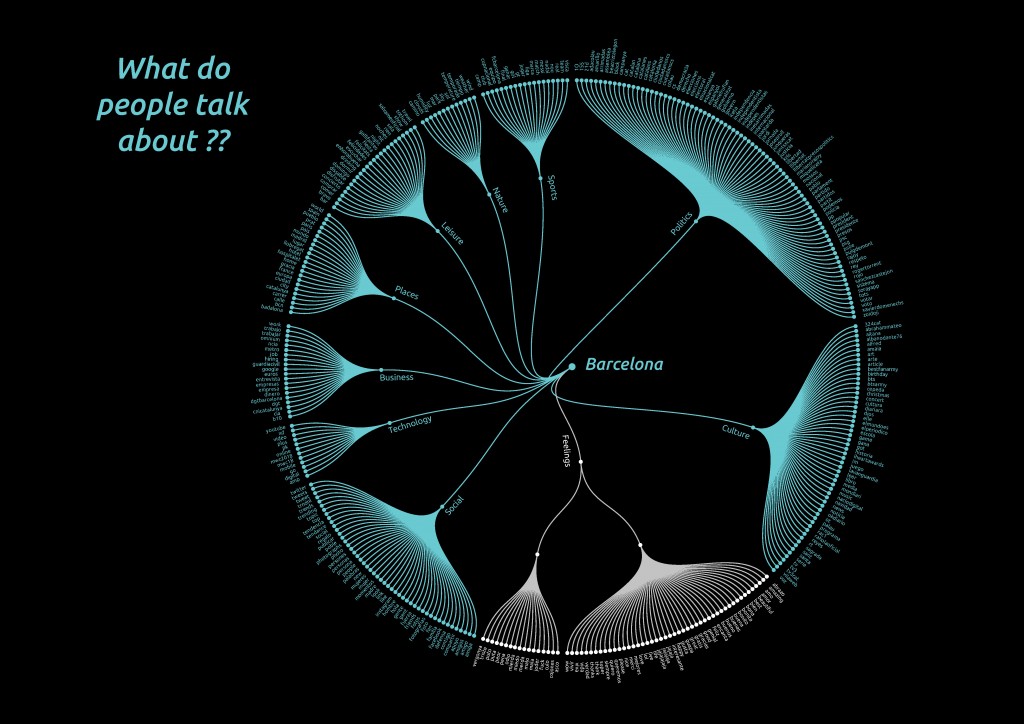
What do people talk about? Because cities are made of people, the first thing to do is know what they’re talking about. Like the other teams, we went through the top 300 most recurring words in the database, and of course categorized them into topics or dictionaries. We found the following categories: culture, business, technology, social, politics, leisure, nature, sports and places. On the other hand we classified bad and good feeling words, but not taking it into account for our analysis.
When applied to a city, it is important to understand where all of this is happening; and whether or not, this 10% of geolocated tweets is representative of the whole.
After writing the code that allowed us to differentiate if a tweet will go to one dictionary or another, we found that Politics is the most talked about subject when considering the total amount of tweets. In the case of the geolocated tweets(10%) Culture would be the most recurring subject. And in an international city like Barcelona with massive touristic flows, who is it that’s talking about what says a lot. We could see in this simple diagram, that when we check the language of the 100% most of them are local languages (spanish and catalan). However in the 10% the proportion of local languages decreased a lot, specially the catalan language. That made us understand that most of the geolocated tweets are tweeted by tourists.

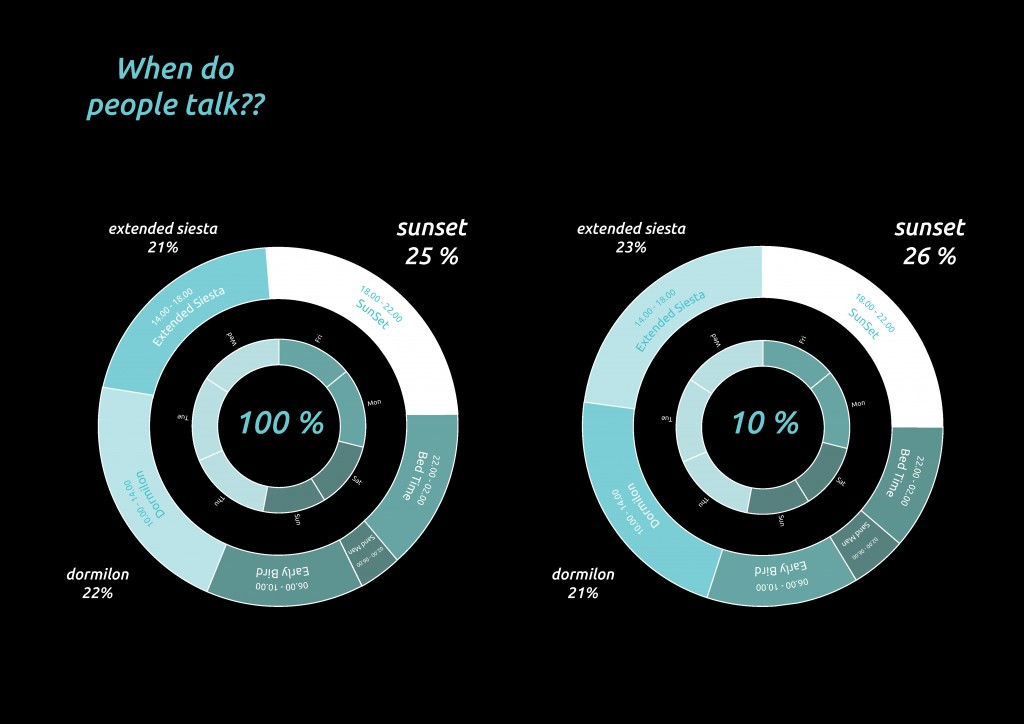
We felt it was important to go step by step when looking at the time factor, so we split the day into 6 equal time ranges of four hours each. We found that most tweets were between 10am and 10pm Tuesday through Thursday, with the majority coming between 6 and 10pm.
We can say that in terms of TIME, the 10% works as a representative of the 100%
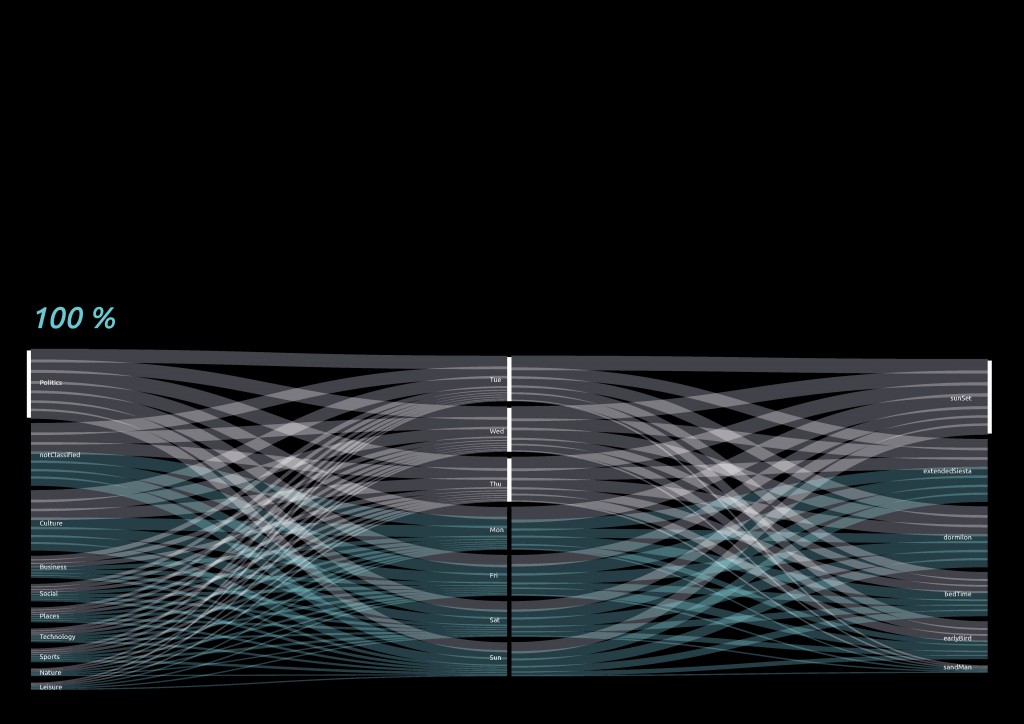
So when we crossed all these components together (day time range, days, topics and users) we see that from the whole database, people talk more about politics, mostly on Tuesday (close to Wed and Thu), during the sunset (from 6 to 10).
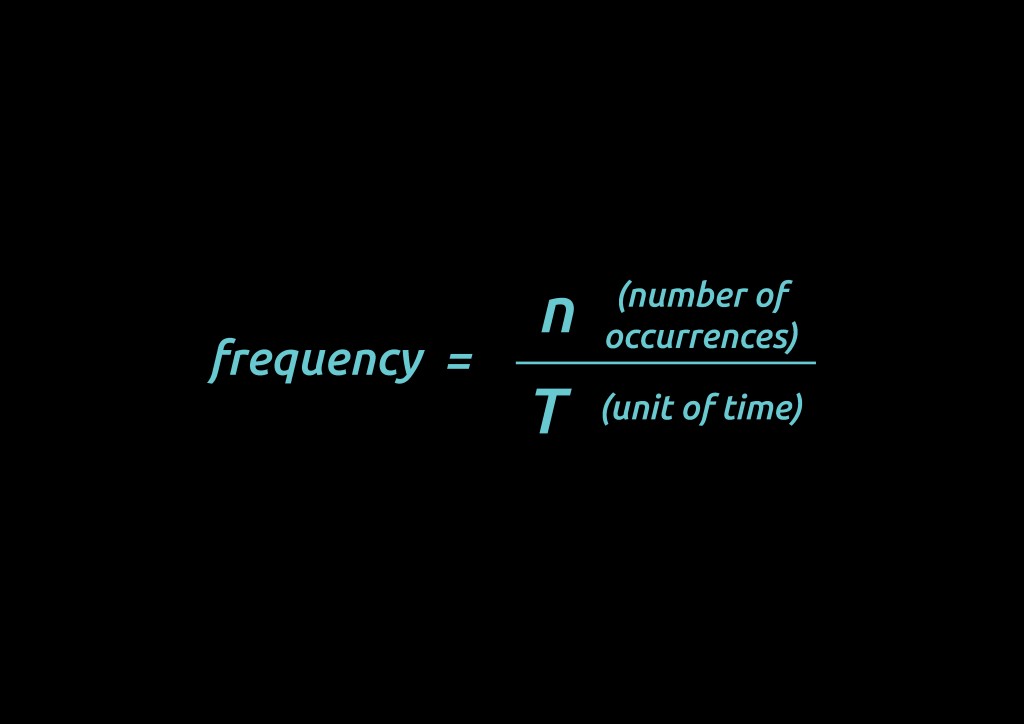
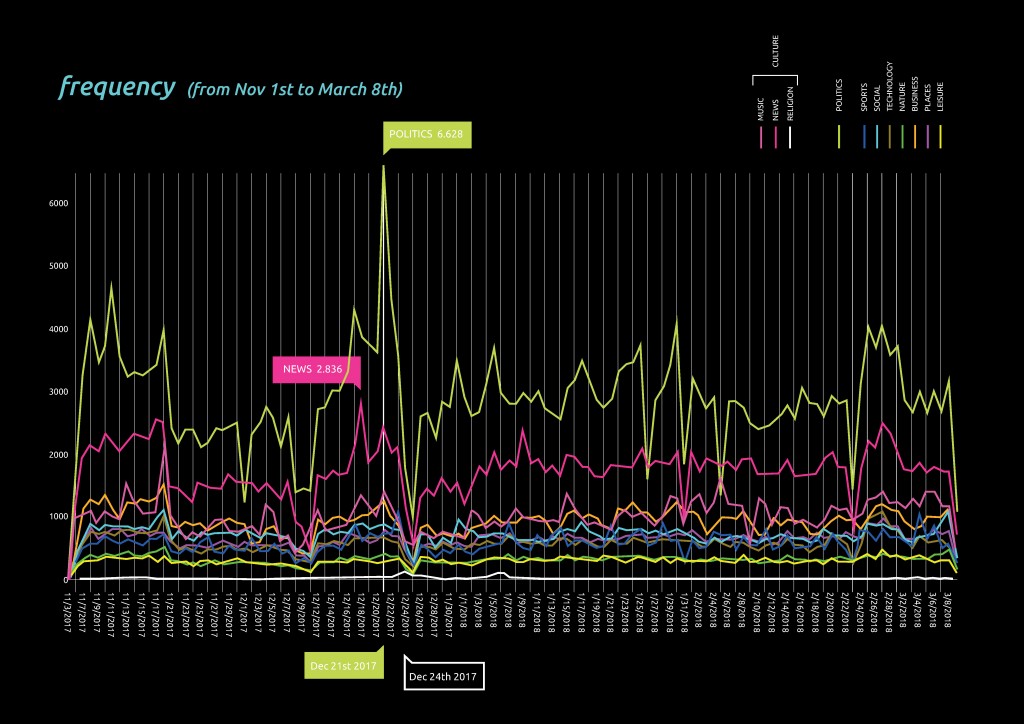
Considering the city is not exactly a heart, we made the analogy of pulse to frequency; which is the number of events, here N, happening every T amount of time.
How does one experience a pulse? We all know the heartbeat monitor; it shows a graph, and makes an annoying sound; So we started with the graph;
Two notable days; a peak on dec 21 and a valley on dec 25th, a good sign for humanity.

How does this pulses look like within the city? How does the city sound?
For this particular analysis. We decided to focus on December because it showed the most Variation with the highest peak and the lowest valley.

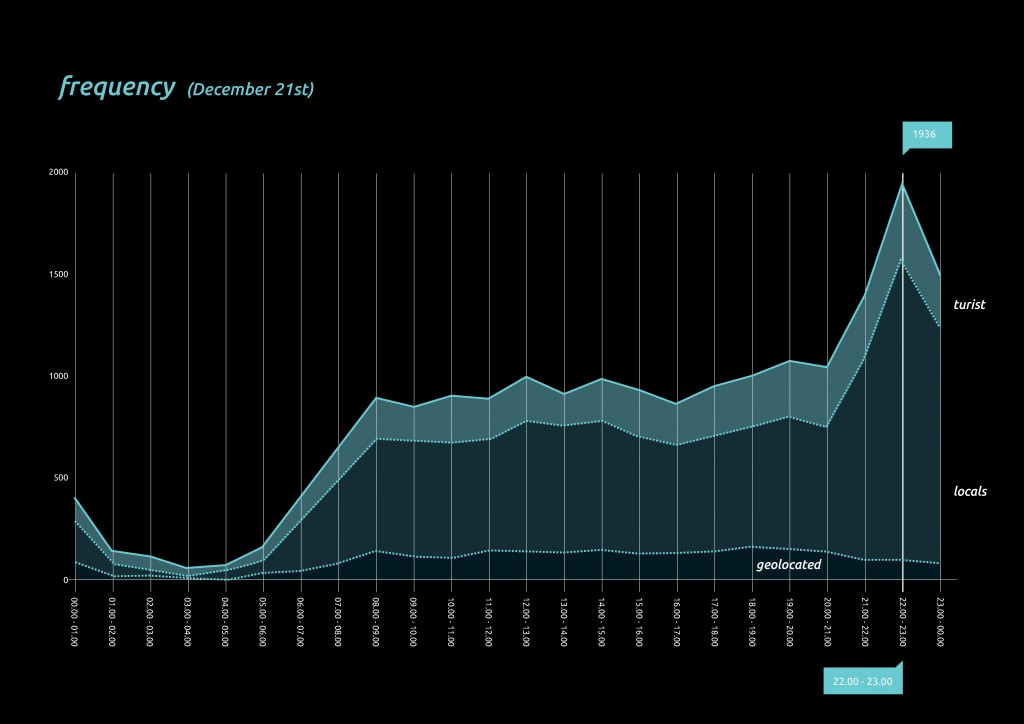
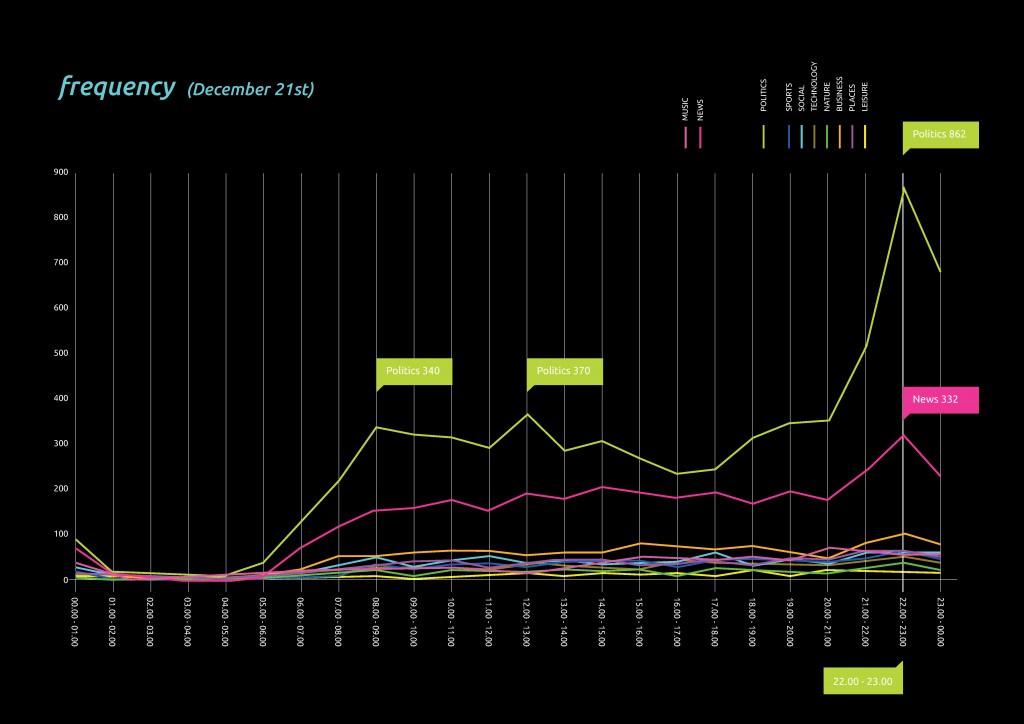
We picked December 21st, the highest peak of the whole data base, to further analyze how the pulse of the elections day sounded in the city.
THE PULSE OF A CITY is a project of IAAC, Institute for Advanced Architecture of Catalonia, developed at MaCT (Master in City & Technology),
2017-18 by:
Students: Camille Feghali and Irene Rodríguez Vara
Faculty: Luis Falcón
