The analysis and interpretation of the “City from distance” represented one of the main challenges we faced and that led our research.
The intention was to interpret and overlay two different points of view, the results of two methodologies, the spatial analysis of who can interpret the site only from a distance and the experiential one of who lives on the spot.
Nuevo Polanco, Mexico City
Nuevo Polanco, before called “Colonia Granada” is an area of Mexico City that has captured our interest for the results of the regeneration intervention. An urban regeneration strategy that came principally by business interests, but where its second-order effects were gentrification and social segregation.
The reasons why we chose this area are the following:
- The site had a major transformation in the last decade
- Used to be an industrial site
- Huge private investments have been invested in the area
- High risk of gentrification
- Some of the criticism is the urban integration between northern and southern areas
The area is separated by a high-speed avenue (San Joaquin) to the northern pencil, which is a poorer area, which represents the example of a huge inequality gap in the zone. In the gif are highlighted the main areas of study and analysis.
Methodology
The experimental methodology has seen the research, the analysis, and subsequent overlapping of the data and results of the two analytical modes:
- Spatial Analysis
- Experiential Analysis
Spatial Analysis
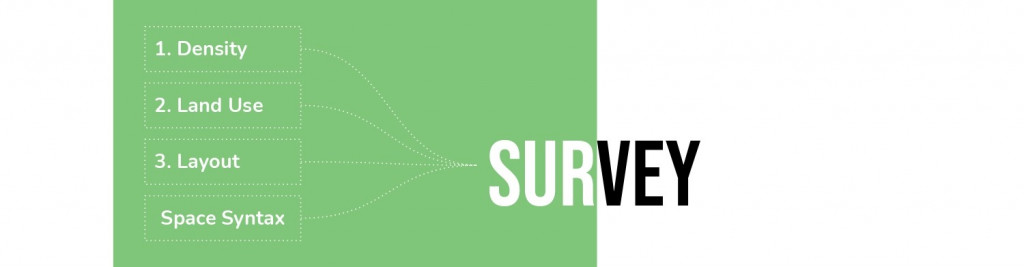
Among the quantitative data chosen to conduct the spatial analysis are the following:
- Density, as one of the most important spatial dimensions of urban planning and determinants of street activity.
- Land use, with the idea that the mix of used is part of the street activation and allows the social relation. Where the different configuration of uses allows for a mix-use in different levels.
- Layout to interpret the spatial configuration in terms of permeability between the walkability, streets network, and building.
The space syntax analysis was applied to the study of the urban planimetry of our area of interest, to understand the topological configuration of the grid and the reciprocal relationship between its street segments.
By 3 different steps of interpretation:
- Axial analysis: To perform numerical evaluations, we converted the axial map into an axial graph in which each node was an axial line and each edge was an intersection between them. This to evaluate their mutual relationships using graph-based methods.
- Integration index mapping: This is the measurement of topological accessibility for all segments in the network, measuring the average depth of a segment compared with the others.
In the integration map, the blue color represents the lowest integration value and increases to red for the highest. Similarly, areas with high integration are defined as integrated, while areas with low integration are referred to as segregated. - Choice index: The choice map was calculated as the probability for each street segment to be crossed on all the shortest routes between the segments within a radius of 250 metre.
If the integration map, in relation to the movement of pedestrians, represents the most likely route, the map of choice represents the sequence of segments chosen by pedestrians during a route in a radius of 250 metre.
As the last stage of the spatial analysis we proceeded to overlay the results with the aim of extracting quantitative data and comparative elements between each analysis.
It is interesting to note how the road network divides, physically, the area into two parts, the south side, that was an industrial area and which is now being transformed, where for this reason the permeability is minimal, and the north side, defined by a more permeable area with a dense network of secondary roads.
The area on the south which is under development has several high-rise buildings which indicates that it is a densified high-rise area, on the other side the area on the north has small buildings with a more local but dense scale.
Finally, according to the geometric and topological structure of the matrix we can see how the the north side is characterized by a low road integration and also less used for routes shorter than 250 m.
The experiential analysis
For the experiential analysis we did a survey on site to talk and measure the experience of the people who walk and use the space all the days. For the structure of the questions we used the theory of spatial Analysis to have a relation between the two analyses and finally allow us to compare both analyses.
To find the location of where we wanted to do the surveys we did an analysis of space syntax first to determine which points or streets have a better connection or a bad connection to prove if the result of space syntax is the same that the experiential analysis.
After three days and 62 surveys we were able to ascertain the reality of the people in the specific points. The results were much varied, giving us as a result that the area according to the user’s perspective is a safe area, full of life only during the week because for them it is a business area, but with a high rate of traffic and presence of cars.
In addition, the surveys showed that pedestrians feel safe in the area and most would not change anything about the site to feel safe, the area is also compact with a diversity of uses as respondents said they find everything they need in close by distance.
For the last questions, a map of the best and worst connected streets according to space syntax was used to compare the two results.
In the comparison we found the first contradiction with respect to where people prefer to walk, that the level of integration is high but then at the same time the spatial quality is lower. It was interesting to compare the quantitative indexes that define the integration and choice within a network and the qualitative results of the space and perception of those who live in the particular space every day and who choose different paths from those suggested by the quantitative and topological data of space syntax Lago Andramaco street. In the comparison of density, layout and land use the results in some cases are similar but in others like land use where the site has more residence than business which does not match, in the other hand the diversity of use and density have similar answers.
Conclusions
In conclusion, sensory analysis can help us to understand the site in a very general way of perception for the infrastructural problems but not the real problems of the people who use the space, and have a different way of thinking from professionals such as architects or engineers, who often ignore the human side of the street, which is the fundamental element for a street to have life and for a city to function as such. On the other hand, the use of technology is increasingly becoming a fundamental tool for city planning with the use of data that allows us to have exact data to be able to intervene or plan. For this reason, tools such as space syntax can become a very powerful tool if the opinions of the citizens are integrated.

The city from distance is a project of IAAC, Institute for Advanced Architecture of Catalonia developed at Master in City & Technology in 2020/21 by students: Simone Grasso, Sasan Bahrami, Kevin Aragon, Juan Pablo Pintado Miranda and faculty: Francesca Arcuri & Federico Parolotto.