
Abstract
Use AI models and ML to predict the influence of Airbnb listings in the housing market in Vienna.
Problem
Airbnb has been a blessing and a curse. It has provided an alternative source of income for many people that enables them to do many things; at the same time, it has brought healthy competition to the hotel industry that had comfortably been charging ridiculous prices for travellers. But, on the flip side, it also has affected urban development, forcing people out of the city’s most interesting areas to make space for tourists. Without regulation, this Airbnb effect can quickly become a problem for housing. The consequences are that families and primary users of the cities are being pushed to the city’s fringes.
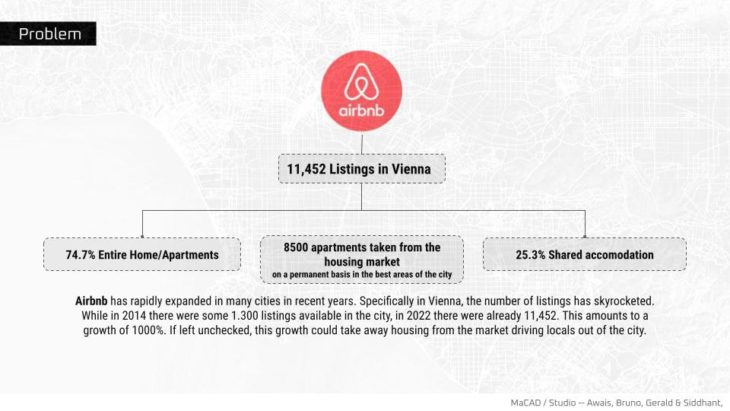
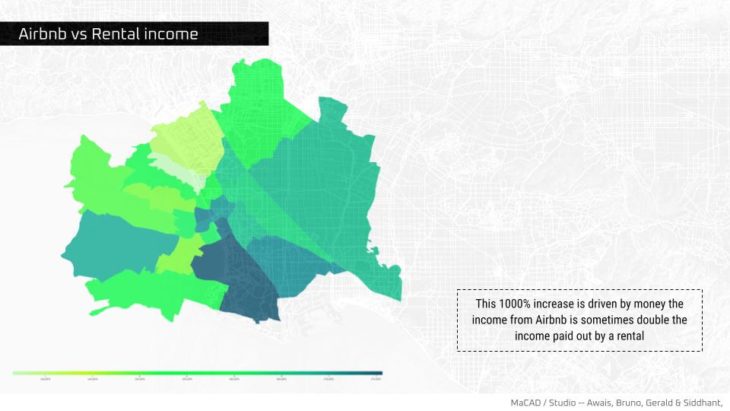
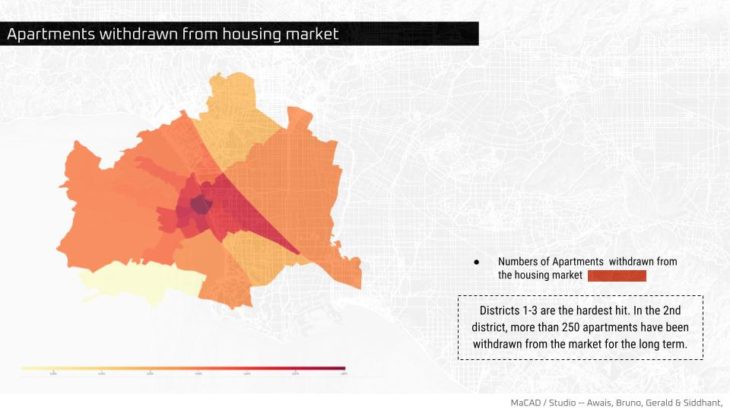
This problem needs attention. Some of the following graphs will explain the situation:
Solution
We can access Airbnb listings data and could source housing data from Statistics Vienna. By correctly using this data, we could establish a correlation between the number of listings and the housing price.
Furthermore, by training a model to identify this correlation, we could play different scenarios to illustrate the problem that Airbnb poses to housing.
Dataset compilation
Our biggest challenge is to source the property information for Vienna. One initial attempt was to use the property purchase index available on the website for Statistics Vienna as a source for housing prices.
However, after working with this data for a while and running different studies, we realized that this data contained property to exchange information mainly for the outer districts of Vienna and not for the central part, which is crucial for our study. Therefore midway through the development of this study, we had to rebuild our dataset from scratch.
We decided to use a real estate agency in Austria as a source for our information. However, using this website entails data scraping, and the drawback of many properties not having their location disclosed. Also, most of the properties were newly built, so we wouldn’t have data that encompassed all markets.
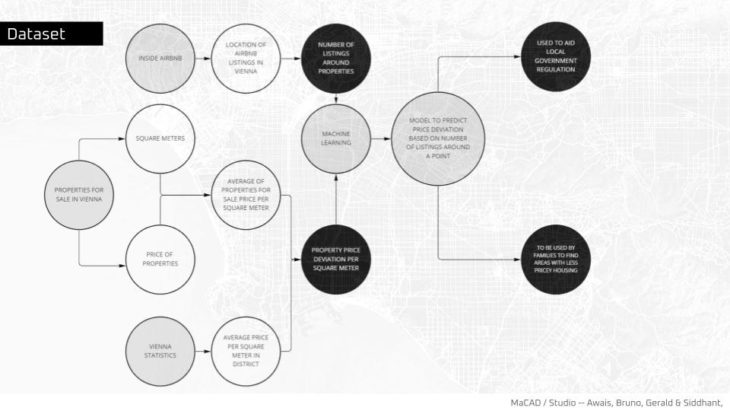
After using a scraping system to pull out the data for the different districts, we ended with a dataset of properties for sale in the 23 districts of Vienna with around 1200 data points.
We also had access to the average housing cost per square meter for each of Vienna’s districts, so we decided to convert the real estate dataset to price per square meter per property for sale to compare it with the average per district. This comparison yielded a per cent deviation from the average for the district. So now we had property points with a specific price deviation from the mean.
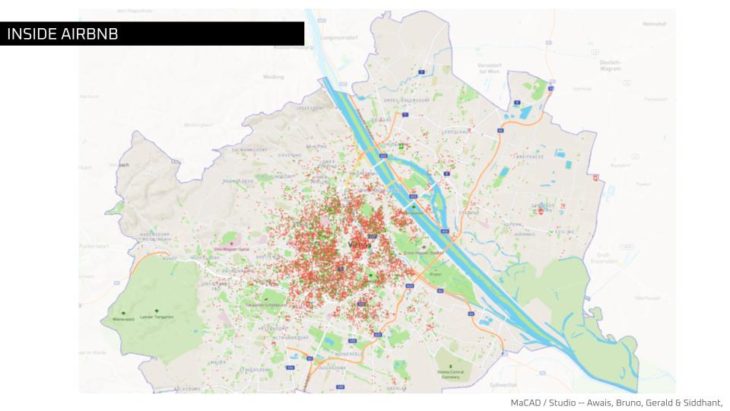
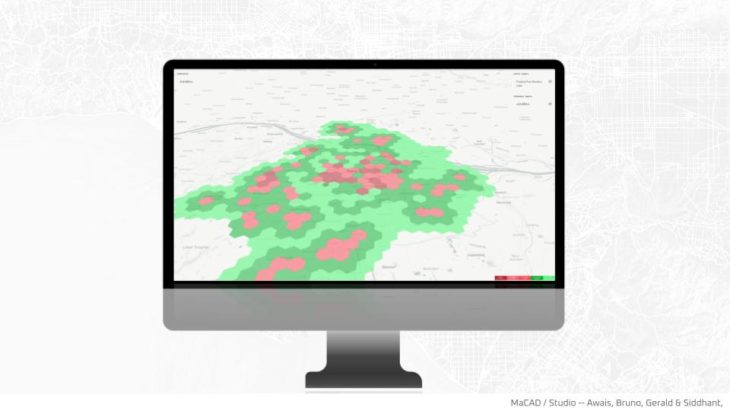
Next, we mapped the distances for each property point to all 8,000 Airbnb listings in Vienna. Having all this information, we could then filter the number of listings within a specified radius around the property to obtain several listings that would be relevant for our study.
We ran three different radiuses to obtain information: 200 meters, 500 meters and 1000 meters, with the results shown in the heatmaps below:
Training
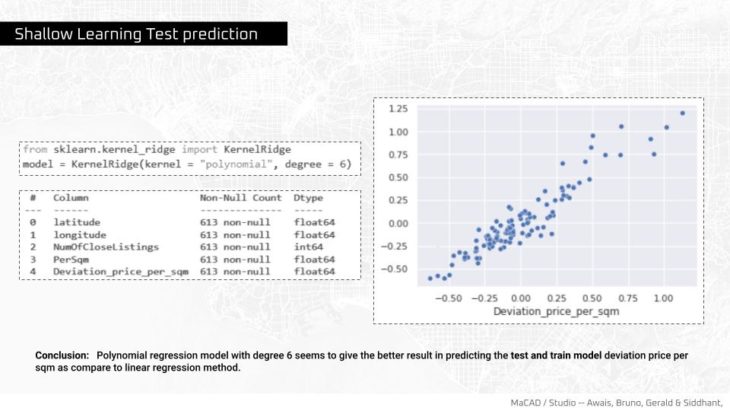
Once we had the dataset completed, we decided to test two types of training for the mode: a shallow learning model and an artificial neural network model.
For the shallow learning, we found that the linear regression with a polynomial function yielded the best results, around 88%.
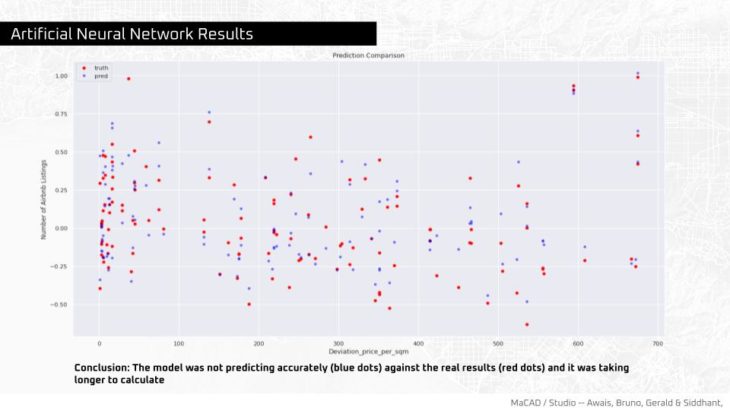
For the ANN, the results were not as good; the model was getting confused with some of the data.
So we decided to go for the shallow learning model.
Deployment
With a trained model, we created a Python script deployed to Mapbox; in this script, the user can specify a point in the map and a proposed number of listings around that point, and the model will predict the expected price deviation by square meter. This will be a dynamic layer as the user can specify the output.
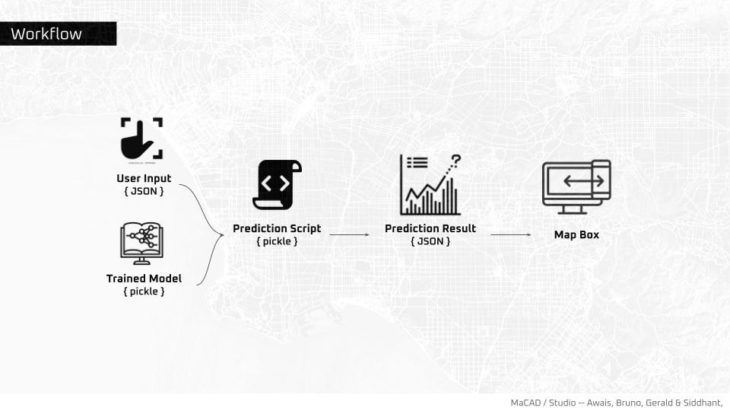
For the static layer, we generated a heatmap of price deviation using the existing property dataset. This static layer would enable the user to quickly identify hotspots in the city where the price deviation would be more than usual.
These layers will be deployed to Mapbox as part of the more significant city project. You can visit the link here:
http://aia22.iaac.net:8080/
Who benefits?
We believe this tool will help lawmakers legislate around Airbnb to protect the city user, helping them find good properties around the city without having to pay a stratospheric amount of money due to the Airbnb listings making more money.
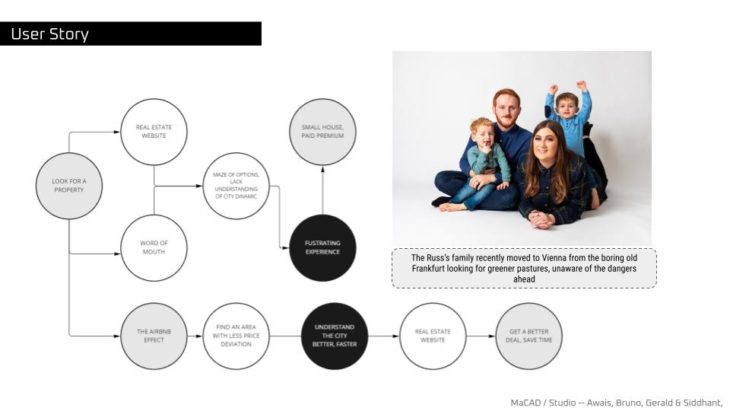
User story
Let’s say Russ’s family is moving to Austria from Frankfurt in search of greener pastures. They are looking for a property to stay in, but they have no idea if they are paying a fair price or not. They have two ways of doing this:
+Usual way by asking a real estate agent for assistance and trusting their capabilities, or
+Using our Airbnb Effect model, the family can quickly identify which areas are most affected by a price increase and narrow the search for properties outside of these areas. They can also predict what will happen to their property with regards to having more or fewer listings around their house.
Conclusions
Like any shared economy gig, Airbnb is a new reality that is here to stay and requires attention. However, it’s not necessarily good or bad, its needs regulation to protect the interests of the city and its urban development.
For example, it’s not in the government’s best interest to have deserted areas in the city at specific points of the calendar year because there are no tourists. In contrast, the primary users of the city have to travel long distances to get to work and back home.
We believe the Airbnb Effect website will be a good tool for assisting regulation.
Credits
The Airbnb effect is a project of IAAC, Institute of Advanced Architecture of Catalonia, developed at Master In Advanced Computation For Architecture & Design in 2021/2022 by students: Siddhant Choudary, Mansoor Awais, Gerald Mandevhana and Bruno Martorelli. Faculty: Angelos Chronis, Faculty assistant: Aleksander Jastrzebska, Serjoscha Duering and Nariddh Khean