TS.2C – Tool Seminar
Interaction Tools
Programming for Interaction
Faculty: David Dalmazzo
OVERVIEW
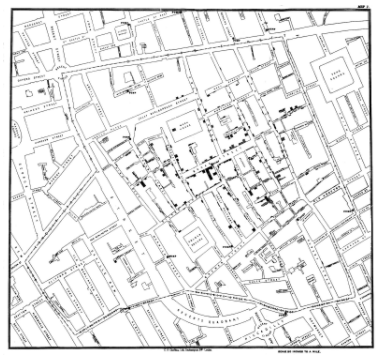
Visualizing Data is truly an art. Converting tables of quantitative data into visual information that can communicate complex dynamics has a long history. Dr. John Snow (not to be confused with the GoT character) utilized data visualization to understand the nature of a Cholera outbreak in Soho, London at a time when it was believed Cholera spread through ‘foul’ or polluted air. By mapping the location of Cholera deaths in the area, Dr. Snow was able to make an educated guess and pinpoint the outbreak to a water well in the area.
 There are many other examples of useful Data Visualization.
The Programming Module serves to add a layer of connectivity and interface to the term projects through the use of the Processing programming environment. The module will focus on how to work with external data sources as a means to learn about constructing and manipulating data structures which can form the basis for visualizations and experiences.
BRIEF: Data Experience
Data Visualization often serves our visual spectrum. Can we take Data Visualization to another level and allow people to experience data?
