Subway Cities
Subway Cities is an urban analysis of the subway network.
Case Study Cities
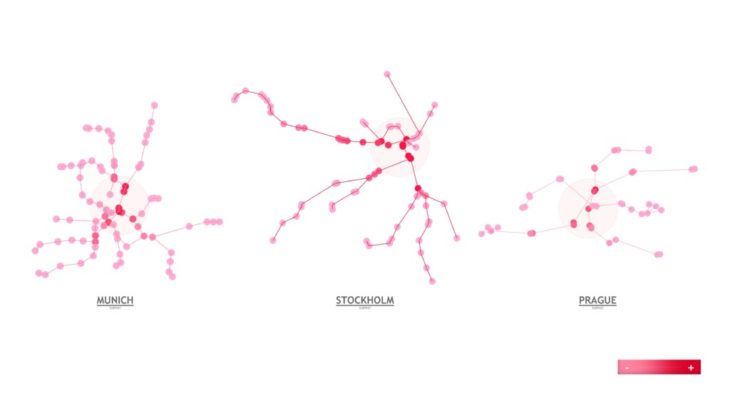
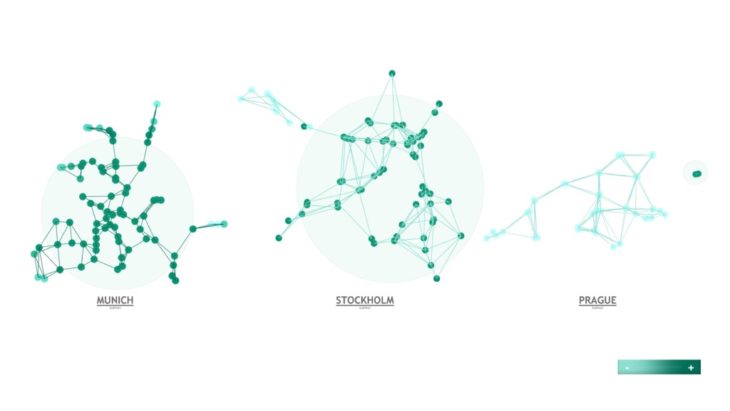
In this project, we investigate the subway networks of 3 case study cities: Munich, Stockholm and Prague.
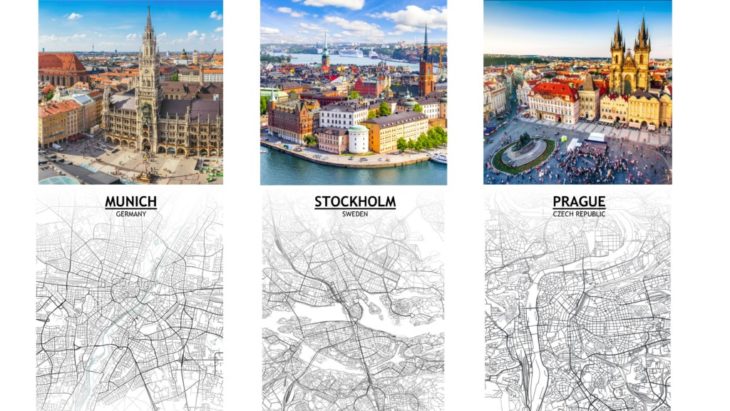
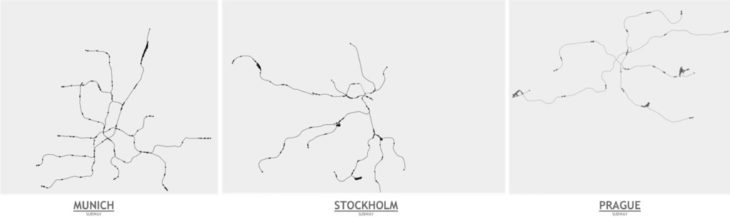
Subway Maps
We often hear citizens complain about how the subway network in their cities could be better. We wanted to challenge that theory by asking our classmates and ourselves to redraw the subway connections to propose better connectivity.

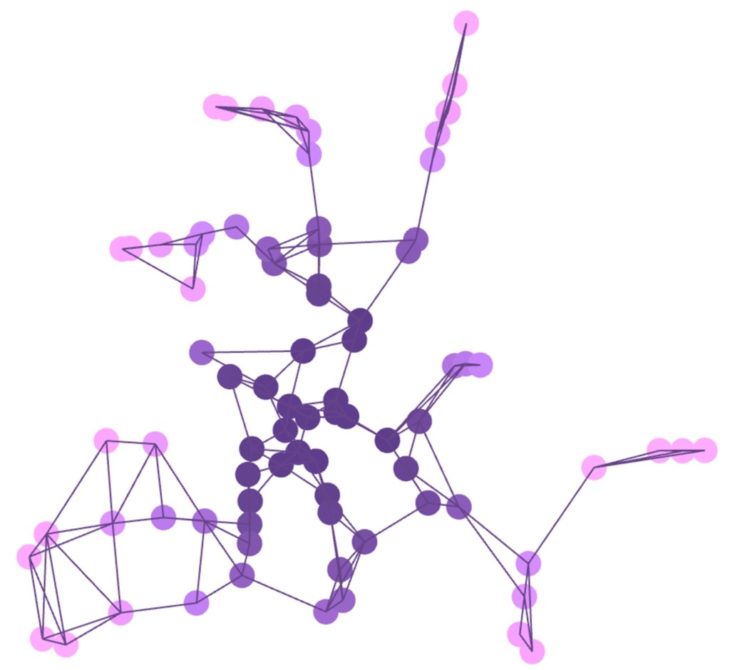
Subway Graphs
These networks can be obtained from OSMnx as graphs consisting of nodes and edges. The objective of this project is to analyze and compare these networks.
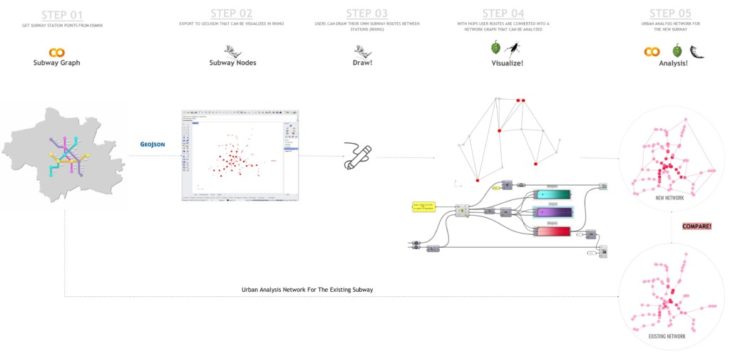
Methodology
The workflow for the project is as follows:
- We first Get subway station points from OSMnx
- Next we export the points to GeoJSON which can be visualized and baked in rhino
- This is where we can imagine our own subway routes between stations and draw them in rhino
- Using hops, the new routes are converted into a network graph that can be analyzed
Lastly, we compare the Urban Analysis of The Existing Subway with the proposed subway Networks.
Graph Theory
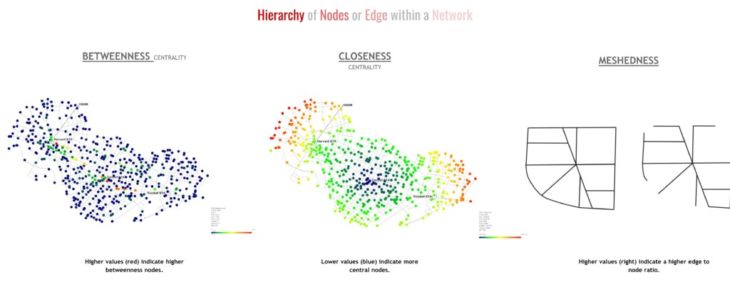
The features used to analyze the graphs are betweenness centrality, closeness centrality and meshedness.
The Betweenness Index is the total number of shortest paths at the target location divided by the total number of shortest paths that exist between two nodes of a given radius.
The Closeness Index indicates how close an origin is to all other destinations in a given radius. It is calculated as the average of the shortest path length from the node to every other node in a given radius.
Meshedness measures the edge to node ratio, which divides the total number of edges by the total number of nodes.
source: Centrality Analysis
Results
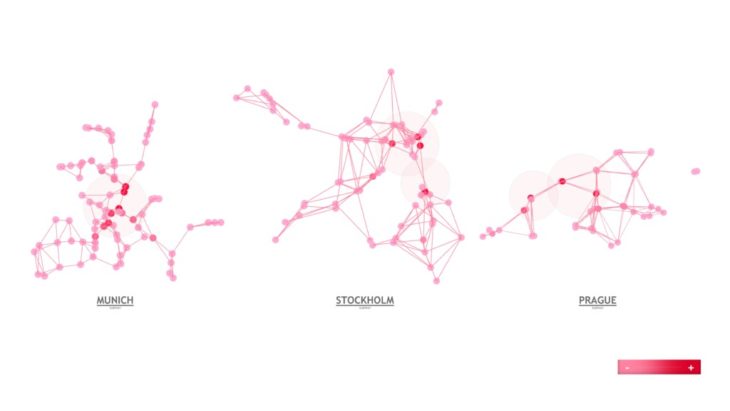
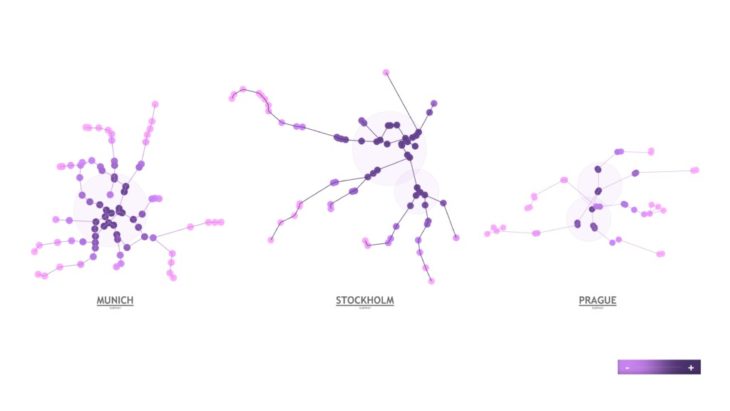
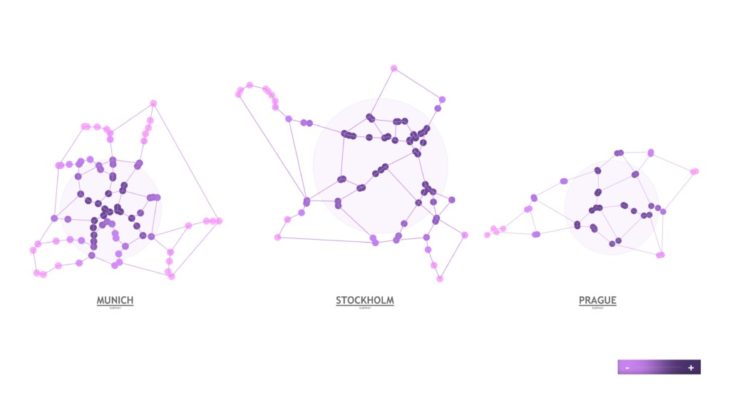
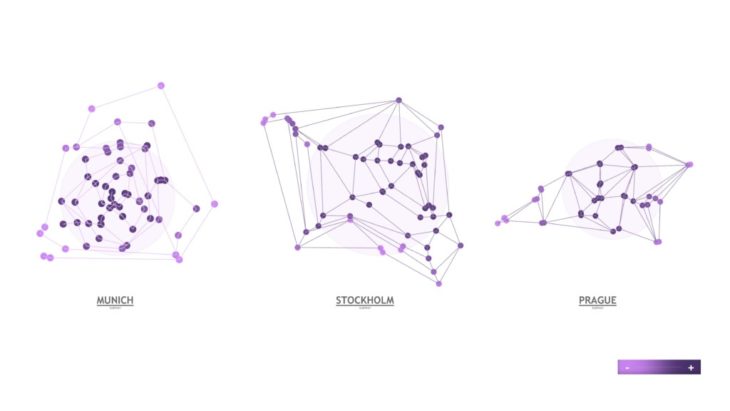
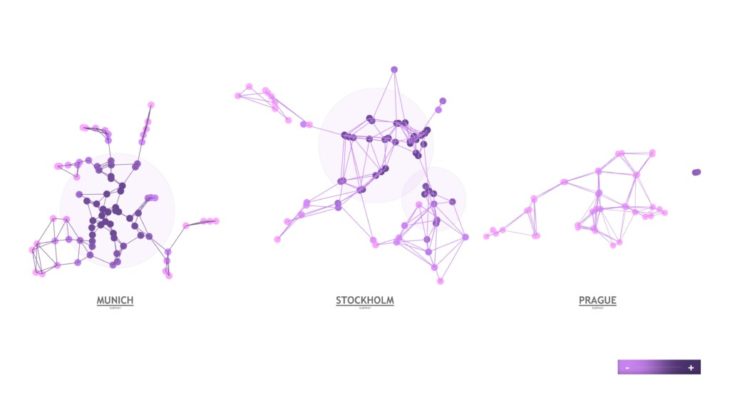
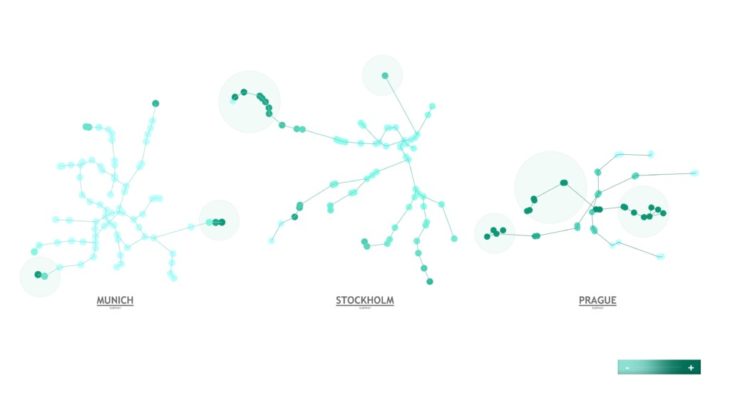
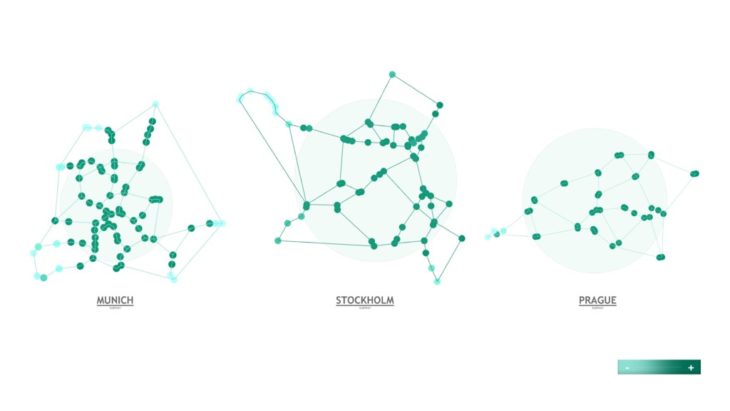
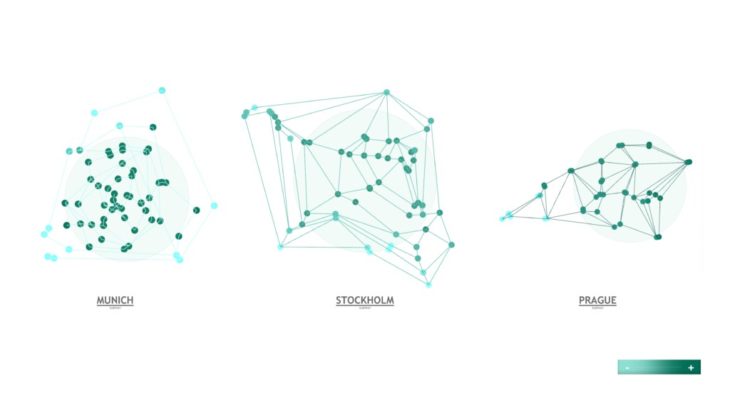
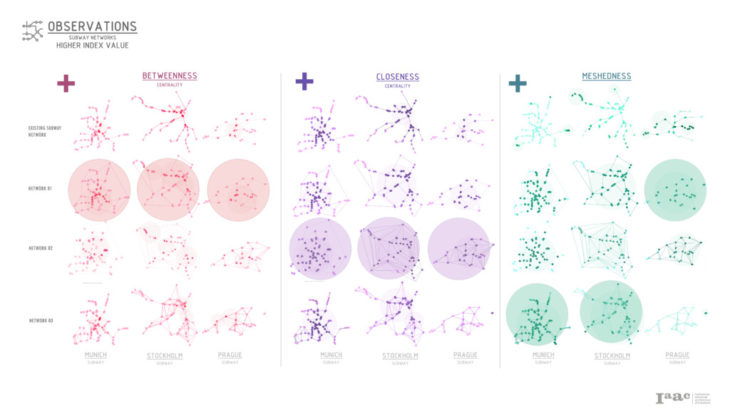
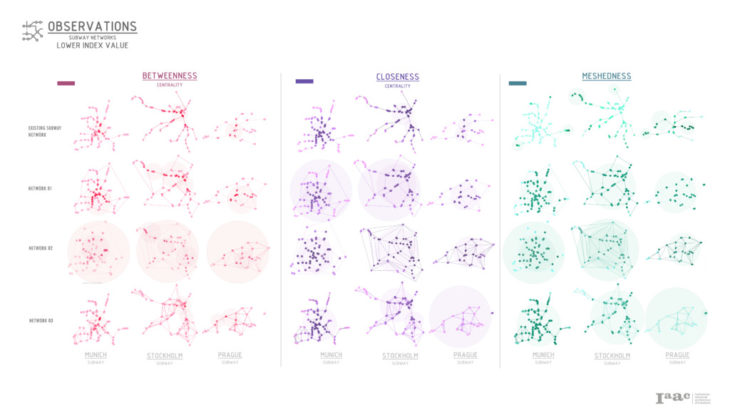
The images below show the results of the analysis.
BETWEENNESS CENTRALITY | EXISTING SUBWAY NETWORK
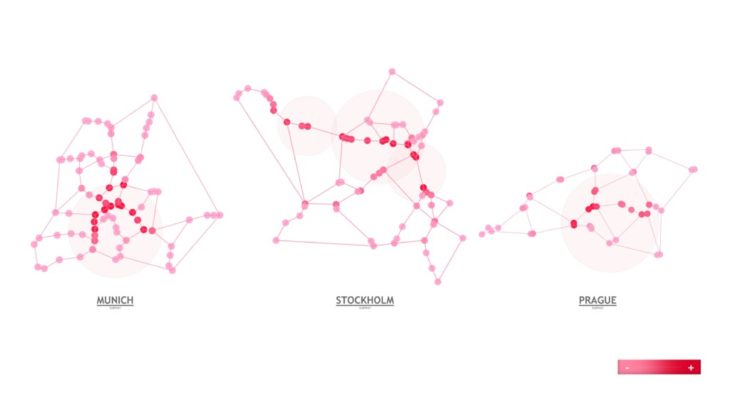
BETWEENNESS CENTRALITY | SUBWAY NETWORK 01
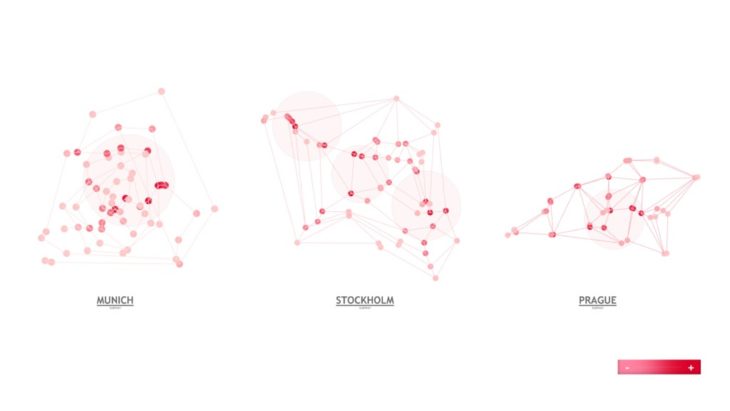
BETWEENNESS CENTRALITY | SUBWAY NETWORK 02
BETWEENNESS CENTRALITY | SUBWAY NETWORK 03
CLOSENESS CENTRALITY | EXISTING SUBWAY NETWORK
CLOSENESS CENTRALITY | SUBWAY NETWORK 01
CLOSENESS CENTRALITY | SUBWAY NETWORK 02
CLOSENESS CENTRALITY | SUBWAY NETWORK 03
MESHEDNESS | EXISTING SUBWAY NETWORK
MESHEDNESS | SUBWAY NETWORK 01
MESHEDNESS | SUBWAY NETWORK 02
MESHEDNESS | SUBWAY NETWORK 03
Observations
Looking at all the graphs we can make some observations about how the proposed networks compare to the existing network.
On average, we can see that the betweenness and closeness features are slightly higher in the proposed networks than in the existing network, while the meshedness is a lot higher.
Network 1 has the highest betweenness score, network 2 has the highest closeness score and network 3 has the highest meshedness.
Observing the lower index values, we can see that Network 2 has the lowest betweenness score and meshedness, and network 1 has the lowest closeness score. The original networks have many dead ends and it’s clear that most of the lines converge to a central area, whereas the drawn maps do not display such a distinct central area.
Conclusions
- The original networks have many dead ends with clear convergences to a central area, whereas the drawn maps do not display such a distinct central area.
- Networks with the longest total length of routes were not always the best
- Networks with radial “spider web” like patterns performed the best
Credits
Subway Cities is a project of IAAC, Institute for Advanced Architecture of Catalonia developed at Master in Advanced Computation for Architecture & Design in 2021/22 by
Students: Sophie Moore, Jumana Hamdani, Amanda Gioia
Faculty: David Leon, Dai Kandil