Does tourism affect socio-spatial interaction within a city?
For this, we must first understand socio-economic and spatial-temporal structure of the city.
We have started benchmarking cities as a starting point. The chosen situs slot gacor cities are London, Singapore, Hong Kong, Athens, Quebec and Barcelona.
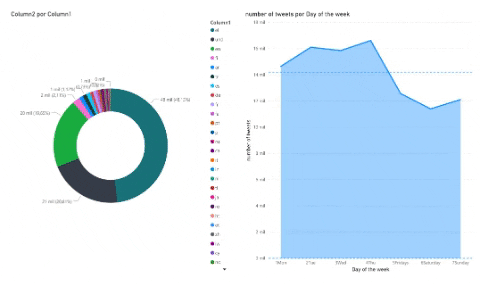
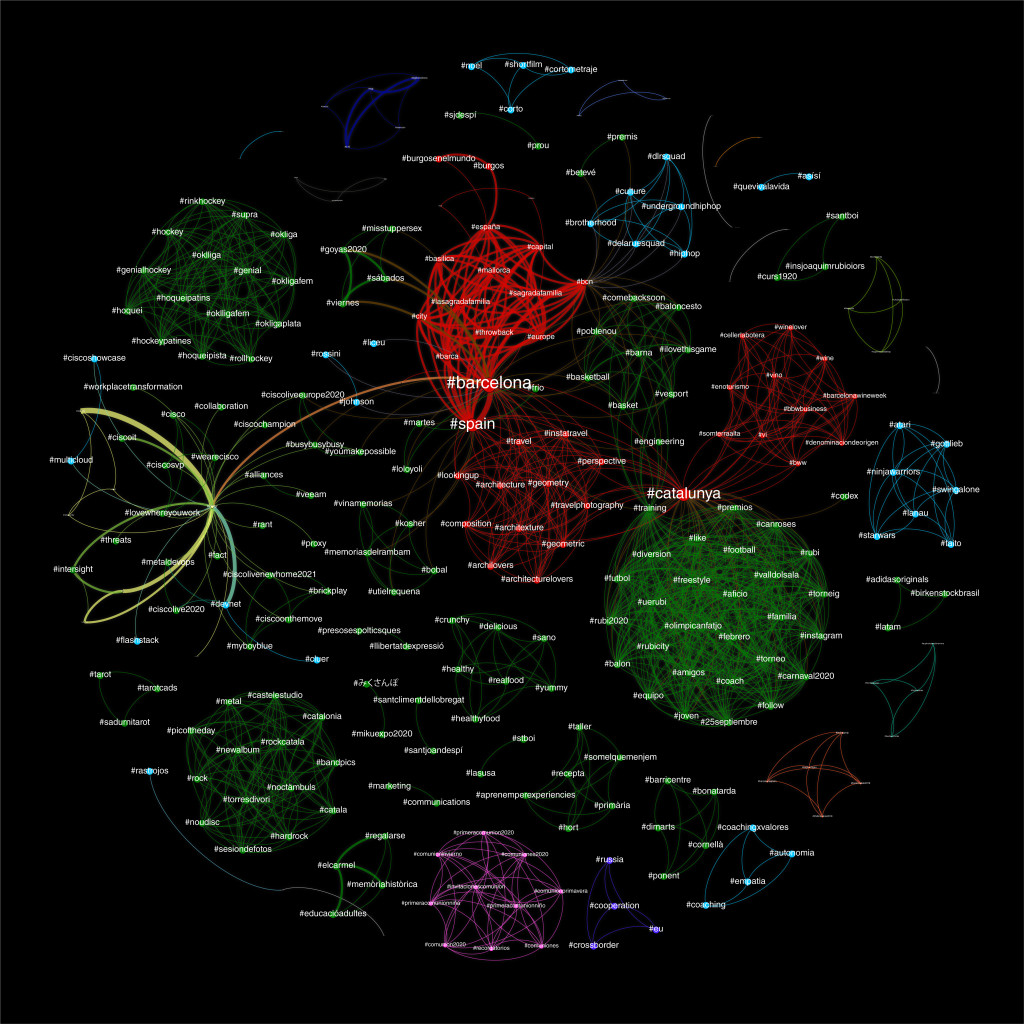
Tweets statistics per city
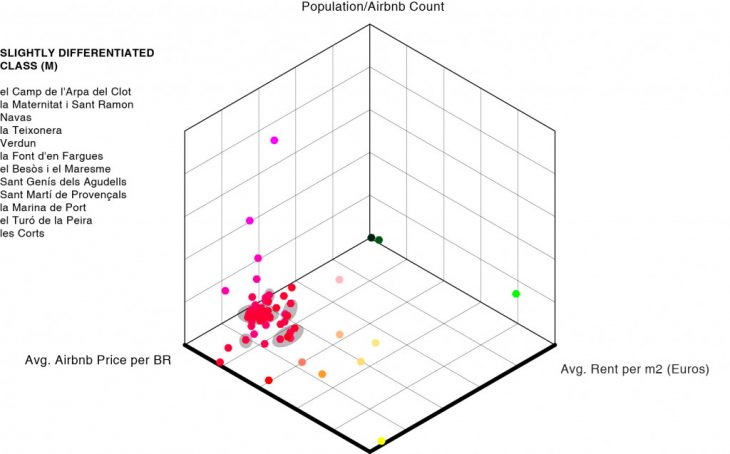
As a way to evaluate the socio-economic status slot77 and intractability of tourists with locals, we evaluated each Barcelona neighborhood on a three dimensional graph. The x direction being the average residential rent per meter squared, the y direction noting the average airbnb price per bedroom, and the z direction representing the density of tourists (population/listing).
Plotting each neighborhood on this graph allowed us to cluster neighborhoods based off the difference in class between tourists and the difference in space. From the data, we created 9 different groups. Using the 25% and 75% quartiles as dividers we created three different groups for each indicator (class and space).
Then we mapped these groups in order to spatially realize where they reside, and where the friction points between them lie. These profiles allow us to ascertain the neighborhoods on a space vs. class level, giving the basis for evaluating the segregation on a time basis from the twitter analysis. Further development of this profiling calculation could be achieved by factoring in more social and cultural factors to the neighborhoods.
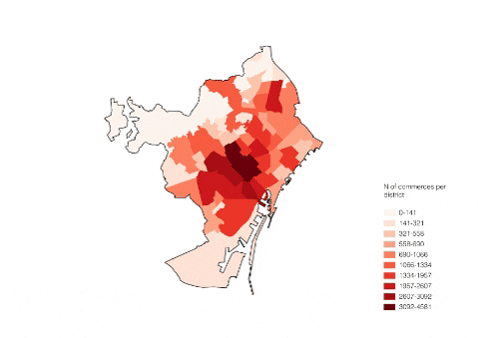
Barcelona parameters of study
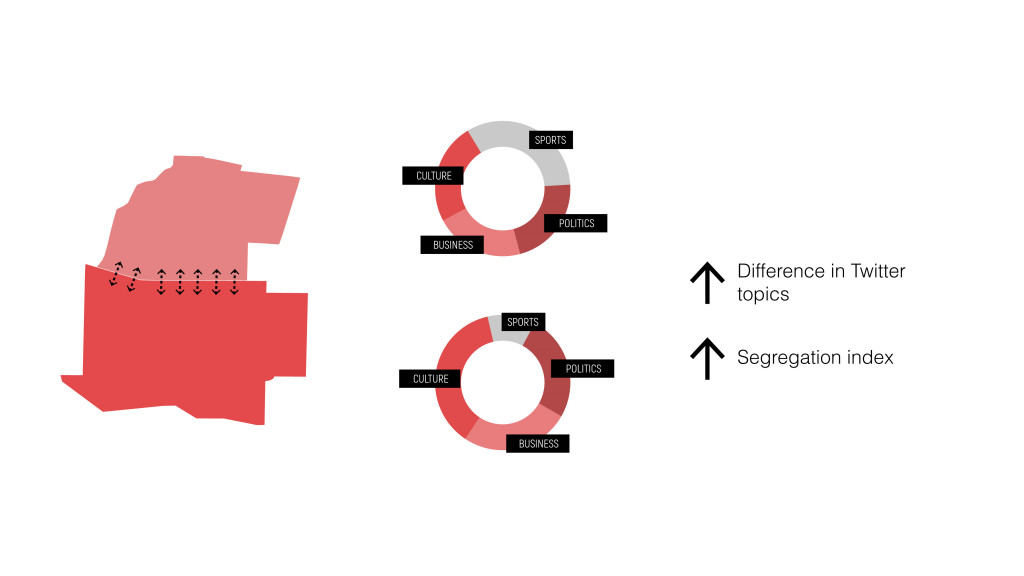

In this studio we want to explore the relationship between Twitter user’s activities patterns and the demograhpic characteristics of the neighborhoods in which they reside or trasverse.
Are the spatial mobility patterns of Twitter users and their tweets similar to the patterns of physical segregation (along the lines of race, income and education)?
Are Twitter user’s friends network related to the demographic characteristics of the neighborhoods in which they reside?