Social Nodes – Understanding a process of data analysis
The Concept Behind the Data
Throughout the Master in City & Technology, we have been introduced to multiple approaches of big data collection, new digital tools and innovative data analysis, in order to obtain answers and knowledge about the city. However, one thing remains a priority: the why. What is the final output and goal of a certain data analysis? What is it trying to conclude or inform, and how is this relevant to the subsequent proposal? A structured concept and methodology is the first key step and cornerstone of data analysis.
In order to represent the entire process from the concept up until the output, we have decided to present a research we have been developing along the 3rd term “Social Nodes” combined with other findings and personal evolution throughout the learning process of data analysis at Iaac.
Social Nodes is a part of a multidisciplinary research on the role of urban space in providing sociability, using Poblenou as an example. For this specific study, our goal was to analyze people’s movement, focusing on their stops instead of their trajectories, in order to understand the existing points of social interaction within the district and which are their typologies.
Sociability in the urban space
It is encapsulated within our species to live in groups, developing instincts of sociability and cooperation. People assemble and they need a physical place to do so. Throughout history, the public space has always played a key role in the social life of citizens. It served as a gathering space, seasonal and rotational markets, cultural festivities and many more. However, the city as a whole works as a canvas for social happenings, as different private land uses also attract users for long periods of time and lead them to interact in different ways.
Cities have become the physical integration of human and non-human systems, and the full impact of one on the other is still unknown. The influence of the built environment into people’s behavior is still an on-going research. But one clear conclusion is how people usually move within the city for a purpose, be it for work, study, a specific need or leisure, and that often includes a built environment as a destination. Our analysis is focused on these destinations as a way to assess the nodes of social interaction of Poblenou.
Data Collection
The data collection process is one of the most important steps in our analysis, as ensuring the quality of data retrieved is key to the success of any analysis process. The majority of the data we collected and used throughout our research and analysis into sociability is open source data from the official Barcelona geodata portal.
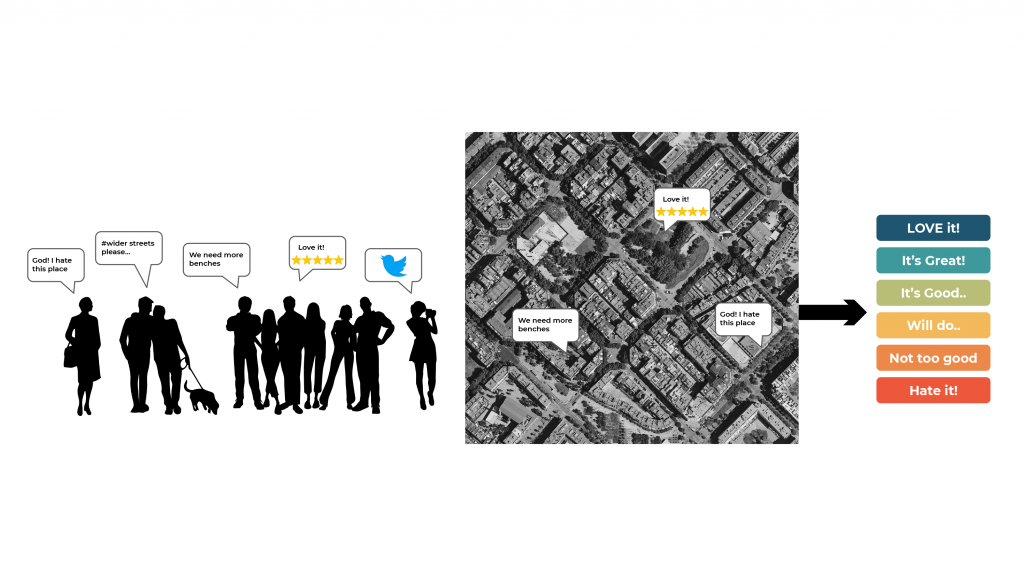
In some cases we collected the data ourselves from social media websites such as instagram and twitter. The social media data helped us generate perceptual analysis of public space in order to identify the most popular spots in Poblenou.
Digital Tools and Methods
To analyze obtained data layers, generally python was used for data filtering, sorting and generation of different graphs for understanding the information. This helped us sort through very large data sets which would’ve been an exhaustive process if done manually. QGIS was frequently used for visualization of geographic data (shapefiles and large CSVs) and map generation.
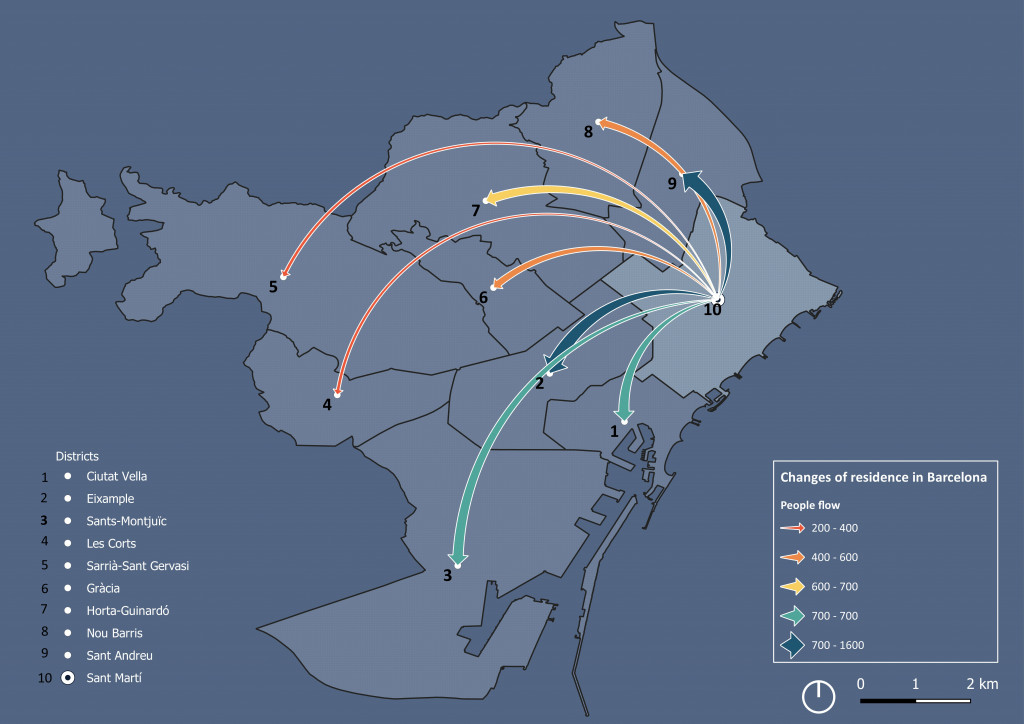
From representing data in multiple types of graphs and plots, to visualizing it in a spatial format, we have applied multiple methodologies to better understand the information we were collecting. One other example from this term was the analysis of flows in different formats, such as in sankey diagrams or spatial distributions, for which we analyzed the changes of residence of people from Poblenou in Barcelona, our case study for Studio.
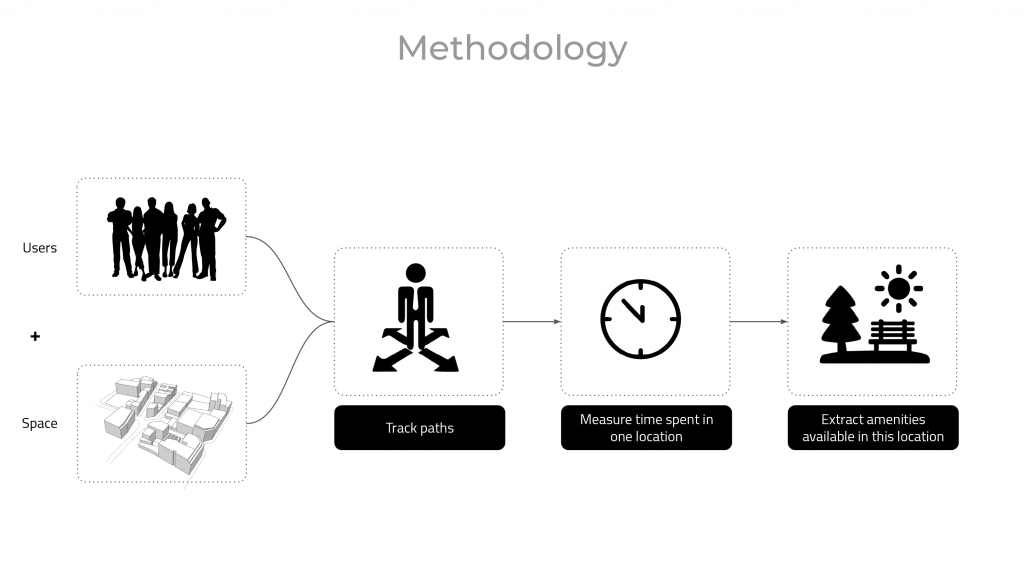
Footfall data and trajectory of people
For the case of Social Nodes analysis, we took the Footfall dataset for Spain. It consists of geolocated unique IDs, via WIFI or Mobile internet for 7 days between November 18th to 24th, 2019. While in the previous term, the same dataset was used with GeoPandas, Kepler and MovingPandas, in order to simply visualize the dataset and understand more the mobility in Barcelona, in this term, the analysis went deeper and focused on the sociability aspect of people’s movement and stops.
We firstly used QGIS to select the Footfall dataset locations that were inside the Poblenou area, our case study. From that, we used Python to filter the clipped file, isolating only the IDs that appeared in all 7 days, which are the people who were consistently tracked throughout the entire week. Each ID’s longitude and latitude were extracted in Python, as well as their timestamp. For framing the analysis, we used Groupby based on these ID’s information, adding a new column of time difference between the maximum and minimum timestamp per ID in each location.
Tracking movements and stops
The next step was tracking people’s movement pattern using MovingPandas, a Python repository which implements Trajectory class and corresponding methods based on GeoPandas. For this specific analysis, we used the Stop Detection code, extracting their destinations and the time spent in each of them, classifying stops between 5 minutes and 6 hours as moments of potential social interaction.
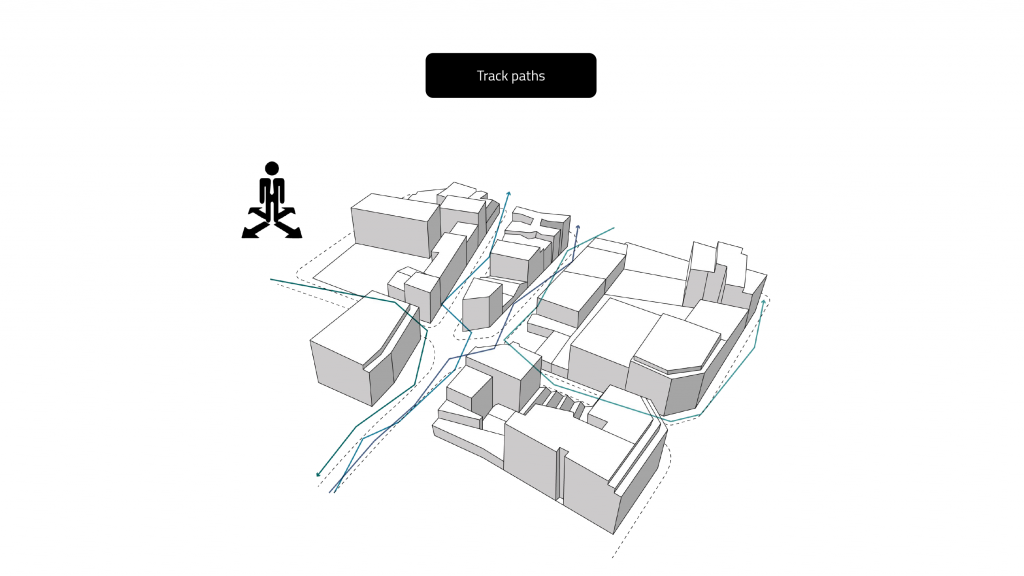
We plotted this information in a map for each individual ID, showing each person’s movement and stops, and a graph of the percentage of time spent on different locations. Then, we clustered the average time spent in stops to understand the bigger picture.
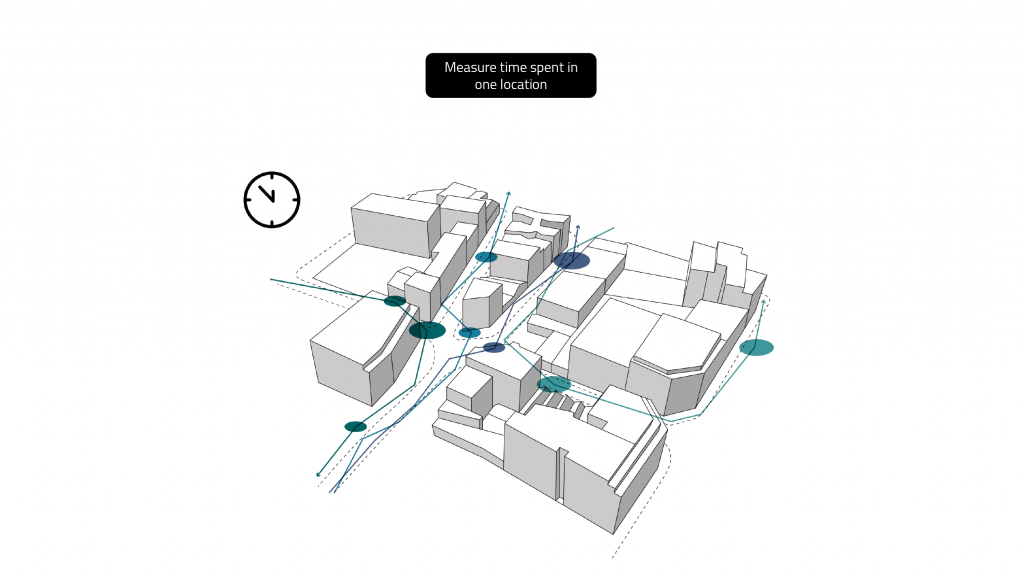
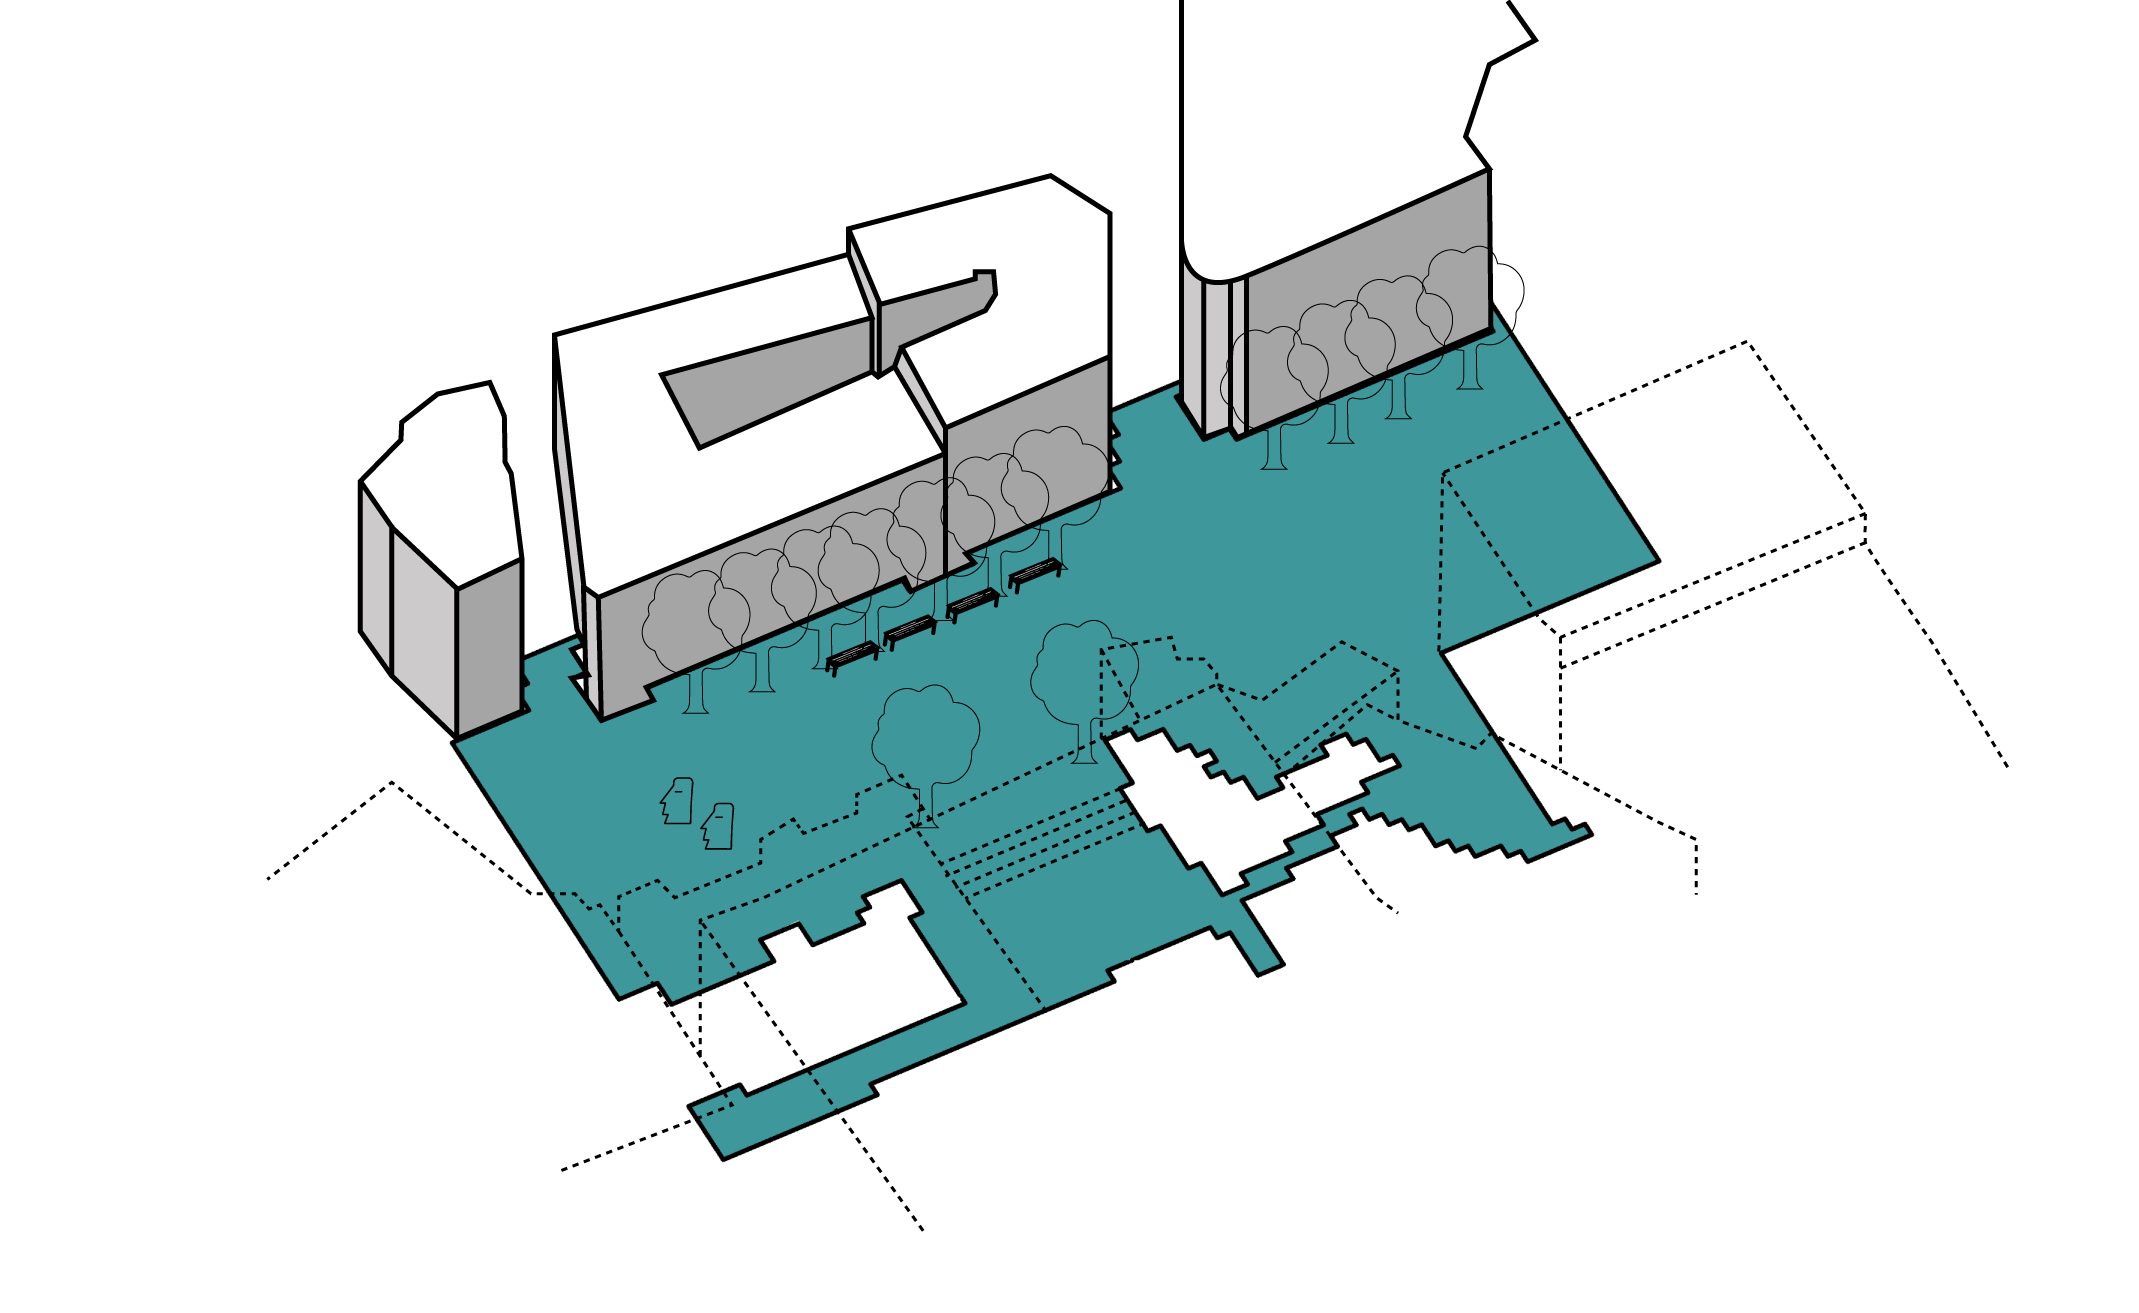
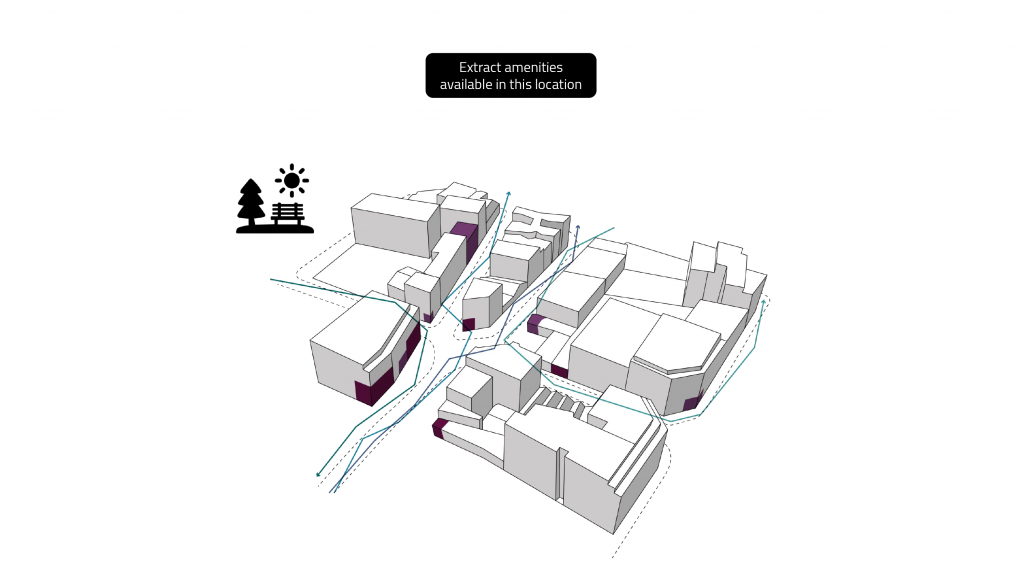
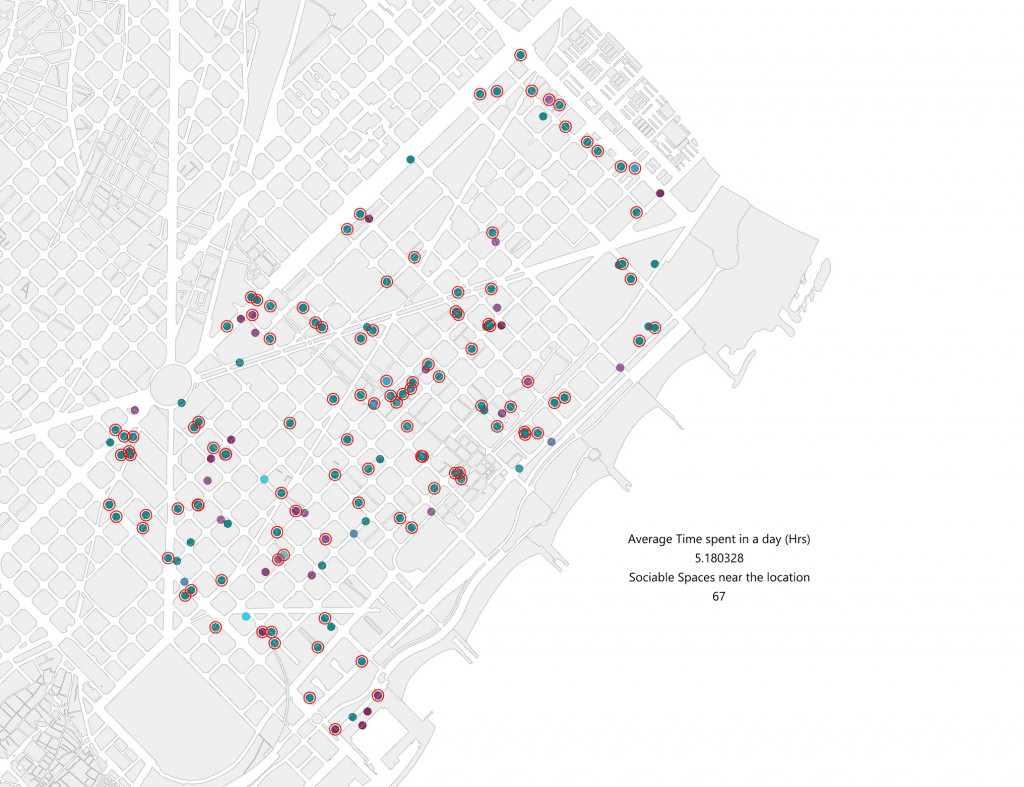
After analyzing each users’ patterns, we overlapped all of them in order to look deeper into their stops. Using shapefile datasets of public spaces and sociable amenities from OpenStreetMap, we were able to identify in Grasshopper which of these places the people were stopping. The goal was to identify where the maximum sociable spaces were for all the IDs, which represents the main gathering spots of Poblenou, as well as identify the average time spent there.
From this analysis, we are able to conclude the most social spaces of Poblenou, and therefore, utilize this information to identify which physical elements these areas have that lead people to socially interact there. This would provide us with a benchmark of elements other areas in the city must also have in order to make them more sociable.
This methodology applies different tools in order to reach the end goal, and represents our evolution in the field of data analysis and representation. It is a mix of Pycharm for preparing data, Jupyter Notebooks for identifying trajectories and stops, QGIS for conversion and clipping of files, and lastly Grasshopper for identifying times and for spatially locating the data.
Outputs
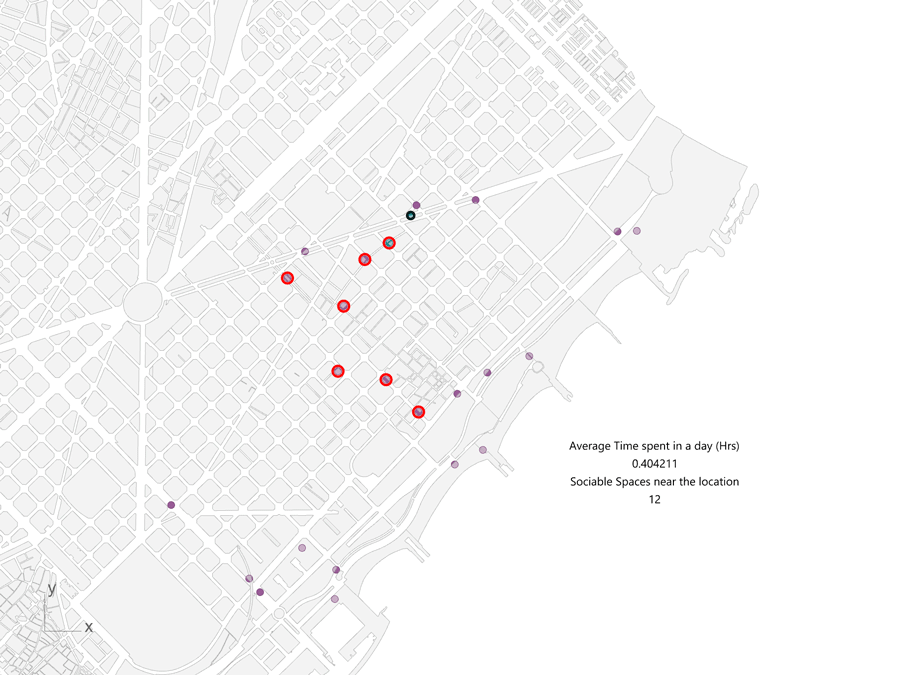
In the animation above we can see the places where different ID (Persons) stop over the period of 7 days. We also identify the number of “Sociable spaces” available in that location such as restaurants, bars, parks or public spaces. This gives us an indication of the possibility of social activities in these locations.
We finally combine all users into one map which we call the sociability map. This helps us define hot spots of possible social interaction and the facilities available in these locations in order to assist our research and proposals for strategies to increase sociability of spaces.
Social Nodes is a project of IAAC, Institute for Advanced Architecture of Catalonia developed at Master in City & Technology in 2020/21 by students: Laura Guimarães, Kevin Aragon, Inigo Esteban Marina, Sridhar Subramani and Leyla Saadi and faculty: Diego Pajarito