Introduction
Crowdsourcing data collection has become a trend over the last few years. Starting with Wikipedia and arriving at geospatial ones like OpenStreetMap which offer users resources that they weren’t able to have before.
According to some articles this has been in large part to:
- The ability to recruit large samples
- The inexpensiveness of data collection
- The speed of data collection
- Evidence that the data collected are, for the most part, of equal or better quality to that collected in undergraduate research pools.
This brings us endless opportunities in several fields. Data Driven Decision making is growing and increases the opportunities for citizens to be empowered. The collaborative voice of the people now has a real impact on real decisions.
This is especially true when we talk about geolocated data and satellite information.
Methods, Data and key concepts
As a collaborative exercise we were asked to extract some data regarding different proposed topics and create a crowdsourced presentation. The topics were the followings:
- OSM + overpass turbo, Twitter + Pyqgis
- Mobility data related to the Covid19 pandemic
- Contagion and deaths data related from the Covid19 pandemic
- Data from moving objects
- Open areas and public spaces from cadastral information (buildings, parcels, block, streets)
A couple of questions were presented to be addressed:
- How feasible is this type of data to support the analysis? How representative of an urban feature is?
- How is this quick analysis related to Urban Design?
From all of these platforms we could see how available data can be used. Something interesting to mention is the boom of data generated by the Covid19 pandemic has forced us to use collaborative tools and store data in a comparable way to be able to tackle the issue.
It is important to note that crowdsourcing data encompasses all levels of scale and legitimacy. Wikipedia is perhaps the largest, most successful example of crowdsourced information but someone conducting a survey in their office is also an example.
Spatio-temporal analysis
Another very relevant part of crowdsourcing data is the parameter of time. Cities and technologies are changing fast, it does not make sense to analyse static elements anymore. We need dynamism and to consider the variable of time in our analysis.
We can see how tools like Google Earth offer the possibility to go back in time to see the transformation of certain areas of the cities through satellite imagery. Or again coming back to the pandemic, the huge transformation in mobility that our cities have experienced.
Time is crucial in understanding the propagation of the virus. However, this might bring with it a lot of controversial issues of privacy and data ownership because of the detail of the data being collected.
Principal outcomes
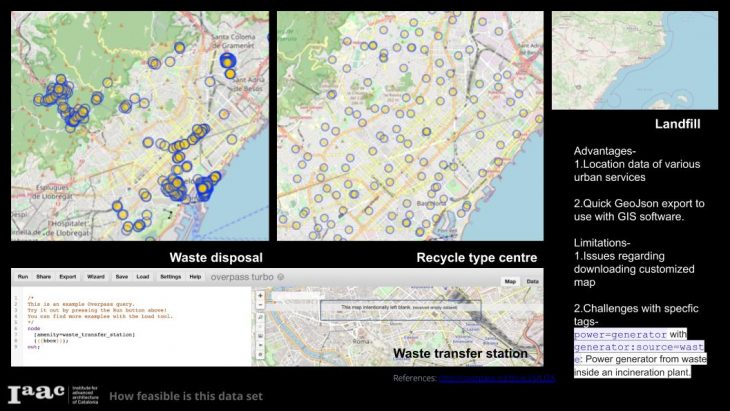
Slide 4 of the collaborative presentation by the class
OSM + overpass turbo, Twitter + Pyqgis. The first group carried a quick study on the waste management system in Barcelona. This could be a useful process to rapidly understand different amenities within the city or export them to perform a more detailed analysis. The limitations this method might have could be related to how trustable the information in OpenStreetMaps is and in some cases the limitations when the query contains too many elements.
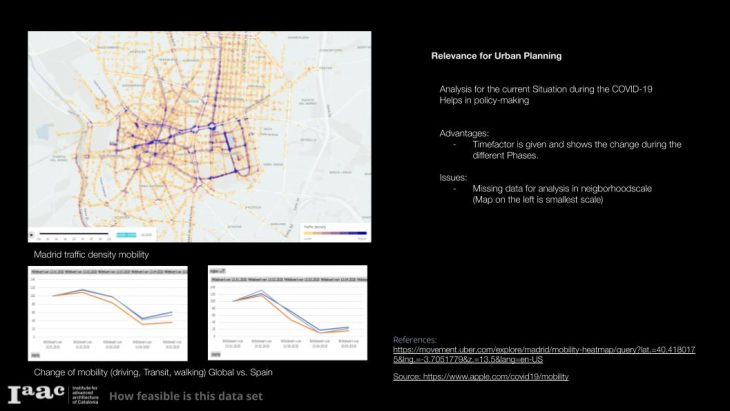
Slide 7 of the collaborative presentation by the class
Mobility data related to the Covid19 pandemic. Tools such as Ubber and Apple movement data could help decision makers to understand better the flows of the city in real time. Or in cases like Covid to understand the changes within the population movement. This is a very powerful tool however it lacks data of a lot of cities and it cannot be downloaded to perform further analysis.
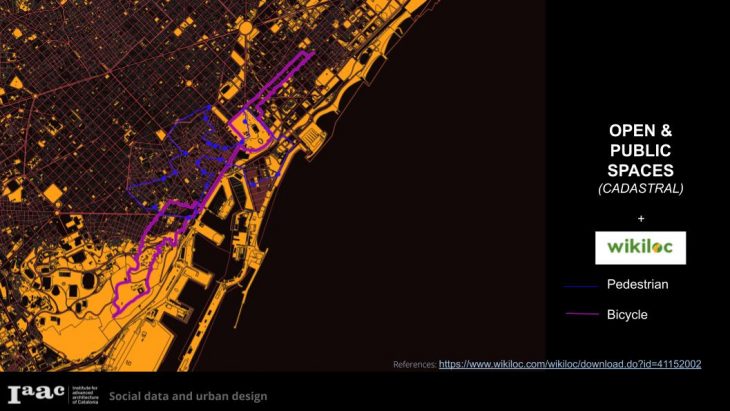
Slide 23 of the collaborative presentation by the class
Open areas and public spaces from cadastral information (buildings, parcels, blocks, streets) and Data from moving objects. What if we combine cadastral information data coming from people moving around? This could give us an interesting point of view on how people use the space and how planning policies could be redesigned with a better understanding of people flows.
To discover more about the Crowdsource presentation that it was developed during the class you can take a look on the following:
*at one point, a question is raised about why Logarithmic graphs are used to represent Covid numbers. Here is a video that explains this well:
Survey
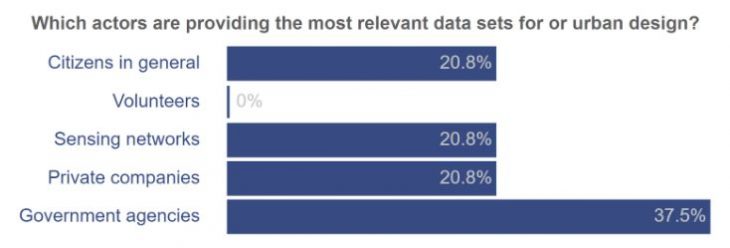
Q1
Although the Data coming from citizens and sensing networks is becoming more available we can see that Government agencies are providing more of the data according to students
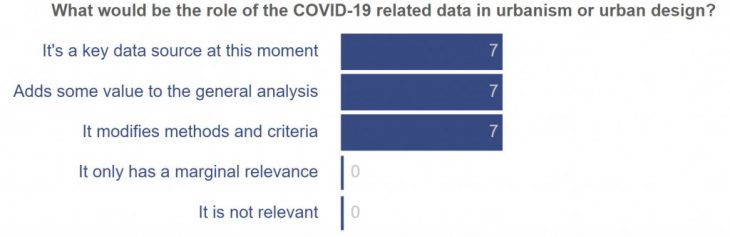
Q2
Referring to COVID-19, we feel that data is a very relevant source at the moment and/or it modifies the way we approach urban design.
Conclusions
Crowdsourcing data or Social Data has become and will become an indispensable source for data and decision making in the upcoming years. This will give us relevant information that government data would not be able to give us, although on the contrary we will need to be more critical when using it.
The rapidness of getting some of this data makes analytics more available for the general public and becomes an opportunity to further strengthen the concept of Smart Cities through the empowerment of the citizens.
Platforms such as Open Street Maps or Wikipedia create a direct collaboration between the citizens or a direct communication with the governance, being rapid and effective.
Reference/Bibliography
https://visualization.covid19mobility.org/?date=2020-05-10&dates=2020-04-05_2020-05-10
http://overpass-turbo.eu/s/U2A
https://www.apple.com/covid19/mobility
https://movement.uber.com/explore/madrid/mobility-heatmap/query?lat.=40.4180175&lng.=-3.7051779&z.=13.5&lang=en-US
https://cnecovid.isciii.es/covid19/#declaraci%C3%B3n-agregada
https://www.eldiario.es/economia/Espana-normalidad-movilidad-Semana-Santa_0_1020148656.html
http://aquas.gencat.cat/ca/actualitat/ultimes-dades-coronavirus/mapa-per-abs/
https://www.strava.com/heatmap
https://www.wikiloc.com/wikiloc/download.do?id=41152002
Crowdsourcing Data is a project of IaaC, Institute for Advanced Architecture of Catalonia
developed at Master in City & Technology in (2019/2020) by:
Students: Elijah Munn, Alejandro Quinto
Faculty: Diego Pajarito