ABSTRACT
The topic of simulating occupant behaviour is intrinsically linked with the theory following occupant behaviour and their interaction with the environment, although the focus of this blog will be on the simulation of all this information to create an accurate visualization of occupant behaviour within a building.
INTRODUCTION
Occupant behaviour inputs include interacting with the building in ways that affect energy use. The importance of occupant behaviour in energy studies cannot be underestimated. In a study undertaken on 248 dwellings, it was determined that occupants’ individual behaviour and response to the environment accounted for 71% of energy demand variation. (Socolow 1978)
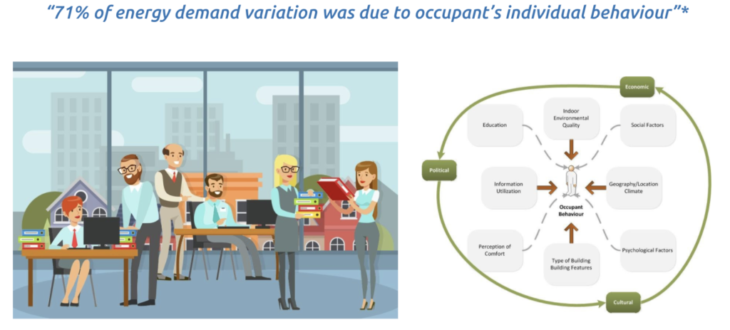
Figure 1
In the past, the over-simplification of human behaviour and interpretations through static simulations resulted in conclusions not fully indication of real-world scenarios and therefore limited in use. Through the more developed understanding of both behaviour and the implementation of stochastic methods over deterministic simulation techniques, the accuracy has increased.
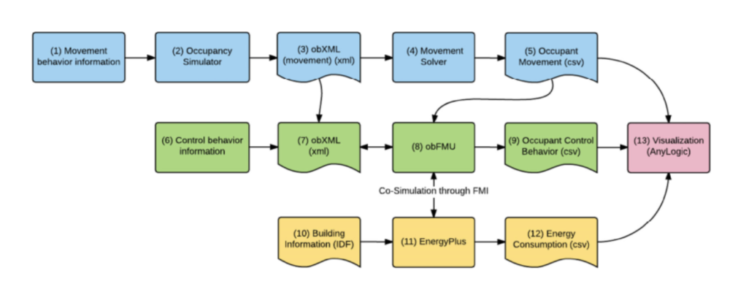
Figure 2
In the typical occupant behaviour and energy simulation, there are three stages starting from creating occupancy schedules, to modelling and analysing the occupant behaviour and their impact on the building and finally visualizing the simulation results and occupant interactions with the environment.
OCCUPANCY SIMULATION
Occupant behaviours can be grouped into 2 categories, occupancy and occupant’s interaction with building systems. Occupants have the freedom to enter and leave the building, the occupancy simulation determines the location during each time period, and is the foundation for behaviour dynamics.
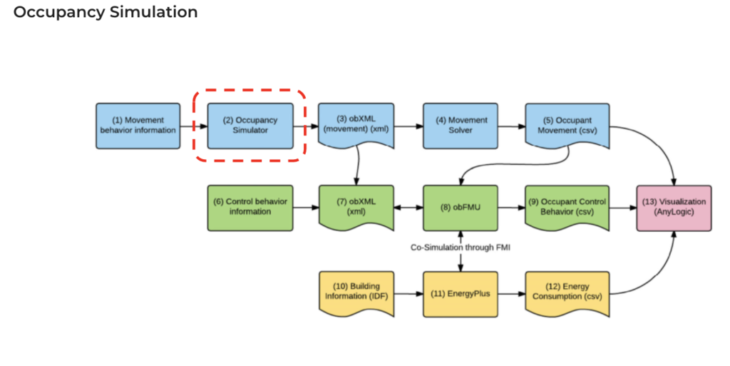
Figure 2
Typical representations of occupancy simulation are very limited and use many assumptions, creating static models that would return very similar figures and doesn’t show factors that influence real occupancy.
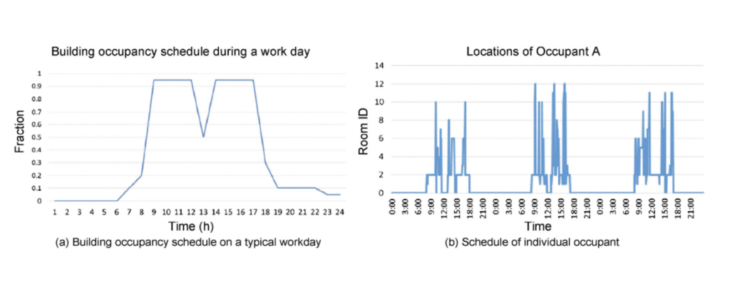
Figure 11
Therefore realistic representation of occupant schedules is required, and the new systems tend to represent the stochastic nature of human behaviour. The occupancy simulator works based on personas, with typical patterns and behaviours, similar to the graphic presented here. Applying statistical models representing human behaviour models based on occupancy roles. Therefore realistic representation of occupant schedules is required, and new systems tend to show the stochastic nature of human behaviour.

Figure 12
The occupancy simulator is a combination of different technologies created by Chen that enable a more accurate representation of occupants simulation in the building. Joining different technology he made advancements in the way we use statistical analysis with an improved user interface.
Works within the ecosystem of Energy Plus and Anylogic.
MODELLING WITH ENERGYPLUS
Once the occupancy schedules are created through profiling, and Occupant Behaviour Functional Mock-Up Unit (obFMU) is set up for the purpose of simulating. Since these datasets are stochastic in nature due to a variety of input formats (including behaviours like sitting/reading or window:open/close), simplification is enhanced with the use of EnergyPlus.
EnergyPlus is a free, open-source Energy Modelling tool developed by the U.S. Department of Energy (DOE) to compare the effect and practicality of models.
Defining Schedules in EnergyPlus
This interchange occurs to provide an interface to implement custom user scripts and via co-simulation. Co-simulation is a strategy that allows different simulation programs to run simultaneously and exchange data during simulation. obFMU can be used with co-simulation using all building simulation programs that implement FMI, preventing limitation to a single tool. Active information exchange systems increase the capability of quantifying the impact of Occupant Behaviour as well as work efficiency.
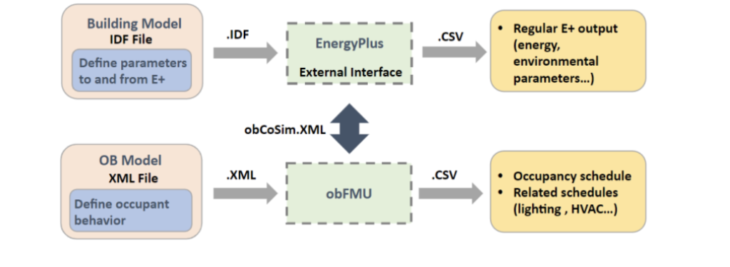
Figure b
The model can be updated as per occupant needs and preferences inferred through behaviour patterns over time or encourage behaviour modification based on sensitivity analysis.
AGENT-BASED MODELLING
The final step in the workflow is the visualisation and amalgamation of all the complex schedules, behaviours and information collected. Occupants are non-passive participants and dynamical active in all building types. Based on the systems in place for each building, the user-controllability varies and the occupants can interact with these throughout the day such as light switches, thermostats and windows. This is where agent-based modelling is used to simulate this complexity. (Chen et al. / Building Simulation/ Vol.10, No.6)
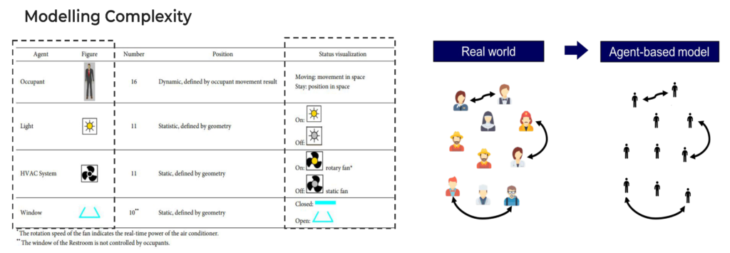
Figure 3 and 4
An agent-based model is a computational model for simulating the variable actions, interactions and directions of autonomous agents. The flux of Occupant behaviour over time complicates simulations and therefore occupancy schedules and variables need to change for each simulation step. This is accomplished through the cooperation and learning attributes acquired in previous steps to provide the essential data about the complex scenario.
The industrial applications are numerous from calculating transport logistics to evaluating responses to disaster situations.
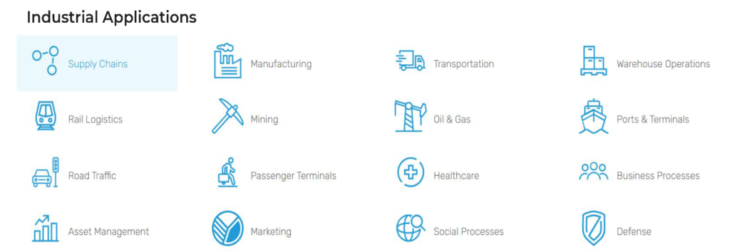
Figure 5
Traditional modelling approaches treat agents as uniform or passive entities in a process in contrast to the ABM approach which focuses on behaviour, and their interaction. Able to reflect relationships in the real world. Therefore this versatile approach is applied to so many industries. The integration of Big data made to work with agent-based modelling with States which affect/ are affected by agents, make the simulations more extensive.
VISUALISATION
There are many ABM software examples, among these AnyLogic is a very popular tool that processes all the steps previously explained enabling advanced 2D / 3D visualization and interface with external 3D or CAD software.
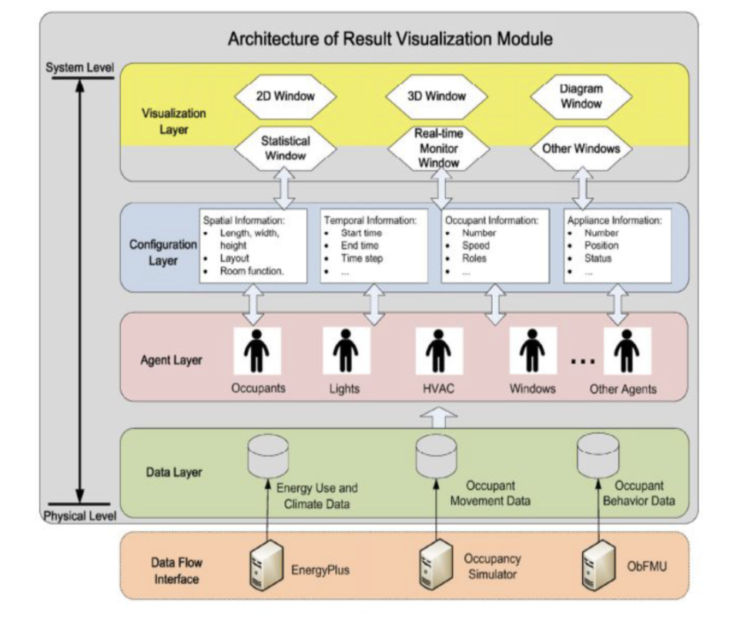
Figure 6
The visualisation module for AnyLogic works in levels from system levels to physical levels, top to bottom.
- Bottom layer: for data interaction, store and processing
- Second layer (bottom up) = agent layer
- Third layer = configuration layer
- Top layer = visualisation layer
This animation illustrates pedestrian movement in AnyLogic within a subway station with the agent configuration driving it shown below. A similar process is used to show occupants using internal building spaces and their interaction with various systems.
</p>
Figure 7
This final visualisation window shows the final interface combing 2D and 3D geometry with statistical information and charts in an office energy-related study. This type of output can then be used to assess the effect of all the occupant behaviour data input and the calculated energy levels in the scenario.
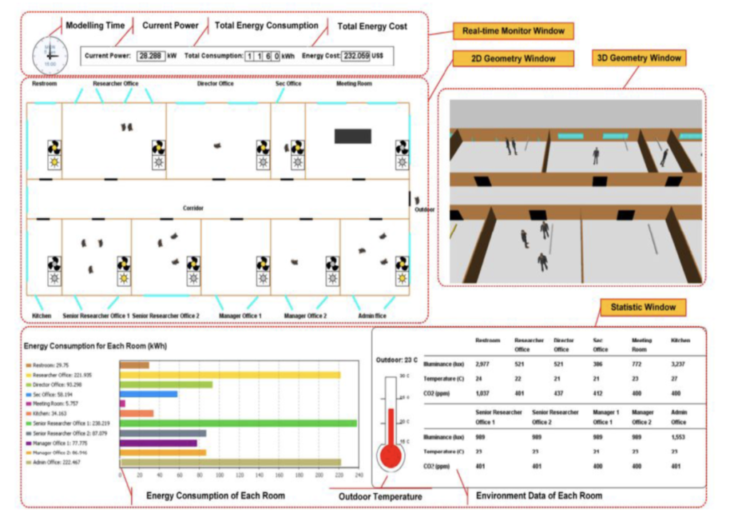
Figure 8
Looking to the future development and use of ABM, the more the simulations improve to incorporate the explained complexities and the more detailed the base information to be fed in, the more realistic real-life energy simulation models will become.
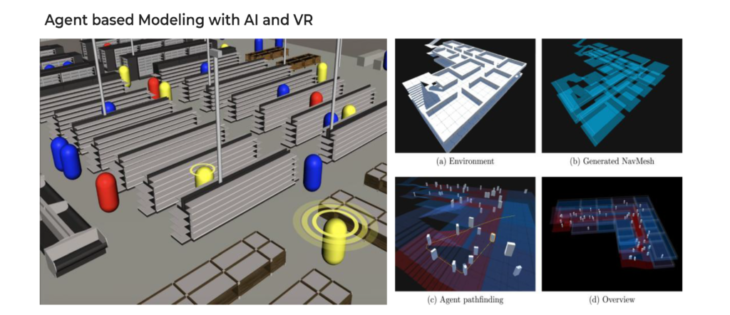
Figure 9
Ultimately the simulation comes down to decision-making whereby each agent (such as occupant) does this itself through examining its mapped situations using the relation between all agents.
The parsing of these complex behaviour patterns and rules becomes even more advanced through the development of tools such as machine learning techniques, evolutionary algorithms and neural networks. In addition, these AI-based models offer a real-time application which in relation to energy modelling allows fast and accurate feedback to inform design changes.
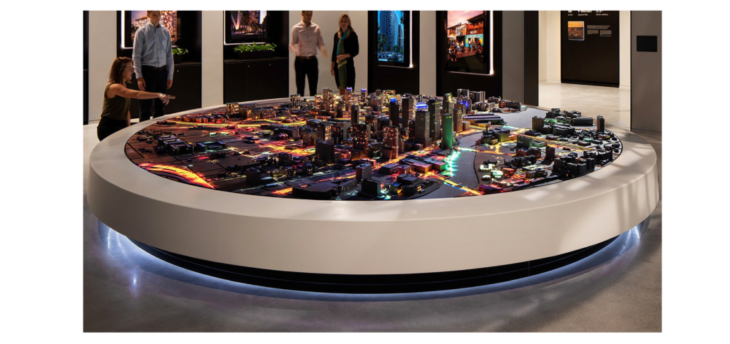
Figure 10
Through the great advancement of physical measurement tools, simulation software and XR tools, the ability to accurately digitise our environment and the occupants who use them are revolutionizing the industry. Fully Immersive systems such as digital twins and augmented reality not only allow for all this complex behaviour to be processed but to be visualised and understood in incredibly interactive ways.
References:
- “Agent-Based Simulation Modeling.” Anylogic.com, 2021, www.anylogic.com/use-of-simulation/agent-based-modeling/
- “Top 5 Significant Use Cases of Agent Based Modeling Simulation.” Synlabs.io, 2021, synlabs.io/top-5-significant-use-cases-of-agent-based-modeling-simulation/
- “Make a More Engaging Game W/ ML-Agents | Machine Learning Bots for Game Development | Reinforcement Learning | Unity.” Unity.com, 2021, unity.com/products/machine-learning-agents
- “Energy-Related Occupant Behaviour and Its Implications in Energy Use: A Chronological Review. Sustainability. 10. 2635. 10.3390/su10082635.”Tam, Vivian & Almeida, Laura & Le, Khoa. (2018).
- “Simulation and visualization of energy-related occupant behaviour in office buildings.” Chen etal. / Building Simulation / Vol. 10, No.6, Tsinghua University Press and Springer-Verlag GmbH Germany 2017
- “Humans in the Loop: incorporating Occupant Behaviour in Building Performance Simulations.” Max Gero Marschall, RMIT University, August 2020
- “Complex Adaptive Systems.” Ted Carmichael, Mirsad Hadžikadi? , Chapter 4: An Overview of Agent Based Models. 2019
- EnergyPlus
- “EBC Annex 66 Final Report – Definition and simulation of occupant behaviour in buildings”. Da Yan; Tianzhen Hong. May 2018.
Image references:
Figure 1: Tam, Vivian & Almeida, Laura & Le, Khoa. 2018,”Influential-factors-on-occupant-behaviour” Energy-Related Occupant Behaviour and Its Implications in Energy Use: A Chronological Review. Sustainability. 10. 2635. 10.3390/su10082635.
Figure 2: Chen etal, 2017 “Workflow of the simulation and visualization of occupant behavior”, Simulation and visualization of energy-related occupant behaviour in office buildings, Building Simulation / Vol. 10, No.6, Tsinghua University Press and Springer-Verlag GmbH Germany 2017
Figure 3: Chen etal, 2017 “Agents and their attributes in AnyLogic”, Simulation and visualization of energy-related occupant behaviour in office buildings, Building Simulation / Vol. 10, No.6, Tsinghua University Press and Springer-Verlag GmbH Germany 2017
Figure 4: SynergyLabs, 2021,“A_9130e3512” via “synlabs.io”
Figure b: Jiarong Xie, “A case study via the VIFI platform: Improving the predictive capacity of whole building energy models through simulation-based occupant behavior modelling with empirical data feedback”, Department of Architecture, Carnegie Mellon University
Figure 5: The AnyLogic Company, 2021, “Industrial Applications” screenshot via “anylogic.com”
Figure 6: Chen etal, 2017 “Architecture of the result visualization model”, Simulation and visualization of energy-related occupant behaviour in office buildings, Building Simulation / Vol. 10, No.6, Tsinghua University Press and Springer-Verlag GmbH Germany 2017
Figure 7: Ismail Zohdy, 2014 “Pedestrian Modeling using Agent Based Approach“ via
Figure 8: Chen etal, 2017 “The interface of the visualization model in AnyLogicl”, Simulation and visualization of energy-related occupant behaviour in office buildings, Building Simulation / Vol. 10, No.6, Tsinghua University Press and Springer-Verlag GmbH Germany 2017
Figure 9: Spp and Imerza, 2020, “Water Street Tampa _ Imerza” via imerza.com
Figure 10: Unity Technologies, 2020, “image 1-1” via unity.com
Figure 11: Chen etal, 2017 “Architecture of the result visualization model”, Simulation and visualization of energy-related occupant behaviour in office buildings, Building Simulation / Vol. 10, No.6, Tsinghua University Press and Springer-Verlag GmbH Germany 2017
Figure 12: Konrad Consulting, 2017, “image 1” via konrad.com
Credits
Simulating people is a presentation of IAAC, Institute for Advanced Architecture of Catalonia developed at Master in Advanced Computation for Architecture & Design in 2021/22 by Students: Bruno Martorelli | Maryam Deshmukh | Michal Gryko
Lead Faculty: Jane Burry