Satellite and aerial imagery
Object recognition with Reclassification & analysation with Zonal statistics
Introduction
Satellite and aerial images are one of the most potent tools to measure changes in the global surface and the weather. In general, these images have the power to give us a perspective from the Top on different scales. It is possible to detect changes in various indicators for example vegetation, soil, water, etc. and also urban areas and parameters that help to analyze cities(green area, built area, etc.)
This is the second part of a two-part session on satellite imagery. The main part of this third session concentrates on understanding the powers and limits of how to get useful information out of these images and for that, it’s important to understand how zonal statistics and Reclassification works. With Zonal statistics, it is possible to combine Satellite and aerial images with Raster-Surfaces and Vector-Areas to divide Information into units while building Indices to ease the analysis. The second part of the third session focuses on the potential of aerial images and different GIS tools such as SAGA to extract information from these images.
Methods, Data and key concepts
In the context of urban planning and urban design, the values from datasets link to certain land units like neighborhoods, city blocks, districts, or raster cells (Grid). In GIS geometrical representation of those units is usually in vector format- polygons, lines, points, or Grids for Rasterunits. With Zonal statistic Information from orthophotos, Satellite and aerial images are overlapped and divided into Vector-areas or Raster cells to get Values for each unit and make it easier to analyze them and understand spatial relationships (distance, cluster). For Example, we can analyze which neighborhood has the highest amount of change in the green area in Barcelona. In some cases, zonal statistics show some results better in charts to identify differences between units (ex. neighborhoods).
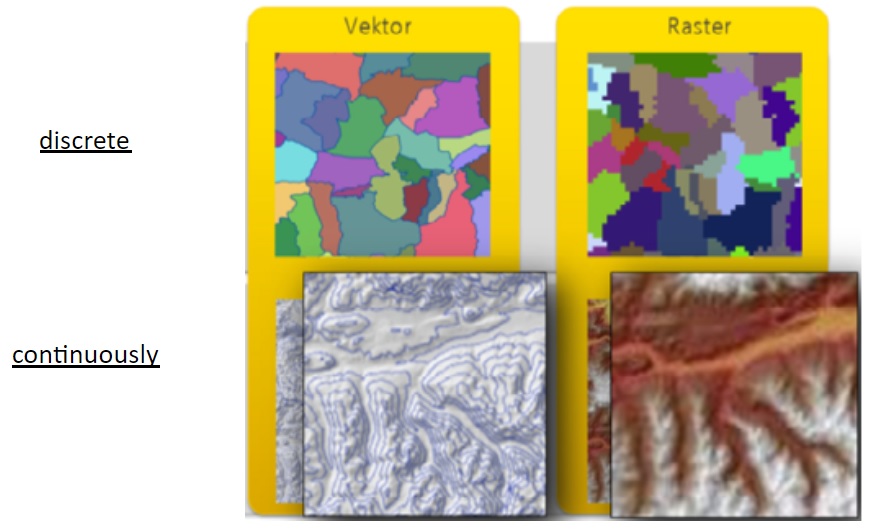
Raster Cells are units with the same geometry and area(the size of the cells can be adapted to the scale of analysis) which can be combined with digital values(also Values related to time to visualize change). Another method to analyze is to divide raster cells into different categories. The advantages of Raster Analysis are that they need less data-volume if you combine multiple Formations because of the same geometry but they have a disadvantage regarding the resolution.
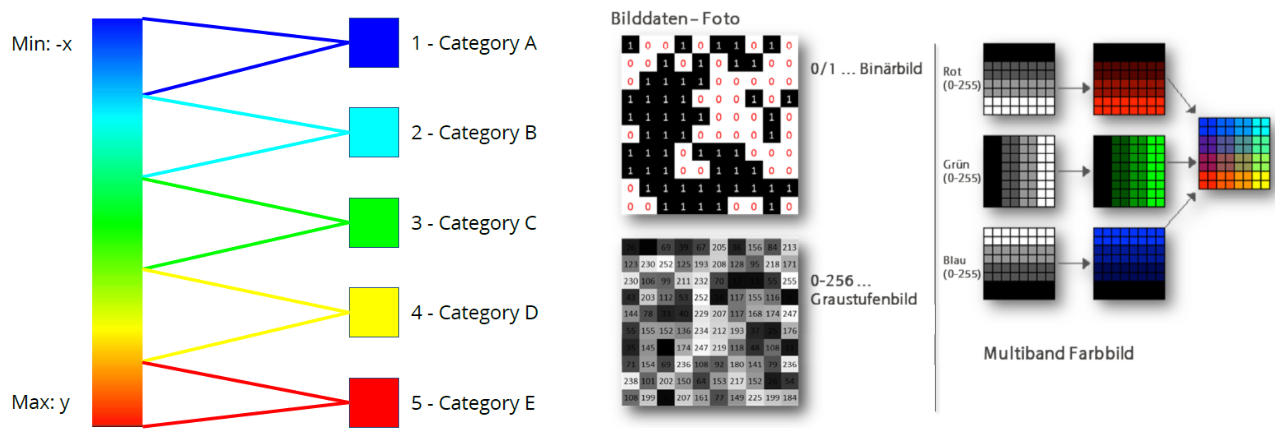
Reclassification is the key-Concept to get Information out of Satellite, aerial images. By creating Indexes(defining color ranges to create categories) we simplify the data and reduce the Information. Rules are expressed in the form of text or in Raster Calculations.
Regarding this method, raw images are not useful for zonal statistics. They can’t divide color ranges to categories with clear information because of too many changing colors. Another limitation of Zonal statistics is spatial resolution.
Dividing Images into the color bands(RGB) makes it possible to define color ranges and Categories. For this method, SAGA is a tool to make this kind of operation.
Principal outcomes

Building density per neighborhood in Sant Marti 2019

Building density per neighborhood in Sant Marti 2019
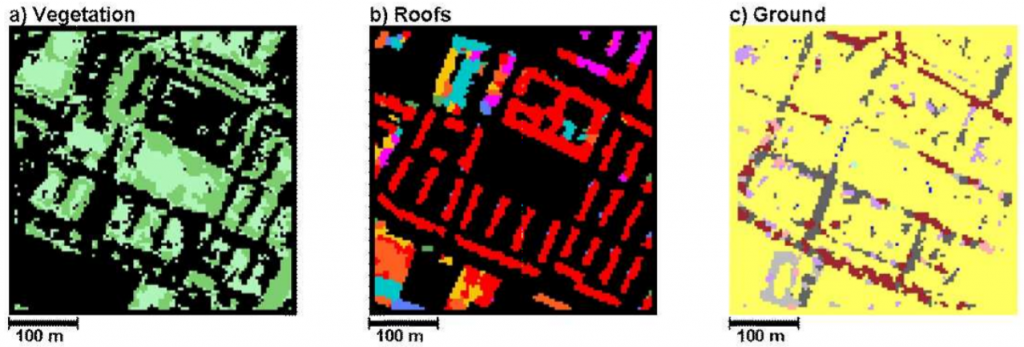
Filtered information from satellite Images via Reclassification allows us to visualize Buildings surface as pink pixel units. Divided the Building pixels into Vecotrareas from Neighborhood of Barcelona allows us to see the difference between the Buildingdensity of Neighborhoods.

Comparing the accuracy of the same information from different images
Trough reclassification we filter the green Area in the form of Raster-units(20×20 meter) and com compare them with the actual Green Surface of the Orthophoto.
Survey

The Resolution of satellite images limits the field of applications on the other side but can give us a “Picture” of a bigger Space from another view.
RECLASSIFICATION: Urban structure analysis and moreover the change of different Categories(Vegetation, Buildings, …) over a period of time.
ZONAL STATISTICS: Useful to analyze and combine information from different types of Sources. All kinds of information regarding Urban analysis and planning.

Amongst researchers, the vector data format is more common in comparison with raster data. The advantage of CSV format is that a lot of information can be connected to an Area with a low amount of storage capacity, but it needs to be connected with Raster ID or Administrative ID to visualize it as a Map.

DATA-TYPES: CSV, Vector, Raster
Conclusions
Raster and vector datasets have their own advantages and disadvantages. Calculating pixels from raw images allows us to represent data not just through maps but also through graphs and charts if we intersect them with administrative vector-areas(different scale possibilities – neighborhood, districts, city blocks, etc). And gives more control/overview over data as opposed to raster format. High resolution (10m) raster files also have peculiar issues like shadows, perspective and so it doesn’t go hand in hand easily with complex, categorized vector format.
In general, satellite imagery gives an in-depth insight into the temporal transformation of the territory. And it proves to be a potent data source as it gives information about ‘what changed’ and ‘when’. If Satellite imagery data cross-referenced with policies made during that time frame, it can give an interesting cause and effect relation between policies and territorial transformation.
REFERENCES / BIBLIOGRAPHY
elib.dlr.de/64172/1/CORP2010_28.pdf
www.icgc.cat/es/Descargas/Imagenes-aereas-y-de-satelite/Ortofoto-convencional
spatialanalysisonline.com/
www.bbc.com/news/science-environment-52560809
Satellite and aerial Imagery is a project of IaaC, Institute for Advanced Architecture of Catalonia
developed at Master in City & Technology in (2019/2020) by:
Students: Jochen Morandell, Akshay Marsute
Faculty: Diego Pajarito