Tutorial how to use “run-keeper” for data visualisation through grashopper.
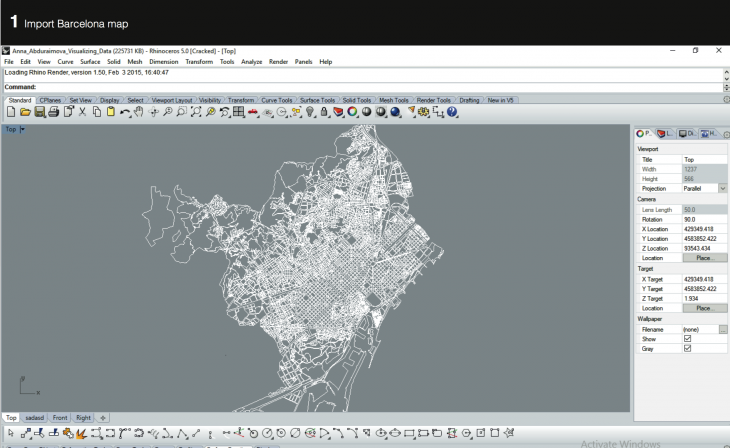

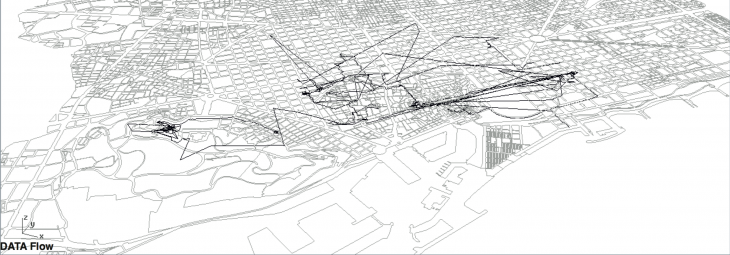
1 – Import Barcelona map; 2 – Calibrate the scale of a map; 3 – Run the script of data flow;

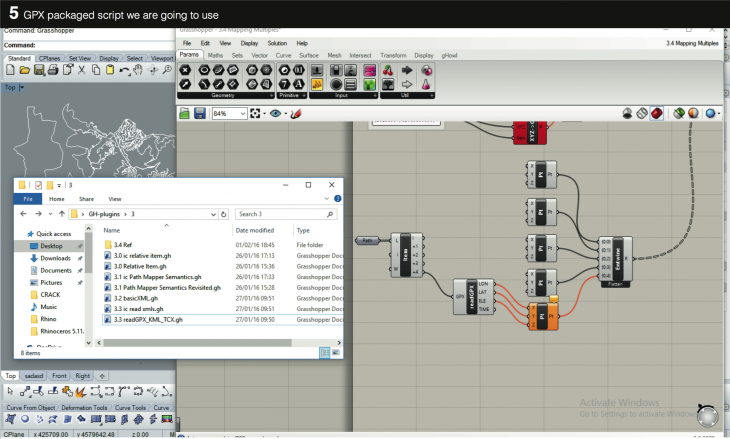
4 – Download data from run-keeper web page, (GPX-file); 5 – make the link of reading data from GPX-file.
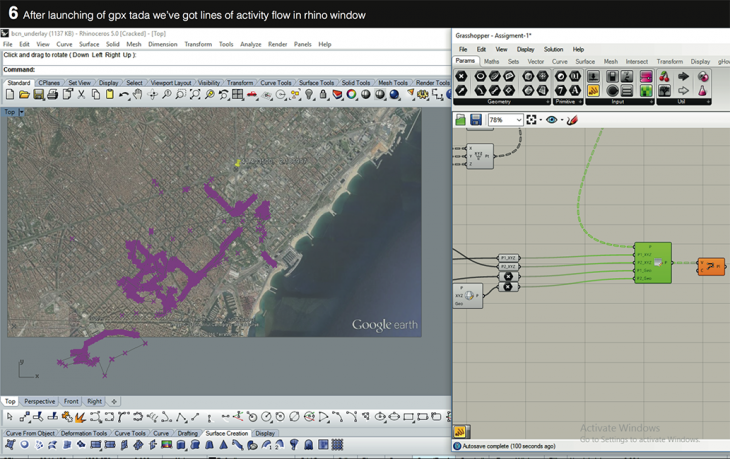

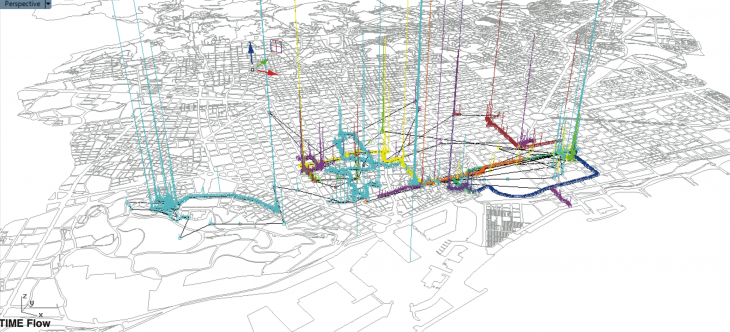
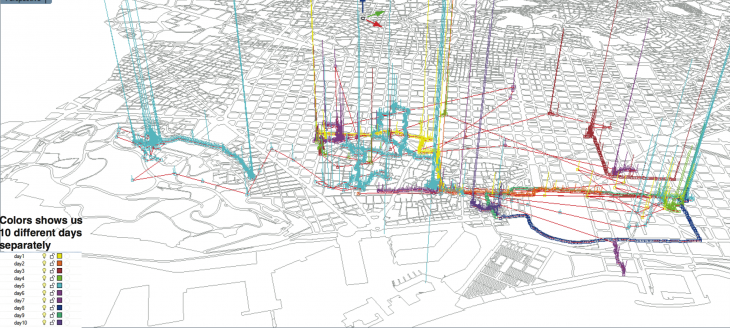
6 – Now we have lines of activity flow in rhino window; 7 – now detect to how visualise time flow.
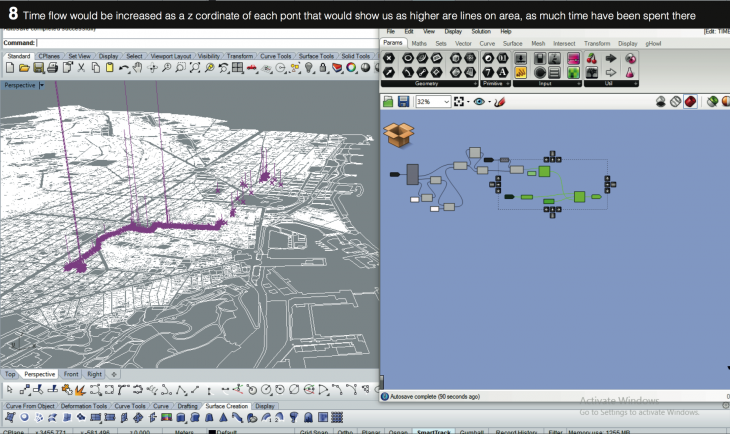
8 – in this example time is shown by z+ coordinate length
.
Student : Abduraimova Anna
Tutor : Luis Fraguada
Assistant Tutor : Rodrigo Aguirre