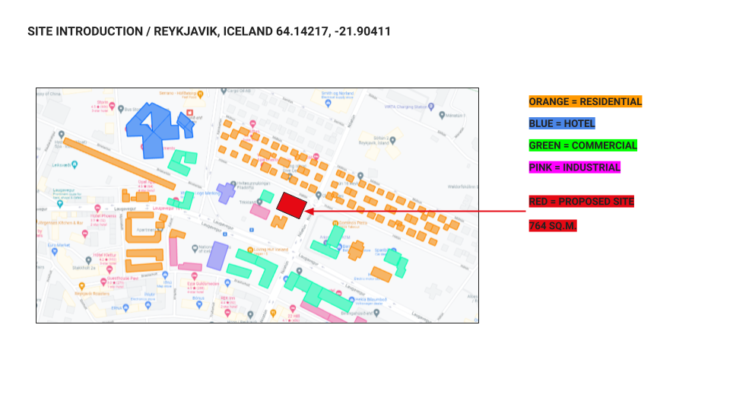
SITE INTRODUCTION / REYKJAVIK, ICELAND 64.14217, -21.90411
Reykjavik is the capital and largest city of Iceland. It is located in southwestern Iceland, on the southern shore of Faxafloi bay. It is the world’s northernmost capital of a sovereign state, and is believed to be the location of the first permanent settlement in Iceland. It is among the cleanest, greenest, and safest cities in the world.
Elevation: 39 m / 128 ft.
Barometric Pressure: 101 KPa
Approx. population: 131,136

PRELIMINARY CLIMATE RESEARCH / REYKJAVIK, ICELAND 64.14217, -21.90411
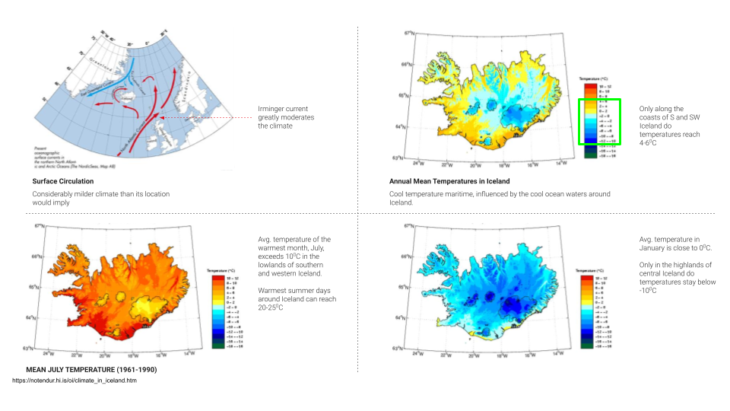
preliminary climate analysis showed that due to the Irminger current Iceland’s climate is singnifigantly more temperate than one would expect, sitting at 66 degrees north
PROGRAM
The project looks to combine two typical icelandic programs; data center and a tomato greenhouse. Complementary in that that data center needs no lighting and gives off a lot of heat, while the tomato farm requires significant light and heating
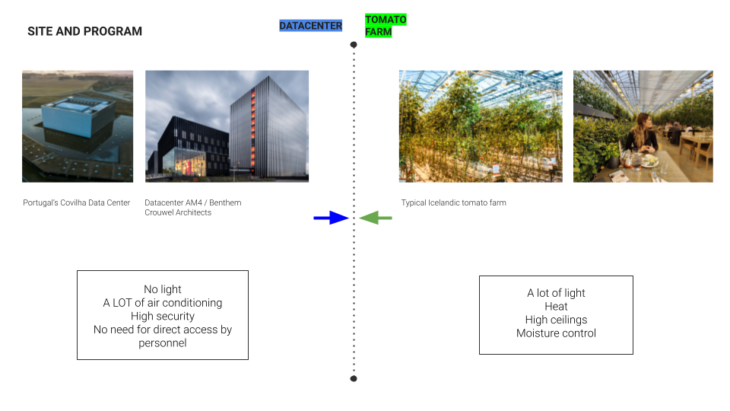
SITE
The site was chosen due to it’s banality – primarily covered my paved parking lots, this centrally located city block is in need of invigoration
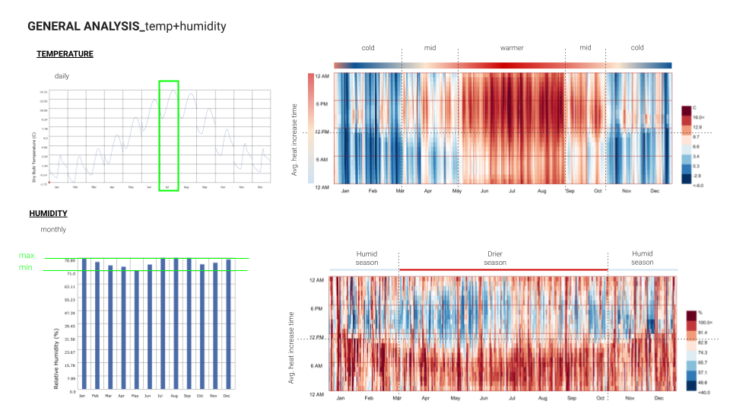
CLIMATE ANALYSIS
initial lady bug analysis confirmed that the temperatures were indeed quite moderate, ranging from -10 to +15
It also highlighted some important environmental aspects to consider while designing:
Temperature trends: Three distinct temperature based seasons are presented this chart, with the cold season being the longest
cold / Oct.15 – March.15
mid/ March.16 – May.15 + Sept.6 – Oct.20
warmer/ May.16 – Sept.6
*Reykjavik requires heating all year round, however there are three distinct “solar seasons” where heating demands will vary
Peak daily heat – warm season: The heat begins to pick up mid-day and carries over until early into the morning
General humidity: The humidity decreases in the warmer months, and decreases with the daily increase in temperature. Generally speaking Reykjavik can be described as having a humid climate.
Temperature trends: Relative Humidity percentage levels do not show extreme differences, being higher when the temperatures are low and dropping during the warmer months.
Cloud cover: More varied cloud cover in Jan, Feb and March and almost all cloud cover in december. Slight correlation with temperature, and no correlation with humidity
Solstice(s): Given the City’s location close to the northern arctic circle – the sun does not set during summer solstice and is up very briefly in winter
Long Summer Months: Understanding the sun path, and strength during the warmest summer months helps to understand potential heating patterns. Since Reykjavik is always in a heating state, the heat produced during these long summer days could be harnessed
Solar Radiation: Daily direct radiation trends correlate with varying cloud coverage…Diffuse and global horizontal radiation correlate with sun times.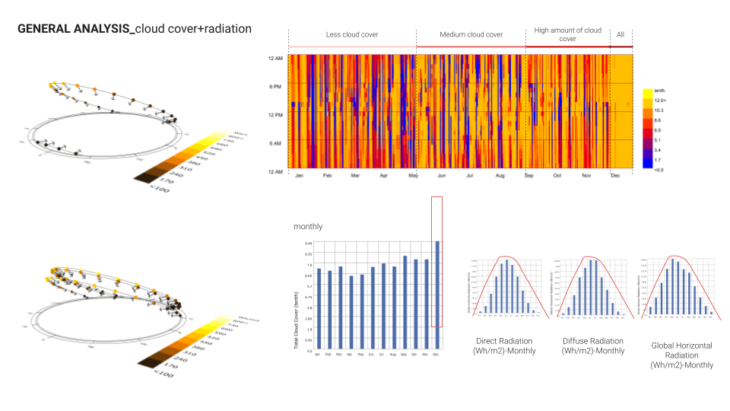
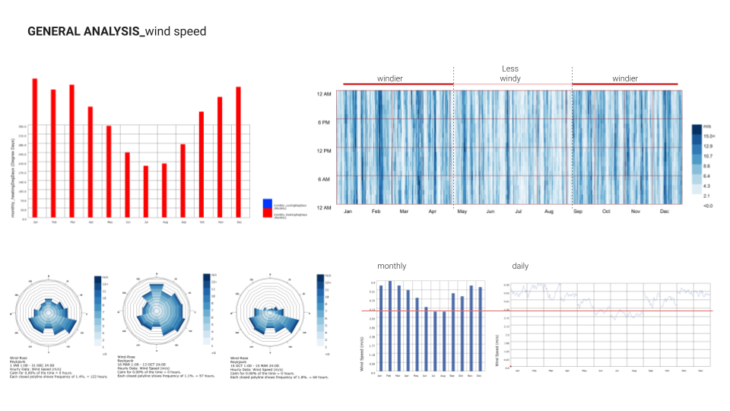
Wind Trends: Wind speed generally tends to increase during the cooler months and decrease during the warmer months
Wind Speed
Warmer months = less wind speed, and cooler months have greater wind speed
Cooler days = wind picks up at the end of the day through the night, and trends downwards as the day goes on
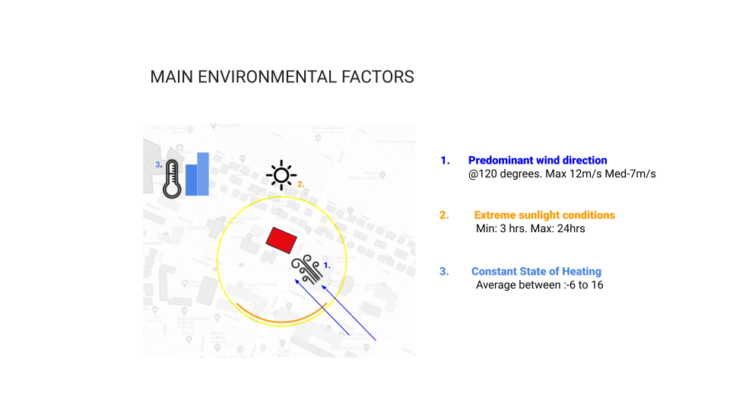
Heating Days: Given that the temperature only goes beyond 16 degrees on the warmer days, Reykjavik is in a constant state of needing heat.
Average comfort heating is considered 18
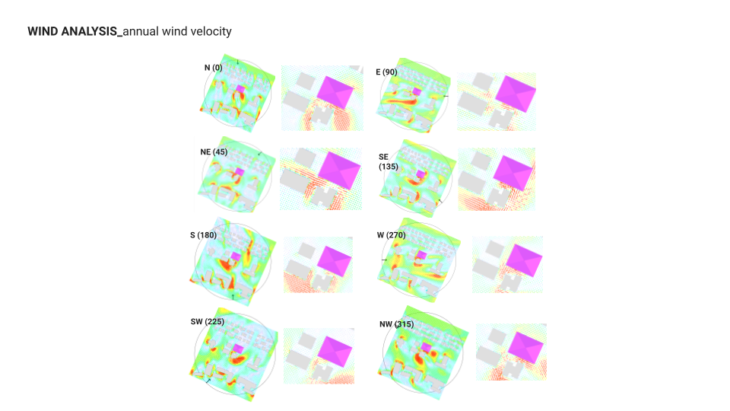
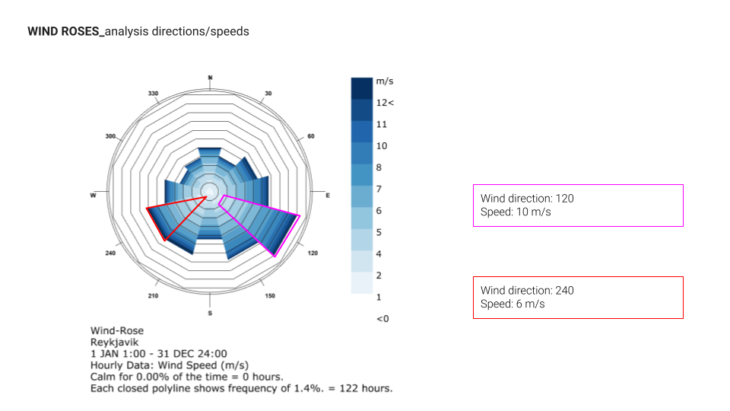
Annual Wind Rose Patterns: Wind strength is the most significant coming from the SE and tapers off as it approaches from the North.
Warm(er) Season: Typically wind speeds could be used to offset cooling loads, in this case, during the warm months, shielding is still required from the N clockwise to the S. This is considering that during warm days the temperature may surpass 16oC.
Cold Season: As the temperature decreases, while the wind increases, the city should consider architecture that is effectively sited and enveloped to withstand additional cooling caused by wind (most notably (SE) and tapering down from the South and SW.
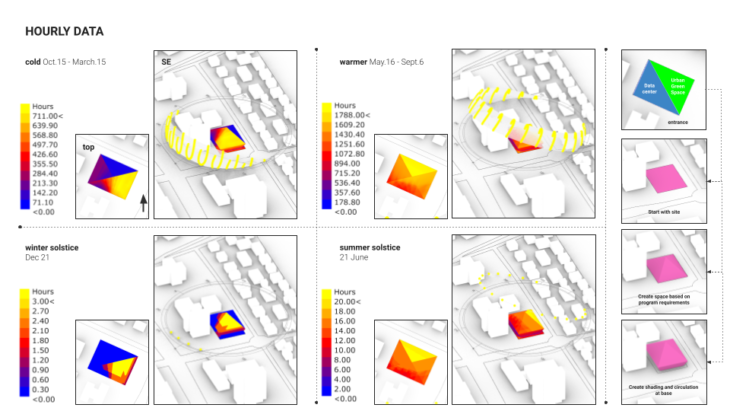
SUNLIGHT SIMULATIONS
It can be observed that the maximum solar gains happen at the Eastern quadrant of the site. During the cold season (top left), there is some additional sunlight at the NW corner. During the Warmer Season (top right), there is more sunlight available in the NE and SE corners.
During Winter solstice, it can be observed that there is minimal sunlight through the site in the Eastern direction. During Summer Solstice, there is more sunlight along the Northern, Eastern, and SE locations. One Constant is that the SW corner of the site is completely shaded all year round due to surrounding buildings.
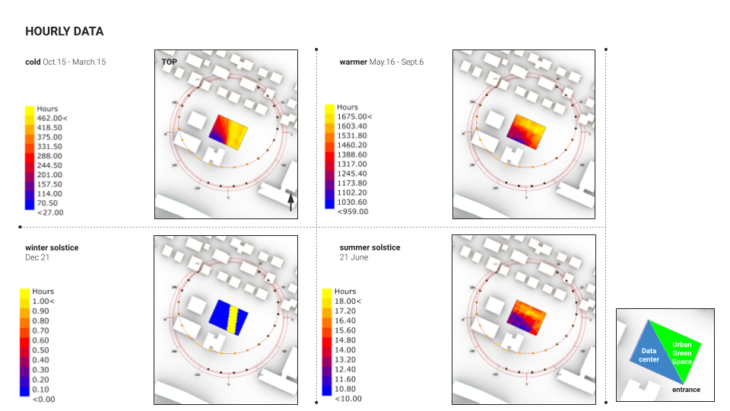
Looking at the hourly data provided us with the locations for our programs with the Data center at the SW part of the site with the least amount of gain and the North Eastern side placement of the Tomato Farm for maximum gain.
The form developed while observing the gain with starting from the site and then raising and creating a shading and circulation space at the base
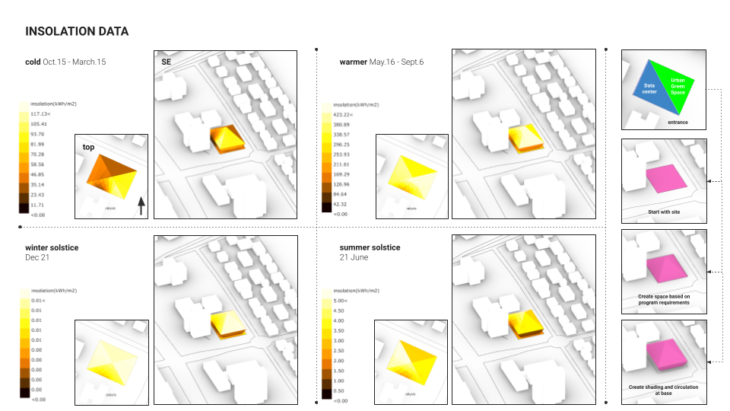
We also looked at the correlating insolation data for the form generation
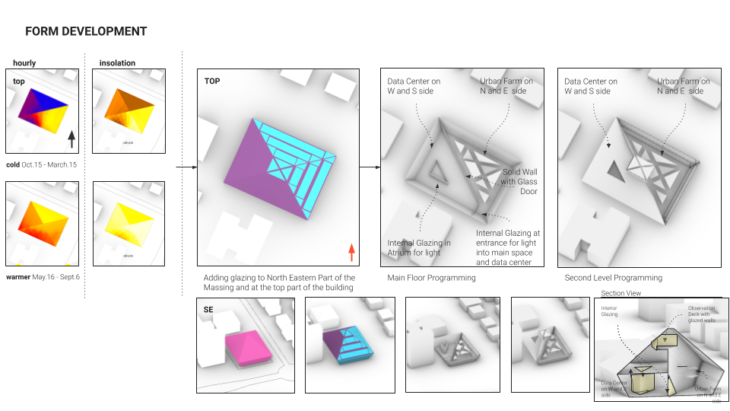
This also provided us with window locations on the NW and SW side, windows at the top of the massing, and also helped us carve out the interiors with a fractal floor space for the farm side, and a closed off space with atriums and view spaces for the data center.
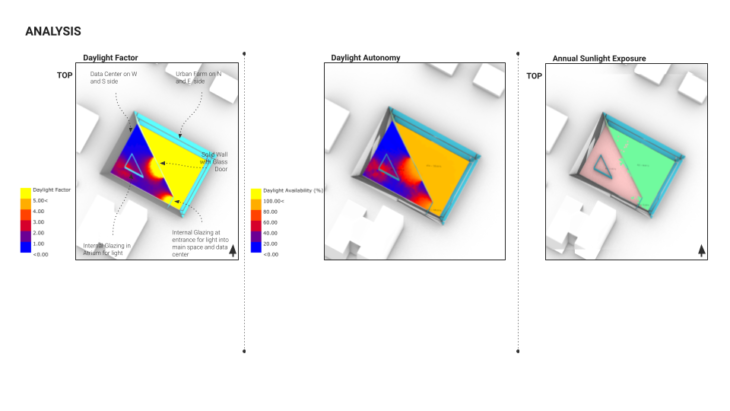
The Daylight factor analysis validated our design decisions and we can see that the farm receives the most light while the data center receives just enough light in intended areas.
The Daylight Factor Analysis tells us that the Urban Farm would receive the most light. The Data center glazing provides lights at critical apertures such as apertures and also at the entrance from where visitors can catch a glimpse of the space. The atrium provides an office.
Daylight Autonomy: Assuming a 9 am to 5 pm occupancy schedule with weekend days as Saturday and Sunday. Similar to the Daylight Factor, the Daylight Autonomy Availability also shows most o the light being available in the Green Urban Space with some light approaching the data center through critical apertures.
Annual Sunlight Exposure: Assuming no off hours and no weekend days. The Annual Sunlight Exposure provides similar information to both the Daylight Factor and Daylight Autonomy cases, with 98.81% of the exposure in the Urban Farming side as intended.
WIND ANALYSIS
An overview of the predominant wind directions, coming in at at median speed of 6m/s we can consistently the occurrence of a venturi effect.
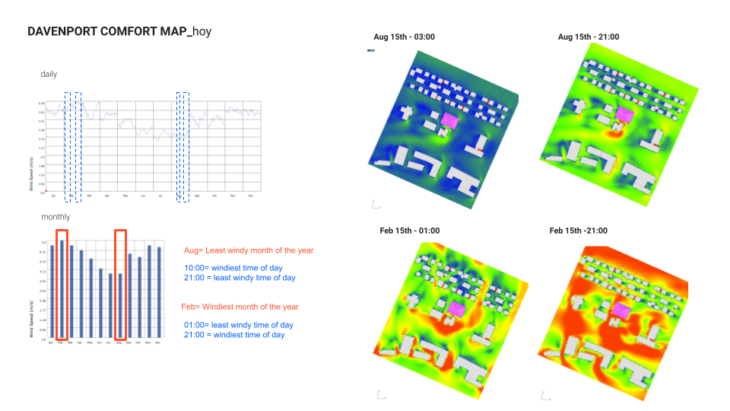
Which is further confirmed through the davenport comfort map analysis, where the affect occurs on the least windy and least windy time of the year
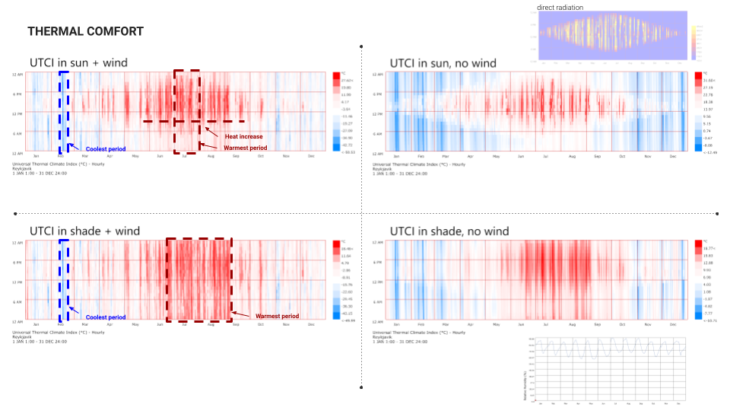
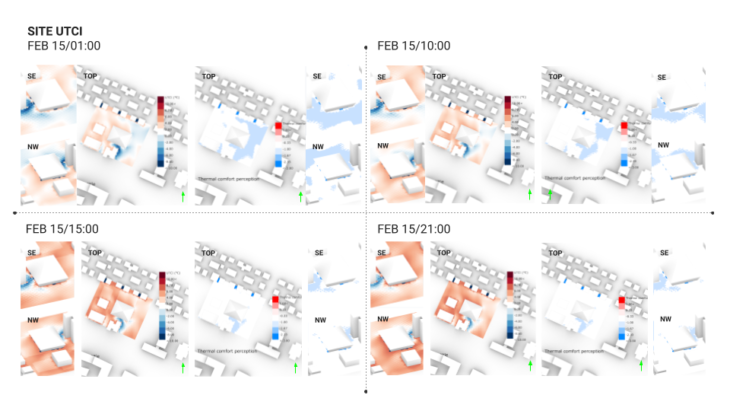
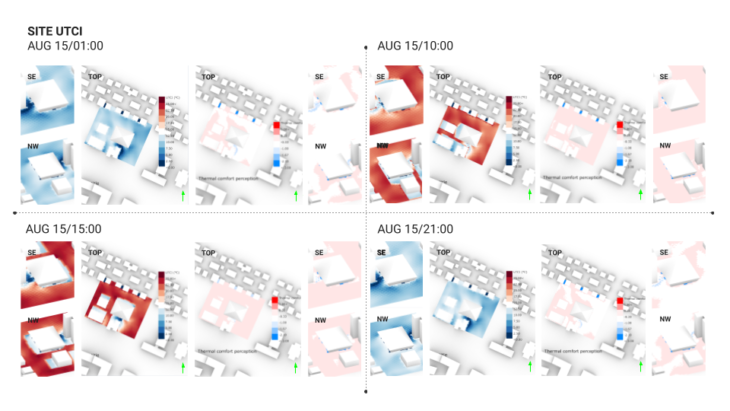
THERMAL COMFORT
For the UTCI charts, the biggest takeaway was that the wind actually plays a major role in providing discomfort in the cooling period while providing comfort in the heating period.
UTCI in sun and wind: This data aligns with past analysis, where summer is warmer for longer – with the heat picking up in the late morning and lasting well into the evening, and winter is colder and windier.
UTCI in shade + wind: Again, peak of summer and peak of winter we find thermal extremes, however, the majority of the year in shaded and windy areas falls within a reasonable area of comfort
UTCI in sun, no wind: Due to the lack of sun throughout the winter months (Nov – Feb) thermal discomfort is caused by lack of sunlight. The reverse occurs during the long summer days. Correlates with the direct radiation diagram on the right
UTCI in shade, no wind: Reykjavik is a consistently humid (per hourly chart on the right), which therefore explains the thermal discomfort occurring at either ends of the spectrum during the summer and winter months
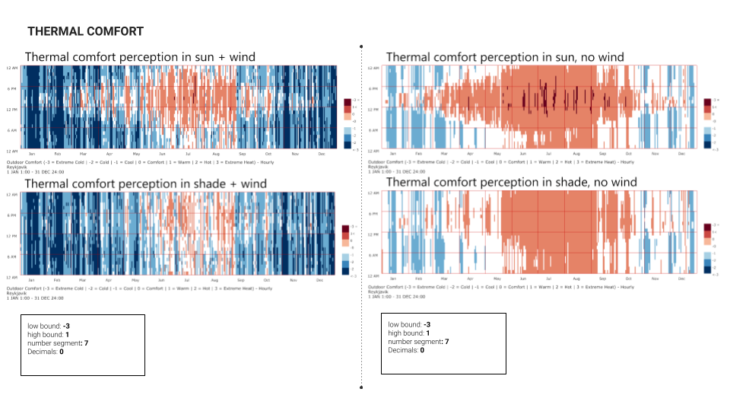
Thermal comfort perception in sun + wind
- Little thermal comfort during the winter months in the wind
- However, during the summer months the wind causes reprieve from the heat
Thermal comfort perception in sun, no wind
In comparing the thermal comfort with and without shade, it is evident that wind plays a massive role in cooling/offsetting the discomfort of heat produced by the sun during the summer months
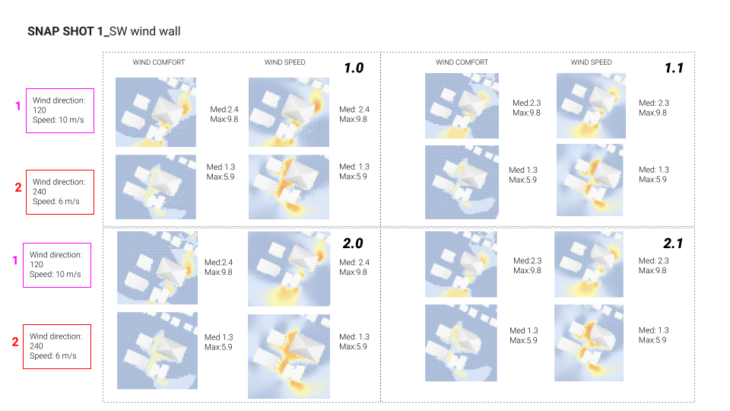
When looking at the wind speed maps for Feb and Aug, the common factor was the venturi effect between the buildings.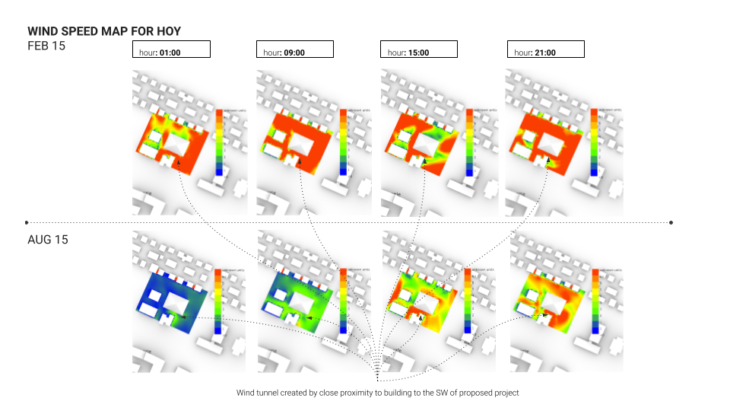
This was leading to discomfort in the same area between the buildings
And the same for August values, so we knew we had to mitigate it through design interventions
INFRARED
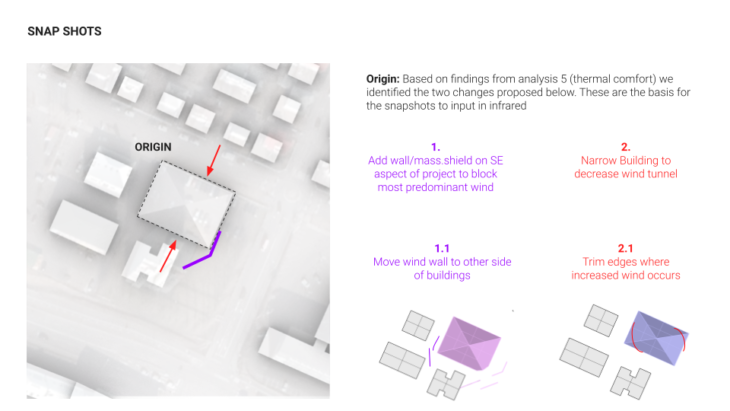
In an effort to iterate and analyse through the venturi effect noted in the wind comfort analysis various versions of the wind wall, and narrowing of the form where placed in Infrared. Unfortunately the changes being made were too small and surgical for the program. In hindsight exploring a new siting on the block for the massing would have proven to be a more fruitful exploration.
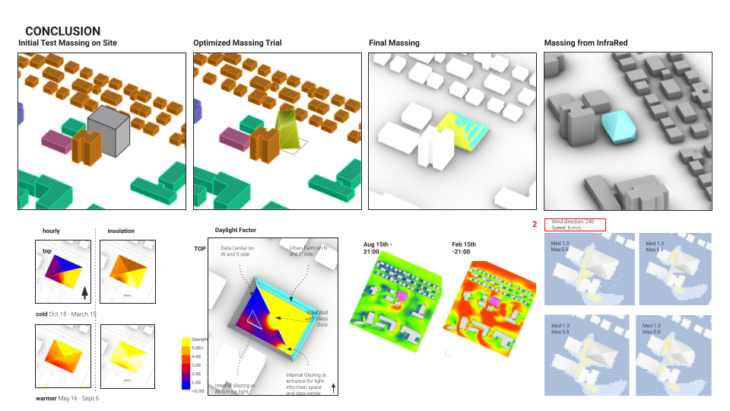
CONCLUSION
In conclusion, starting with the initial test massing and studying the solar data, our form evolved to take advantage of the solar data, and subsequently the wind and thermal comfort data, with the final massing being analyzed and sculpted by using InFraRed. As we can see, solar data allowed us to make programmatic decisions, and the wind allowed us to refine the overall design. This could be taken further and detailed as an architectural project.
REYKJAVIK CLIMATE ANALYSIS – DATA + FARM is a project of IAAC, Institute of Advanced Architecture of Catalonia developed at Master In Advanced Computation For Architecture & Design in 2021 by students: Zoé Lewis and Sumer Mathru, and Faculty: Angelos Chronis, Aris Vartholomaios, Hager El-Sokaily