Abstract
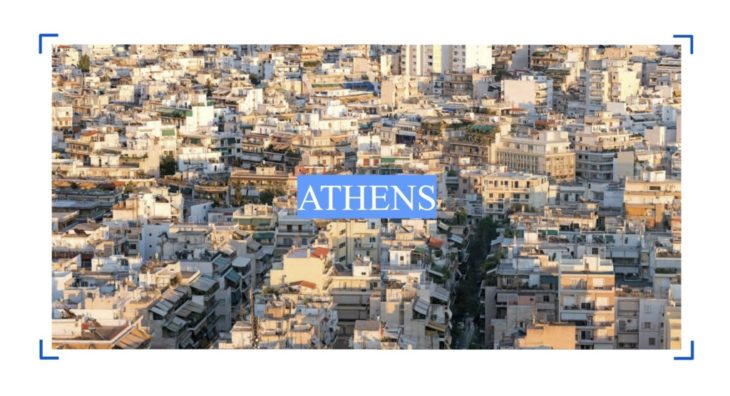
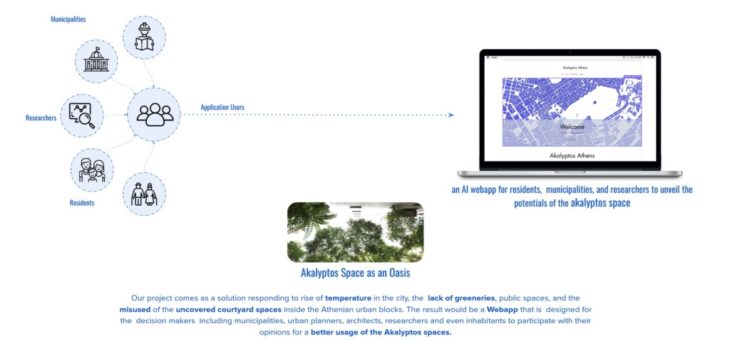
Athens, the Mediterranean metropolis, hosts the hottest summer in Europe, and in just a few decades, the city could be partially uninhabitable. As the city’s newly appointed chief heat officer, Eleni Myrivili, her assignment is to protect the Greek capital from an invisible but ever-present threat, global warming. In addition, the high building and population density, and the limited number of parks and green areas, all increase the heat island effect, putting people, ecosystems, and the city at high risk. This research explores the potential of the “akalyptos” spaces in the urban blocks, the proper exploitation of which could significantly affect the city center’s attractiveness, improve the micro-climate and strengthen the interpersonal relationships between the residents of each urban block. The Akalyptos Spaces could be one of the possible solutions ensuring the survival of Athens. Geometric and urban features of the akalyptos can define those spaces’ particular usage, privacy character and current score. In order to understand those features, we explore the application of artificial intelligence in two machine learning methods: one is clustering the data into seven subcategories, and the other is classifying the medium subareas inside the akalyptos for social inclusion, whether it is for the inhabitant of the block, the neighborhood usage, or the public. To train our machine learning model, we create a dataset from 11 neighborhoods spread around within the administrative boundary of Athens, with a range of 10-180 blocks in each neighborhood, understanding the impact of dataset variety on the effectiveness of the machine learning models. In order to evaluate the effectiveness of the dataset we generated, we trained two models for each method, one with 200 blocks with 34 features and the other with 500 blocks with 17 features. These models would be evaluated locally in Grasshopper by visualizing a parametric verified geometry and deploying the model on the akalyptos of selected blocks from Thessaloniki. The result of the best-performing model would be used in an AI web app, where the users, like residents of the city, or planners in the municipality, can be aware of the current situation and the possible transformation to make better decisions for improving those spaces.
Keywords: Athens, Akalyptos, Machine learning, Classification, Clustering, Dimensionality Reduction.
Introduction
The polykatoikia (????????????, literally “multi-residence,” is a multi-story building that includes many detached apartments) was established as the dominant form of housing in Athens in the 1930s. It was initially designed by a group of young architects connected to the pioneers of the modern movement.
These early structures were commissioned by prosperous and cultured landowners who sought social cognition, and they were invented to meet the needs of that period’s social and economic elite. (The structure of the typical polykatoikia had been an evolution of Le Corbusier’s Dom-Ino system, with a reinforced concrete frame of columns and slabs, plus an elevator shaft and staircase that allowed for flexible floor plans).
After World War II and the Civil War that followed (1946-1949), Greece was, to a large extent, destroyed. Between 1951 and 1981, the population of Athens more than doubled, from 1,379,000 to 3,027,090. Internal immigrants moved from the rural areas to the cities causing a massive demand for housing. From 1950-80 approximately 35.000 polykatoikia were built, when up to that period in Athens, only 1.000 buildings over five floors existed. The polykatoikia very soon became the dominant building typology and led to the massive dissemination of the modern vocabulary in the Greek city.
The infinite repetition of those building typologies produced an urban landscape that covered the whole Attica basin. Every single piece of land that was possible to build on was built. Only the tops of the hills, the coasts, the archaeological sites and a few public spaces have escaped development. The rest of the landscape had been transformed into a dense, small-scale urban environment. Furthermore, architects had limited involvement in the production of polykatoikia during the post-war reconstruction. Thus, the architecture of these buildings was straightforward, with a repetition of a typical floor plan and a replication of linear balconies that formed the facade. These multi-story apartment buildings allowed population density and complementarity of uses (residential offices, while small trade, cafes, and restaurants, were hosted on the ground floor). Nowadays, most of the center of Athens and many other city quarters consist of those buildings.
Are there untapped urban voids that could improve the living conditions of the residents of each urban block and improve the micro-climate? For example, akalyptos spaces could be a solution to the problems that the city is facing.
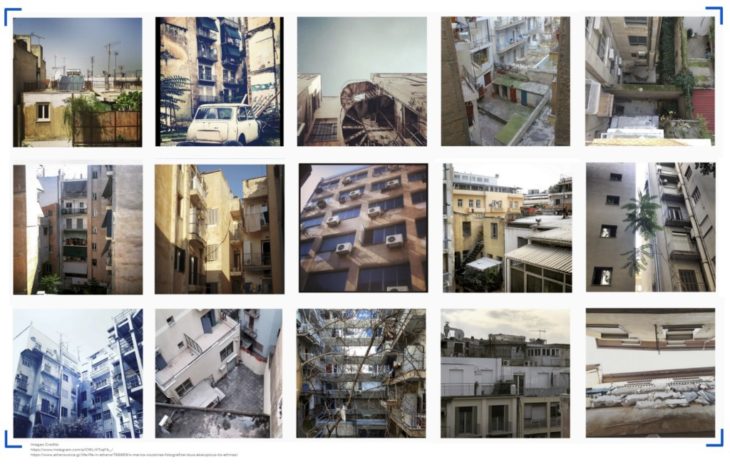
Akalyptos (?????????, literally “uncovered space”) is the part of the plot that is not built due to the building regulations and the coverage factor allowing free space in the middle of the urban block. It belongs to all the owners of the apartments of the attached polykatoikia.
Despite the building regulations that define that 2?3 of the akalyptos space should be unpaved to eliminate the risk of floods, most of those spaces stay untapped and unused, creating an unpleasant environment in the middle of the urban blocks.


State of the Art
I. Barcelona: Block City
Normally monuments are exceptions and generators of the urban plan, but in Ildefons Cerdà’s Eixample in Barcelona the dominant type of city, the urban block, subsumes any other types. For example the Sagrada Familia by Antoni Gaudi can be seen less as a monument than a church subjugated to the block structure, with its plan developed from the cloister and not a Gothic church.
Cerdà defined the blocks as pieces of public infrastructure through the concept of ‘interway’, which is distinct from the isolated block structure and islands that Rem Koolhaas discovered in Manhattan, raising the question of what a new urban idea of the interway could be.
Ildefons Cerdà’s Eixample in Barcelona
“Cerdà focused on key needs: chiefly, the need for sunlight, natural lighting and ventilation in homes (he was heavily influenced by the sanitarian movement), the need for greenery in people’s surroundings, the need for effective waste disposal including good sewerage, and the need for seamless movement of people, goods, energy, and information.”
II. KEMP, a digital participatory design platform
Master Thesis, Students: Adamopoulos Georgios, Aronidis Elias, Pappas Phillipos
Supervisor: Papalexopoulos Dimitris, National Technical University of Athens, 2016
This thesis is based on the typical Athenian multi-storey building, “Polykatoikia”. ?ore specifically, focuses on its inability to provide adequate and quality shared spaces, equally accessible to all residents. They develop and propose KEMP, a toolkit for the design of multi-level, adaptable outdoor shared spaces, positioned within the three-dimensional void of the typical Greek city block. It combines urban design and analysis tools with a communication platform for the active collaboration of residents and engineers, in the context of a digitally augmented participatory design process. Through beta version implementation of the proposed digital tools and participatory process simulation, they attempt an indicative design solution for the creation of shared spaces in an existing city block, while assessing the efficiency of these tools for augmenting the participatory design process.

PROBLEM/ City Scale
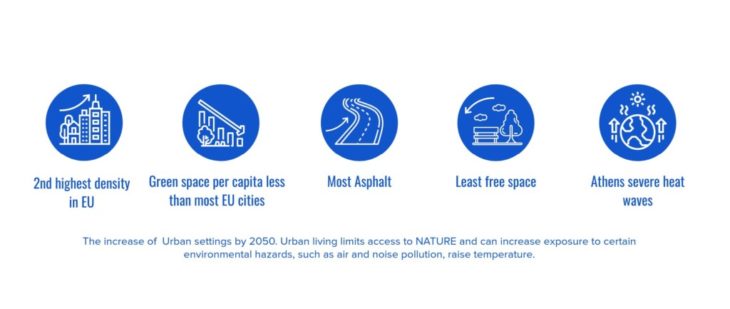
The increase of Urban settings by 2050. Urban living limits access to NATURE and can increase exposure to certain environmental hazards, such as air and noise pollution, raise temperature.
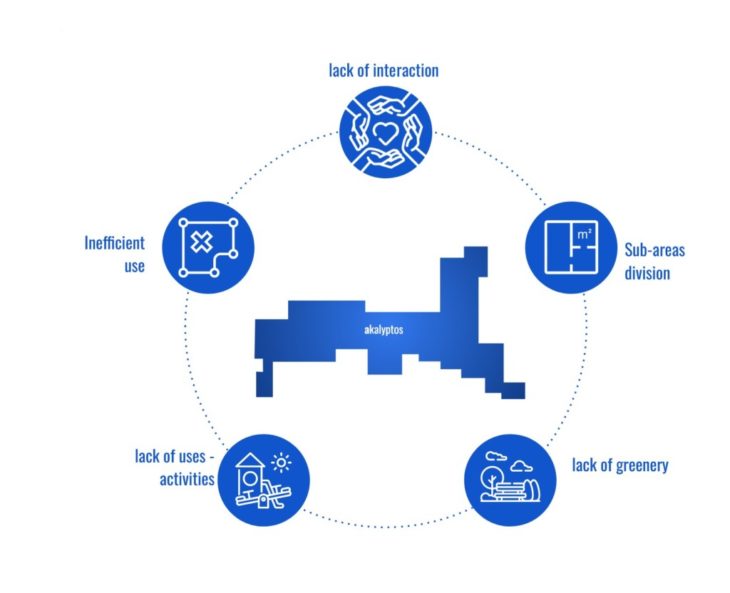
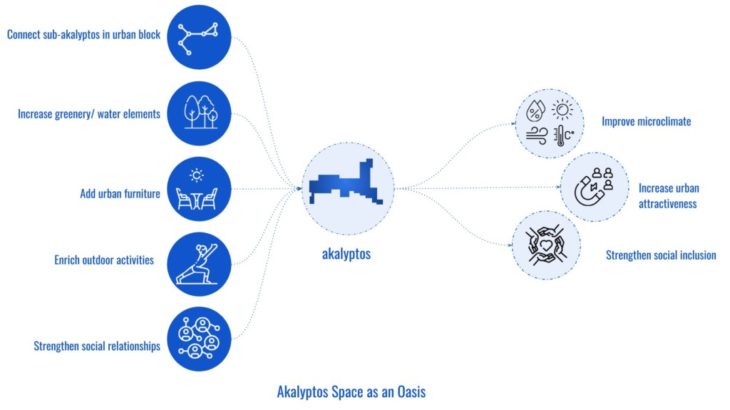
This research aims to investigate the potential of those uncovered areas. The connection of the individual akalyptos areas could create a shared space, which would be vital in the heart of every building block. It could become the place to meet, rest, and play, to get to know the neighbors, or it could simply improve the microclimate of every apartment facing it and the resilience and attractiveness of every neighborhood in the city center.
Furthermore, this city development will be based on the following principles: reconsideration, recreation, participation, and interaction of the inhabitants, following a bottom-up approach.
Using machine learning algorithms, we are attempting to classify whether the akalyptos space would be suitable as a shared free space for the residents of the urban block itself, as a shared space for the neighborhood, or lastly, applicable for public use. The classification will be based on the following factors:
- Height and uses of attached buildings
- Size and shape of “akalyptos” space
- Direct access from the street or not
- Existence of empty plots in urban blocks or not
- Uses or lack of uses of the surrounding neighborhood.
Possible uses: private or semi-public gardens, gathering space, playground, a place for effective waste disposal, evaporative cooling potential, lending library, sporting facilities, art space, open-air cinema, theater plays, small events, small cafe, gastronomy facilities, other cultural & commercial uses.
SOLUTION/ Akalyptos Space
Akalyptos Space as an Oasis
Our project comes as a solution responding to rise of temperature in the city, the lack of greeneries, public spaces, and the misused of the uncovered courtyard spaces inside the Athenian urban blocks. The Webapp would be designed for the decision makers including urban planners, architects, politicians and even inhabitants to participate with their opinions for a better usage of the Akalyptos spaces. This project will propose the optimal locations and usage of the sub areas in side the akalyptos for social inclusion.
TERMINOLOGY
# Polykatoikia
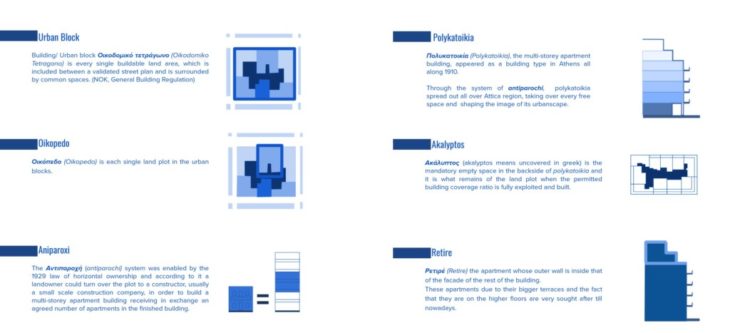
???????????? (Polykatoikia), the multi-storey apartment building, appeared as a building type in Athens all along 1910. Polykatoikia,though, as the social & legal contract which is the essence of it, was constituted and established with the 1929 law of horizontal ownership, according to which each apartment could have a different owner and the management of shared spaces is done collectively. Since then and through the system of antiparochi, polykatoikia spread out all over Attica region, taking over every free space and shaping the image of its urbanscape, as well the human geography of the modern metropolis.
The mass spread of polykatoikia was abetted by its cheap standardized construction method, the easily adaptable floor-plan which as a reinterpretation of maison dom-ino implied its infinite reproductions with small variations, its relatively small size that economically enabled its wide dissemination, and the maxim
ization of profit due to the variety of possible uses which could co-exist in a single building: shops, offices, storage spaces, workshops, luxury last floor apartments and cheap basements, even public services.
# Akalyptos
????????? (akalyptos means uncovered in greek) is the mandatory empty space in the backside of polykatoikia and it is what remains of the land plot when the permitted building coverage ratio is fully exploited and built. With the introduction of polykatoikia, back in 30s, the building coverage ratio was not yet regulated adequately by the law and it was up to each construction to find the ideal analogy, thus ending up with coverage of 80-90% or even 100% of the land plot. The 1955 law set the limit to 70% for the center of Athens, where it is till now.
# Buildings/ Urban Block
Building/ Urban block ?????????? ????????? (Oikodomiko Tet
ragono) is every single buildable land area, which is included between a validated street plan or between the borders of a settlement and is surrounded by common spaces. (NOK, General Building Regulation)
The First General building code designated the building block as the minimum unit of urban planning and city formation, though, in practice, it was the land plot that played that role. The urban blocks and the street network produced, have a common typology. Its main features are their small size, their front development, their piecemeal production, their diversity and their multifunctionality as also its density and insufficient width respectively.
# Oikopedo
???????? (Oikopedo) is the land plot
in the urban blocks. Land plots, especially in the center of the city are generally quite small since the fragmentation of the land was encouraged by the state as another policy to create extra value out of land without spending any money.
Whereas the building block is set out by the law as the elementary unit of urban planning, it was finally the land plot that proved out to be the module which defined the modern cityscape of Athens. Due to its characteristics, small, overbuilt and overcrowded, it contributed to this fetching urban diversity of Athens, though not without problems.
The first Building Code of 1929 allowed
for new constructions even in plots that gav
e a minimum floor area of 40 sq. Fragmentation of land combined with high floor area ratio and high building coverage ratio, which reached even 80%-90% during 30s when the building regulation was quite relaxed, squeezed any free –green space out of the land plot.
# Aniparoxi
The ?????????? (antiparochi) system was enabled by the 1929 law of horizontal ownership and according to it a landowner could turn over the plot to a constructor, usually a small scale construction company, in order to build a multi-storey apartment block receiving in exchange an agreed number of apartments in the finished building.
Antiparochi became the synonym of Reconstruction Era of postwar Greece and the Athenian polykatoikia- 90% of them were built with the system of antiparochi. The great interior migration wave plus the casualties of the war, counting thousands of demolished houses, urged for a fast mass housing program.
Antiparochi was a kind of a social welfare policy of the State, which couldn’t afford to finance directly a social housing program so it invested in this type of semi-informal urbanism, creating favorable conditions for the unplanned expansion of the city. This was also a State directive to incentivize and promote the construction sector as its basic productive activity that in the following decades leveraged the Greek economy. Tolerant as it was with illegal building, and very accommodating with building quality controls, the Greek state furthered primed new constructions imposing a high tax on property transfers as an anti-incentive to buying existing buildings.
The mechanisms of capitalizing on land were to raise the floor area ratio thus creating surplus value out of the existing land, against the urban space quality and public space. There were special tax incentives for antiparochi that enabled its wide spread out – it was almost free of tax for the land- owner, who had just to pay a very small fee (around 3000 euro).
After 2006 the law on antiparochi changed and now the owner of the land has to pay a tax of 18% on the value of the apartments he receives as antiparochi, thus putting an end to the golden era of antiparochi.
#Retire
?????? (Retire) from the French word retiré meaning withdrawn is called the apartment whose outer wall is inside that of the facade of the rest of the building. Retire apartments are located in the last floors of the polykatoikia and have larger balconies than those of the rest of the floors, which are called verandas.
The fact that they are located in the last floors and that they provide larger outdoor space, makes them more sought after and thus more expensive in comparison to the rest of the apartments. The retire apartment are also determined by the law.
Since the period of the great urbanisation in Greece in the late ‘60s and ‘70s, the ownership of a retire apartment was a sign of urban affluence and that is still the case today.

Definition Source:
URBAN ANALYSIS/ Focus Area
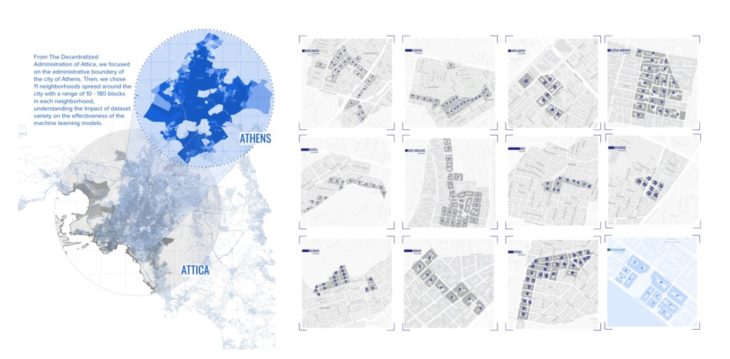
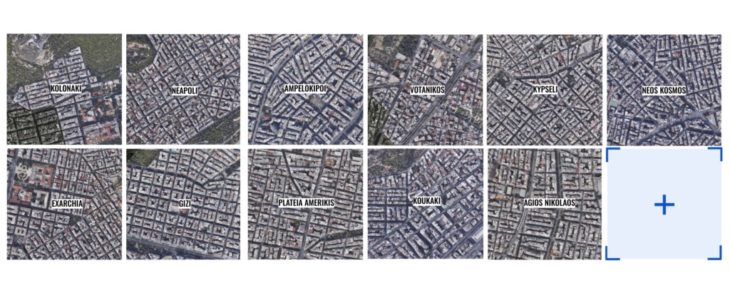
From The Decentralized Administration of Attica, we focused on the administrative boundary of the city of Athens. Then, we chose 11 neighborhoods spread around the city with a range of 10 – 180 blocks in each neighborhood, understanding the Impact of dataset variety on the effectiveness of the machine learning models.
URBAN ANALYSIS/ Selection Sub-areas
We focused on 11 Neighbourhoods within the administrative boundary of the city of Athens. Each district of the Athenian city center has its own distinct personality. Therefore, the neighborhood selection was based on the different characteristics, such as the urban and natural environment, the residents’ profile, and the activities each area has. We also chose Urban blocks and Akalyptos within these areas with diverse shapes, sizes, and closedness/ openness to have an equally represented dataset.
The main characteristics of the selected neighborhoods are the following:
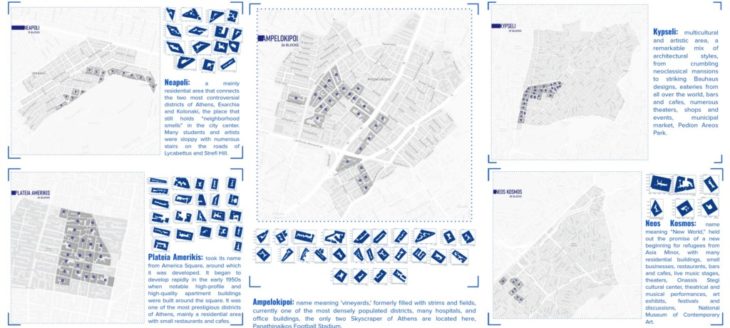
Kypseli: multicultural and artistic area, a remarkable mix of architectural styles, from crumbling neoclassical mansions to striking Bauhaus designs, eateries from all over the world, bars and cafes, numerous theaters, shops and events, municipal market, Pedion Areos Park.
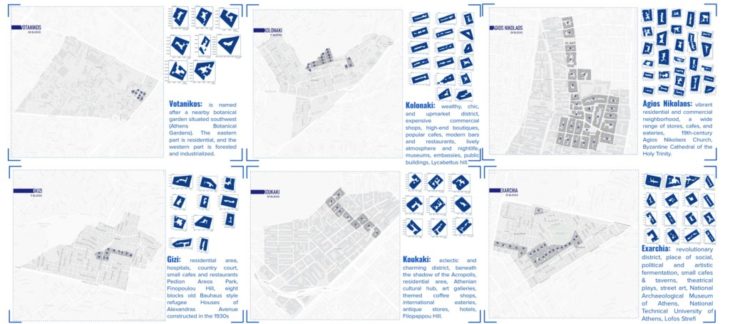
Exarchia: revolutionary district, place of social, political, and artistic fermentation, multicultural ambiance, students, academics, and intellectuals, alternative side of Athens, bustling nightlife, small cafes and quaint taverns, theatrical plays, festivals, various events, vintage shops, street art, National Archaeological Museum of Athens, National Technical University of Athens, Lofos Strefi
Votanikos: is named after a nearby botanical garden situated southwest (Athens Botanical Gardens). The eastern part is residential, and the western part is forested and industrialized.
Gizi: residential area, hospitals, country court, small cafes and restaurants Pedion Areos Park, Finopoulou Hill, eight blocks old Bauhaus style refugee Houses of Alexandras Avenue constructed in the 1930s
Kolonaki: wealthy, chic, and upmarket district, expensive commercial shops, high-end boutiques, popular cafes, modern bars and restaurants, lively atmosphere and nightlife, museums, embassies, public buildings, Lycabettus hill.
Koukaki: eclectic and charming district, beneath the shadow of the Acropolis, residential area, Athenian cultural hub, art galleries, themed coffee shops, international eateries, antique stores, hotels, Filopappou Hill.
Neos Kosmos: name meaning “New World,” held out the promise of a new beginning for refugees from Asia Minor, with many residential buildings, small businesses, restaurants, bars and cafes, live music stages, theaters, Onassis Stegi cultural center, theatrical and musical performances, art exhibits, festivals and discussions, National Museum of Contemporary Art.
Plateia Amerikis: took its name from America Square, around which it was developed. It began to develop rapidly in the early 1950s when notable high-profile and high-quality apartment buildings were built around the square. It was one of the most prestigious districts of Athens, mainly a residential area with small restaurants and cafes.
Agios Nikolaos: vibrant residential and commercial neighborhood, a wide range of stores, cafes, and eateries, 19th-century Agios Nikolaos Church, Byzantine Cathedral of the Holy Trinity.
Neapoli: a mainly residential area that connects the two most controversial districts of Athens, Exarchia and Kolonaki, the place that still holds “neighborhood smells” in the city center. Many students and artists were sloppy with numerous stairs on the roads of Lycabettus and Strefi Hill.
Ampelokipoi: name meaning ‘vineyards,’ formerly filled with strims and fields, currently one of the most densely populated districts, many hospitals, and office buildings, the only two Skyscraper of Athens are located here, Panathinaikos Football Stadium.
LOCAL CLIMATE ANALYSIS/ Athens
Heating/ Cooling degree days
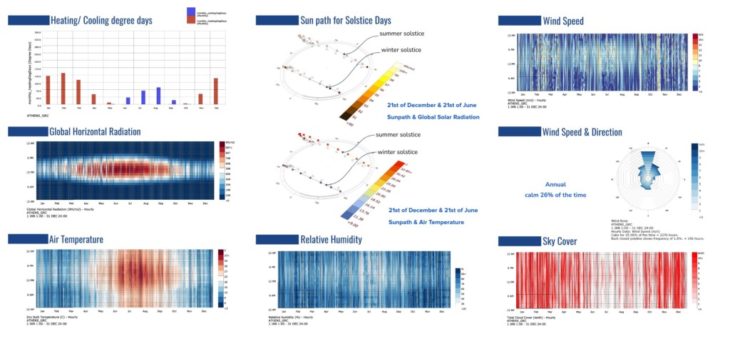
To define the Heating/ Cooling degree days, we have set the cooling base temperature as 26°C and the heating base temperature as 15°C. The months that exceed 26°C are June to September, which means that cooling systems will probably be required during that period. On the other hand, the months with temperatures below 15°C are November to April so heating systems will be required.
Global Horizontal Radiation
Global horizontal radiation is the total short-wave radiation from the sky falling onto a horizontal surface on the ground. It includes direct and diffuse solar radiation resulting from reflected or scattered sunlight. In this diagram, the most horizontal solar radiation is received in the period between the end of March to the end of September and from around 11:00 to 15:00. In comparison to the previous diagram of the air temperature, the highest temperatures last hours later and before (approximately 09:00-19:00).
Sun path for Solstice Days
In the diagrams we can see the sun path during the summer (21st of June) and the winter solstice (21st of December). The colours inside the sunspheres show in the 1st diagram the actual amount of global solar radiation. The darker the colour is, the less solar radiation is received during that particular hour of the day. In the second diagram the colours inside the sunspheres show the air temperature. The higher air temperatures are observed in the summertime and from the middle of the day till the evening (west direction).
Air Temperature
The first diagram shows that the highest temperature throughout the year is ca. 37°C and the lowest 5.5°C. The hottest period is from May till the beginning of October, while the highest temperatures appear at the beginning of June till the end of September. On the other hand, the coldest months are December to March, with the coldest temperatures observed from the end of December till the middle of February. Regarding the hours of the day, the hottest period is seen between 09:00 to 19:00. According to the second and third diagrams, we understand that heating for the thermal comfort of the residents will be needed from November to April, while cooling systems probably will be needed in July and August, with the hottest hours occurring from the middle of the day till the evening.
Relative Humidity
According to the diagrams, the highest humidity is observed in the months between October to March. Conversely, the lowest humidity is observed from June to August.
Sky Cover
According to the diagrams, the months with the less sky cover are from June to September, while the rest of the months show quite the same trend (with the months November to March showing the higher amount of sky cover).
Wind Speed
According to the 1st diagram, the strongest winds are observed in October and November, while February, March, and September are also windy. We can also understand that during a typical day at the end of October/ beginning of November, the strongest winds appear at different hours of the day. However, during the hot period, we can see that the hour between 8 am to 7 pm have higher wind speeds. Diagram 02 (Monthly Bar Chart) shows that the windiest months are February, March, and June. The third Diagram (Hourly Average) shows us the wind speed of a typical day of each month. Compared to the previous diagrams, the results can be analyzed better throughout the day. We can understand that during the evening hours, the winds are more robust, which can positively affect passive cooling.
Wind Speed and Direction
From the wind underneath, we can understand that the strongest winds occur from the north. The direction is 0 to 50 degrees from October to March, while from June to September, the main wind direction is the absolute north. The wind has a positive effect during the cooling period (passive cooling) and a negative effect during the heating period.
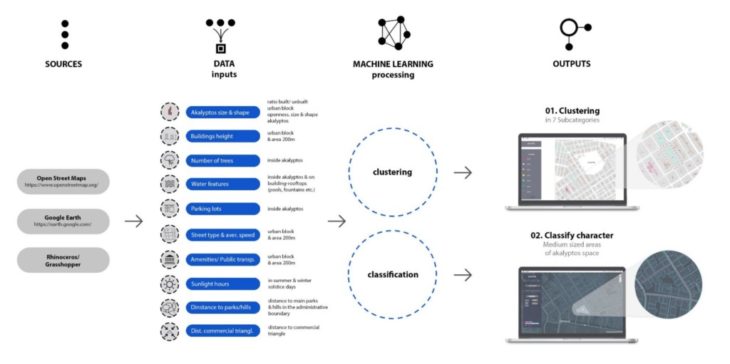
PROCESS
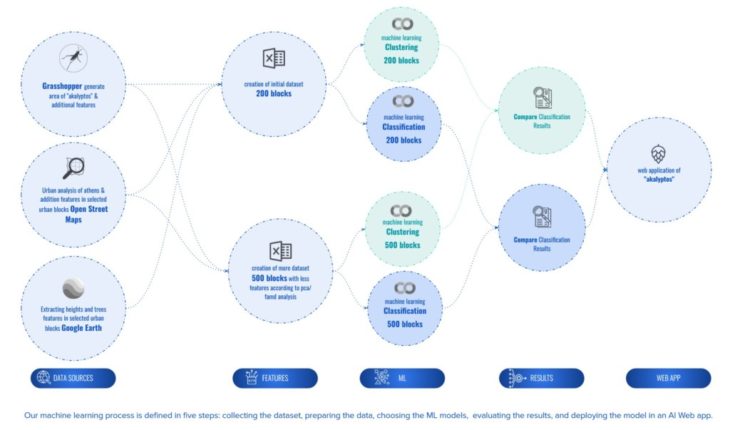
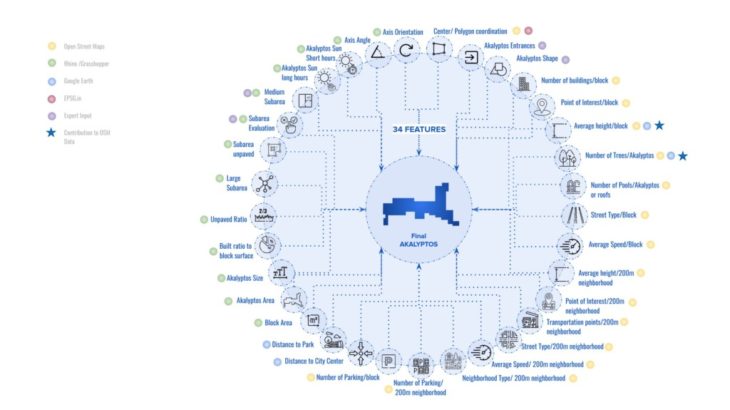
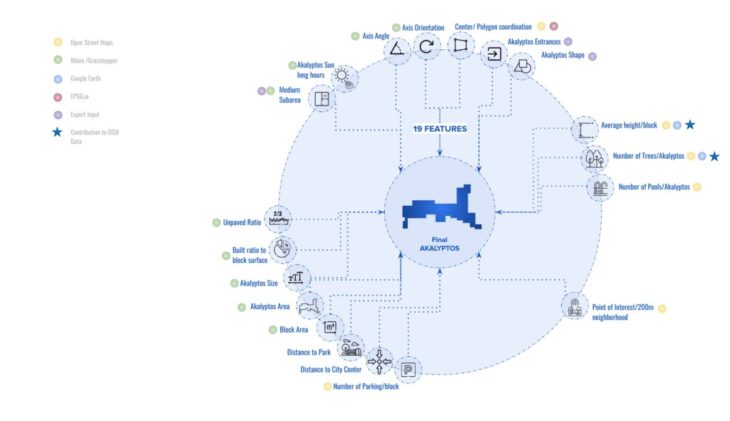
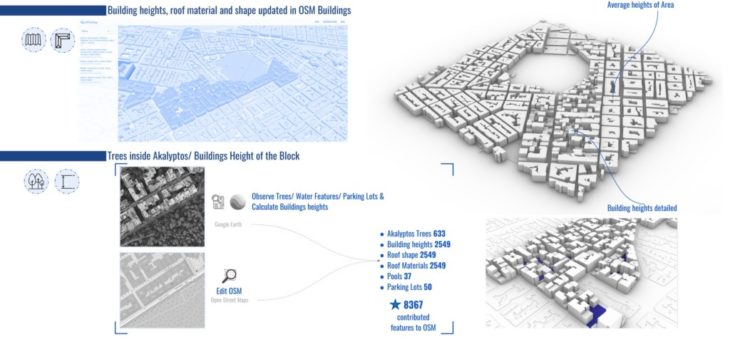
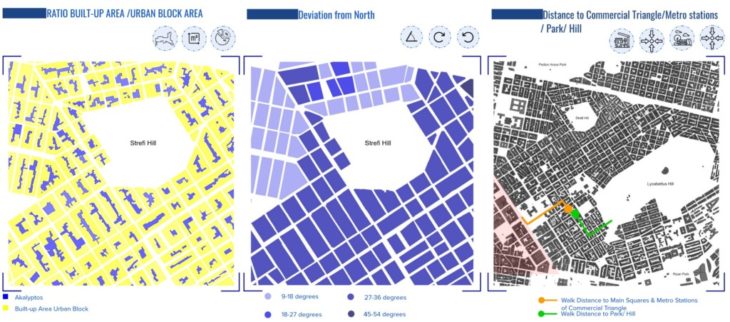
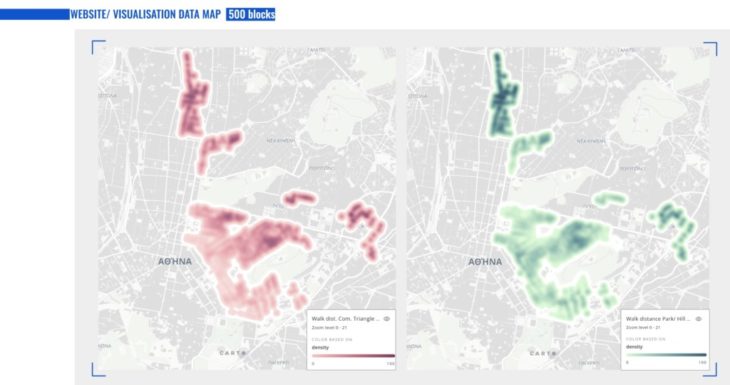
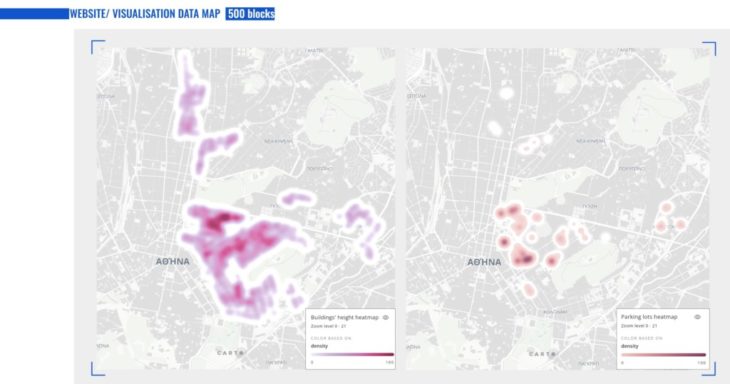
To create a machine learning model that can find correct patterns, we collected reliable data on Akalyptos spaces from existing blocks in Athens. We created a dataset from 11 neighborhoods spread around the administrative boundary of Athens, with a range of 10-180 blocks in each neighborhood, understanding the impact of dataset variety on the effectiveness of the machine learning models. We used Google Earth to extract the buildings’ heights, the roofs’ material and shape, the number of trees, the distance to the closest parks, and the distance to the city center, which is the commercial triangle of Athens. From Open Street Maps, we collected all the urban features that play a role in shaping the model. These features are the coordination points, number of buildings, point of interest, average heights of the buildings, number of pools, street types, average speed, and number of parking within the one block. Then we did the same for a 200m radius from the center of each Akalyptos to gather average heights of buildings, point of interest, transportation points, street type, average speed, neighborhood type, and the number of parking. In Grasshopper and Rhino, we drew 500 Akalyptos outline shapes and their blocks. We imported the data from OSM with the ELK plugin in Grasshopper to generate the buildings in 3D; we calculated the Akalyptos area, size, Block area, unpaved ratio, and built ratio to block surface. With Ladybug, we did the environmental analysis. We calculated the Akalyptos sun hours for the longest day and sun hours for the shortest day, as we got the block’s deviation axis and its orientation. In Grasshopper, we did a script based on research on defining the Akalyptos in sub-areas with different sizes for different uses. So, we generated three sub-areas one Large for environmental purposes, a medium size for the social interaction of the residents, and a small size for private uses. We extracted the area large and medium to include them in our dataset, as well as the evaluation of each large area if they fulfill the ? regulation of the unpaved surfaces from the municipality of Athens. In the beginning, we collected 200 blocks with 34 features; then, we wanted to increase the data. We collected 300 more, 500 blocks in total with 19 features instead.
In the second step of preparing the data, we gathered all our datasets and started by cleaning and removing unwanted data, missing values, rows, columns, duplication values, data type conversion, etc. Later, we split the data into two sets: a training set for Athens and a testing set for Thessaloniki.
In the third step of choosing the ML model and in order to understand those features, we explore the application of artificial intelligence in two machine learning methods: one is clustering the data into seven subcategories, and the other is classifying the medium sub-areas inside the akalyptos for social inclusion, whether it is for the inhabitant of the block, the neighborhood usage, or the public. To compare the results correctly, we run a clustering model o the 200 blocks and another on the 500 blocks and evaluate which performed better. For the classification: we run three shallow learning models: Logistic regression, XGboost, and Random first classifier, and six deep learning models ANN with different layers architecture, and since we have to do that process on the large dataset and the small one, we ended up running 12 classification models in total.
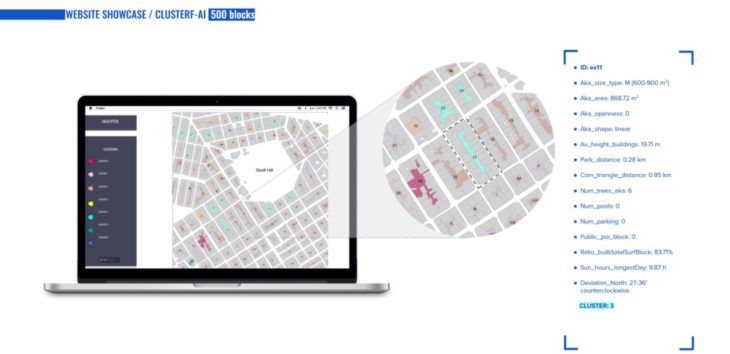
In the fourth step, these models were evaluated locally in Grasshopper by visualizing a parametric verified geometry and deploying the model on the Akalyptos of selected blocks from Thessaloniki. Finally, the result of the best-performing model would be used in an AI web app, where the users, like residents of the city, or planners in the municipality, can be aware of the current situation and the possible transformation to make better decisions for improving those spaces.
DATASET CREATION
The accuracy of the AI model is directly correlated to the quality of data used to train it. For example, in the Akalyptos Typologies, we labeled three categories: Size, Shape, and number of entrances into the akalyptos.
In the data preparation workflow, we wanted to start building reliable AI models based on clean data. Therefore, two main features were taken into consideration: the number of trees in the Akalyptos, as it plays a massive role in the environmental analysis of the uncovered spaces, and second is the height of the buildings as they affect the light, shadow, and wind circulation inside the akalyptos.
We observed on google earth the numbers of trees and applied them to the OSM data repository. For the height, we subtracted the value on the top of the roof and the street level value, giving us the total height of each building.
According to our observations, we also defined whether the uncovered space is used as parking or whether there are water features (such as fountains or pools) in the urban blocks’ open spaces and added this information to OSM data.
Dataset 200 Blocks/ 34 Features
Dataset 500 Blocks/ 19 Features
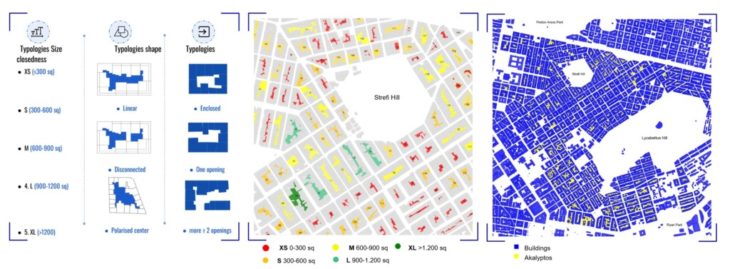

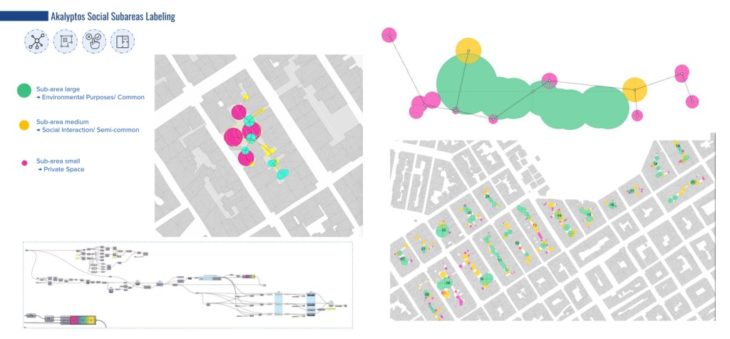
To create the subareas in the akalyptos, we based our work on a project thesis called Kemp, a digital participatory design tool for the Athenian blocks. They identify the small pockets of the akalyptos, which is what most of the pink area will be for private use. The shortest distance across the network creates joints. In these joints, circles would be generated with the shortest path radius to the boundary of the akalyptos. The result would be a variety of different sizes of circles intersecting together. We classify them into three categories: pink for private use and they all usually in the narrow edges, yellow for social inclusion as the medium sizes, and the most prominent circles become the green zones for the environmental aspects, to be either planted, added water features to improve the microclimate in the akalyptos space.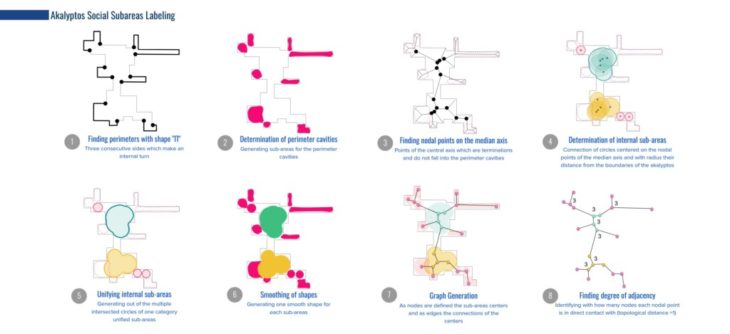
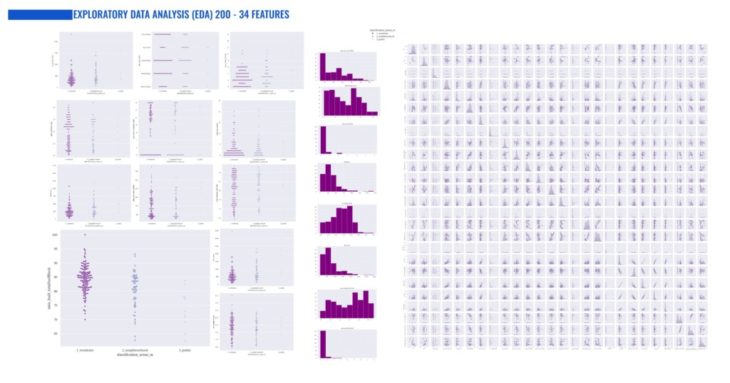
EXPLORATORY DATA ANALYSIS
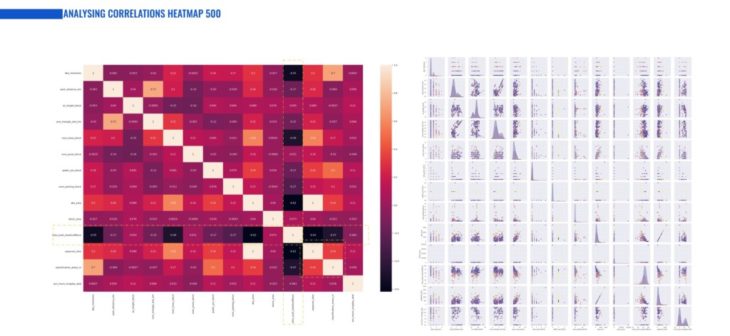
Pairs plots are a powerful tool to quickly explore distributions and relationships in a dataset to find patterns, relationships, or anomalies to inform our subsequent analysis.
The Residents’ sub-area generally represented the most in the dark purple color and has a more significant relationship with certain factors than others. For example, it positively correlates with the number of buildings, average heights, and distance to the park and city center. In contrast, it has a negative relationship with Akalyptos closedness, number of points of interest, number of parkings, and pools in the block.
The histogram plots show an approximate representation of the distribution of our numerical data. For example the numbers of pools in a block or the number of parking are not well distributed in our dataset, which means in the future it’s better include blocks that has more of these features to balance the dataset. While the average height and the distance to the city center features are well balanced.
We did the same for the 500 blocks but with fewer features. Here we observed that the Residents’ sub-area still represents the most in the cyan color and has a greater relationship with certain factors than others. For example, it has a positive relationship with the distance to the park and center, while it has a negative relationship with the Akalyptos closedness, the number of pools, and point of interest in the block.
In the histogram plots, although we increased the dataset with 300 blocks more, still we observe uneven distribution of some features in the dataset, like public point of interest in the blocks, and the numbers of pools. While the distance to the park and the commercial triangle, show better distributions. For most of the features this is something we also expected, since the blocks that have for instance pools are very few in comparison to those that do not.
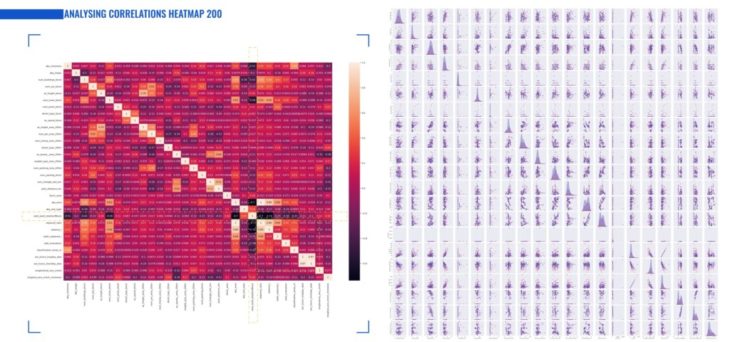
In the Heatmap of Pearson correlation coefficient matrix, where we can observe a graphical representation of the correlation between the different variables, we noticed that the ratio of the built area to the total surface of the block is highly correlated with the Akalyptos area in the 200 blocks/34 features. In contrast, the Large Subarea features negatively correlate with the Akalyptos area and the unpaved ratio feature. We also observed a high proportionality between the ratio of the built-up area with both the numbers of trees and the Akalyptos closedness.
In the 500 blocks/ 19 features Heatmap, we noticed that the ratio of the built area to the block surface is still highly correlated with the number of trees, the Akalyptos closedness, the Akalyptos unpaved ratio, and the classification medium area. That leads to considering the reduction of these features, which might disrupt the relationship among the variable evenly.

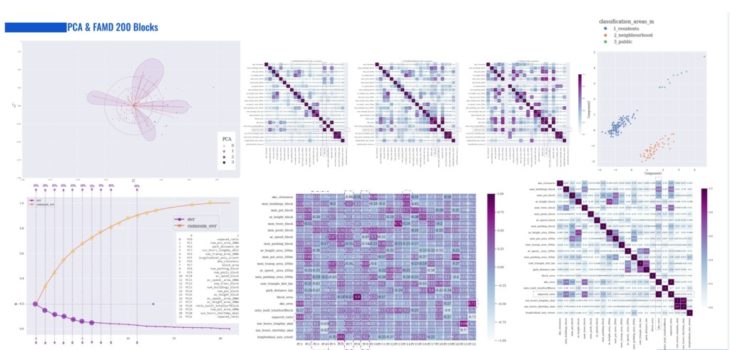
PCA & FAMD 200 Blocks
#Essential Features
In the following image, we can observe the most essential contributed feature to each principal component. For instance, the most critical contributed feature for Principal Component 0 (PC0) is the unpaved_ratio of Akalyptos space.
#Line Plot_ Variance Explained
We used the line plot to understand how many Principal Components we should retain in our training process to have a good representation of the data without adding unnecessary noise and thus to have a well-balanced dataset.
The orange line represents the cumulative sums or running totals used to display the total sum of data as it grows over time.
By plotting the “eigenvalues” on the line plot, we can observe that the first 12 PCs show the highest variation. PC0 explains about 20% of the data variance, the next one up to about 35%, and PC11 does not explain that much more. The purple line shows the remaining percentage (opposite representation of cumulative sums). In conclusion, we can remove PC11 to PC21.
PCA works only with numerical data. We could use the representation we get from our principal components analysis as our features because, technically, it is creating new features for us that combine different features with different weights.
#Biplot Principal Component (PCA)
We used Biplot for the following reasons:
- Find the main vectors of variation in our data. PCs are new variables that are a linear addition or factorization of the other variables, maximizing the variance.
- In PCA, a representation system is built centered at the intersection between the components, and the components become the axes. It is a flattened representation of our multidimensional data.
- The way the PCs are sorted is by their importance (i.e., PC0 explains much more variability in our dataset than PC3). If we want to compress our data without losing information, we should use the first ones that explain the most out of our data.
- The first two PCs will be most likely orthogonal (this is the case also in the graph on the next page) because they point in different ways (conversance-wise) and are not likely to be correlated.
- We can remove the PCs that are pointing in very similar directions (almost parallel with each other) in order to achieve dimensionality reduction.
- They are negatively correlated when diverging and forming a large angle (close to 180°).
#Principal Component Heatmap
With the Principal Component Heatmap we can:
- Understand the relationship between different principal components and input parameters and also figure out which feature informs the most each principal component
- For instance the block area is informing the most PC8
#FAMD
In the FAMD (Factor Analysis of Mixed Data), we can include both Numerical and Categorical input features.
In the first graph, we can observe a pattern using color hue and the classification of the medium areas of the akalyptos. We can see three clusters, as many as the categories of the classification of the areas.
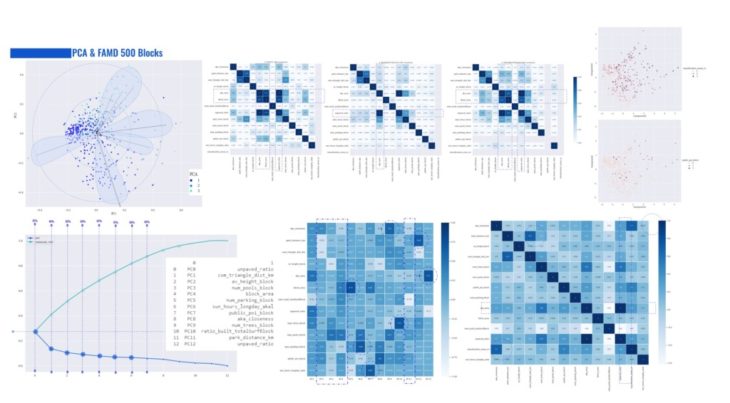
PCA & FAMD 500 Blocks
#Essential Features
The following image shows the most important contributed a feature to each principal component. For instance, for Principal Component 0 (PC0), the most essential contributed feature is the unpaved ratio of Akalyptos space.
#Line Plot_ Variance Explained
As explained before, we used the line plot to understand how many Principal Components we should retain in our training process to have a good representation of the data without adding unnecessary noise and thus to have a well-balanced dataset.
The cyan line represents the cumulative sums or running totals used to display the total sum of data as it grows over time.
By plotting the “eigenvalues” on the line plot, we can observe that the first 8 PCs show the highest variation. PC0 explains about 25% of the data variance, the next up to about 40%, and PC8 does not explain much more. The blue line shows the remaining percentage (opposite representation of cumulative sums). In conclusion, we can remove PC8 to PC12.
PCA works only with numerical data. We could use the representation we get from our principal components analysis as our features because, technically, it is creating new features for us that combine different features with different weights.
#Biplot Principal Component (PCA)
We used Biplot for the following reasons:
- Find the main vectors of variation in our data. PCs are new variables that are a linear addition or factorization of the other variables, maximizing the variance.
- In PCA, a representation system is built centered at the intersection between the components, and the components become the axes. It is a flattened representation of our multidimensional data.
- The way the PCs are sorted is by their importance (i.e., PC0 explains much more variability in our dataset than PC3). If we want to compress our data without losing information, we should use the first ones that explain the most out of our data.
- The first two PCs will be most likely orthogonal (as in the graph on the next page) because they point in different ways (conversance-wise) and are not likely to be correlated.
- We can remove the PCs that are pointing in very similar directions (almost parallel with each other) in order to achieve dimensionality reduction.
- They are negatively correlated when diverging and forming a large angle (close to 180°).
#Principal Component Heatmap
- With the Principal Component Heatmap, we can:
- Understand the relationship between different principal components and input parameters and also figure out which feature informs the most each principal component
- For instance, the block area is informing the most PC5
#FAMD
As we explained in the FAMD (Factor Analysis of Mixed Data), we can include both Numerical and Categorical input features.
Despite our excellent results in the FAMD Analysis of the 200 blocks, we cannot see apparent patterns in the analysis of the 500 blocks.
CLUSTERF-AI METHOD/ K-MEANS CLUSTERING
The method we selected to cluster/ group similar data is K-Means Clustering.
K-means clustering is one of the simplest and most popular unsupervised machine learning algorithms. Unsupervised algorithms make inferences from datasets using only input vectors without referring to known or labeled outcomes.
K-means aims to group similar data points together and discover underlying patterns. To achieve this objective, K-means looks for a fixed number (k) of clusters in a dataset.
A target number k needs to be defined, which refers to the number of centroids needed in the dataset. The number of centroids is an imaginary or actual location representing the cluster’s center. K-means algorithm allocates every data point to the nearest cluster while keeping the centroids as small as possible.
The process followed in K-means clustering is the following:
- Initial centroids are selected as many as inputs numbers
- Each sample is assigned to its nearest centroid
- New centroids are formed by taking the average of all the samples
- The algorithms repeat the last two steps until the difference between iterations is close enough.
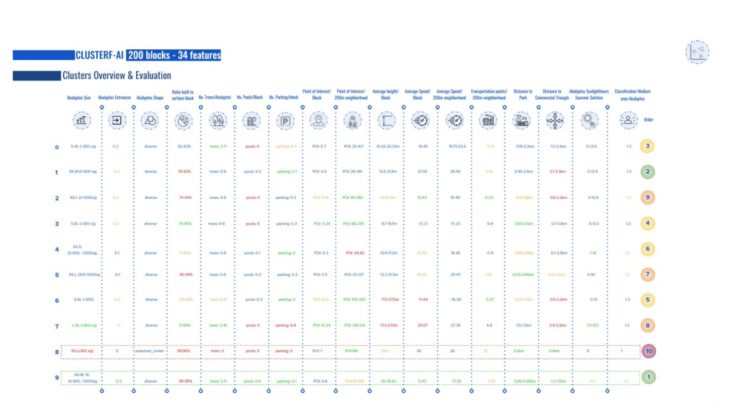
CLUSTERF-AI 200blocks – 34 features
Regarding the correlations of the input features of the 200 block, we can see from the Pearson correlation coefficient heatmap the followings:
The highest correlation we can observe between the sunlight hours of the longest and the shortest days of the year with 97% and the akalyptos area and the akalyptos size typology with 89%.
We can also see that the average height of the buildings in the block and the average height of the 200m show a high correlation (76%). In contrast, the distance to the park and the distance to the commercial triangle show a 72% correlation.
Furthermore, the Akalyptos size type has a 65% correlation with the number of buildings in the block, and the park distance and the average speed of the surrounding area of 200m show a 64% correlation.
Lastly, the Akalyptos area and the number of trees in the block have a 63% correlation.
As a next step, we defined how many clusters we should divide our dataset.
According to the graph Distortion Score Elbow for K-means Clustering, we divided our dataset into 10 clusters.

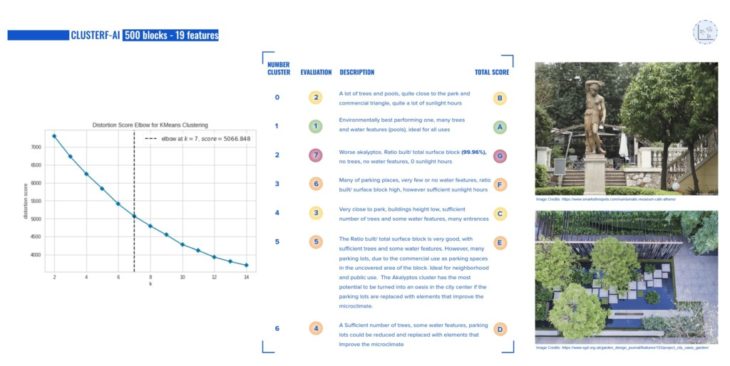
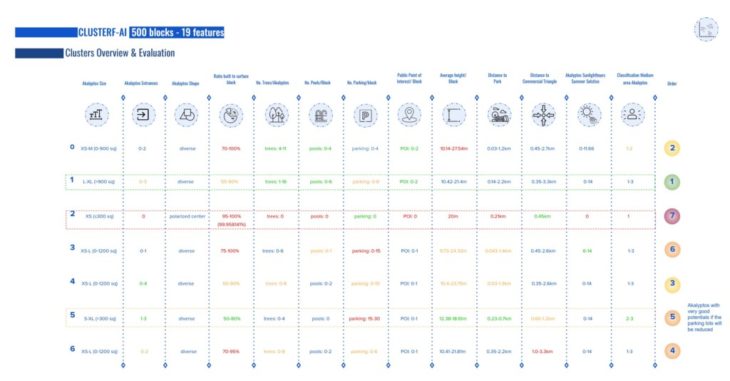
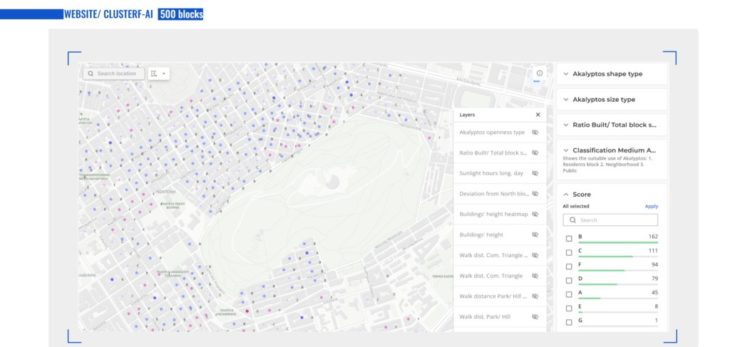
CLUSTERF-AI 500blocks – 19 features
CLASSIFICATION MODELS
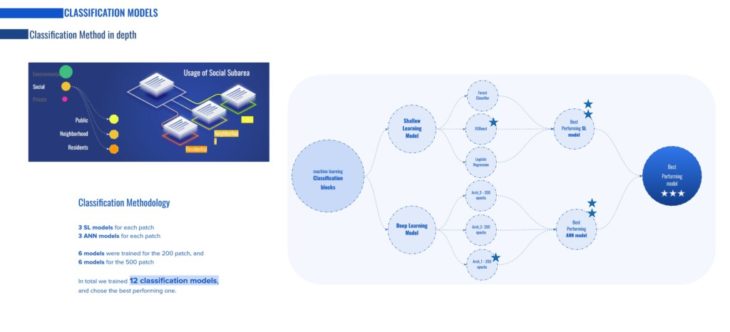
Classification Methodology
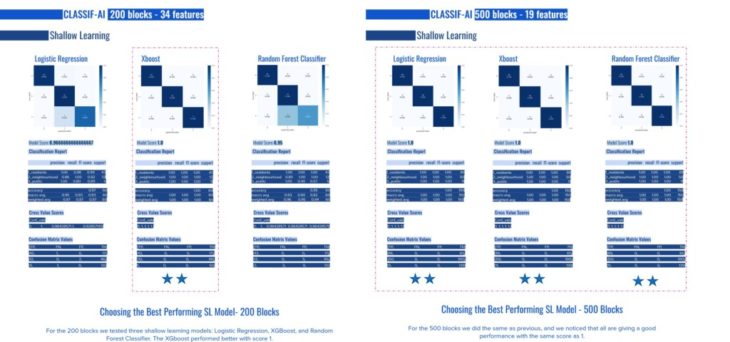
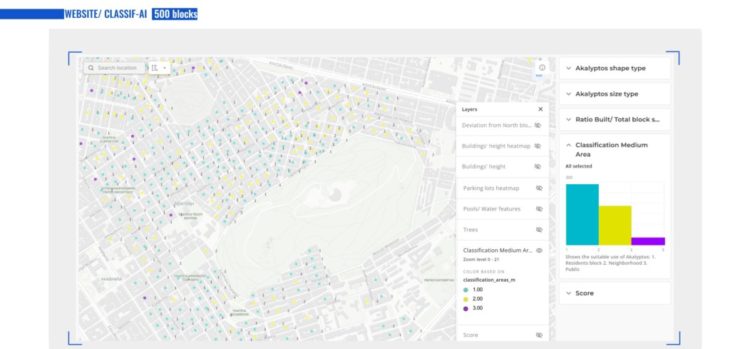
The other machine learning model we applied was classification, a supervised machine learning technique. In this project, we wanted to take the medium sub-areas that were generated in grasshopper to another level of organizing, so we decided to classify the medium sub-areas inside the akalyptos for social inclusion, whether it is for the inhabitants of the block, the neighborhood usage, or the public. To compare the results correctly, we run a clustering model o the 200 blocks and another on the 500 blocks and evaluate which performed better. For the classification: we run three shallow learning models: Logistic regression, XGboost, and Random first classifier, and six deep learning models ANN with different layers architecture, and since we have to do that process on the large dataset (500 blocks) and the small one (200 blocks), we ended up running 12 classification models in total.

DEPLOYMENT
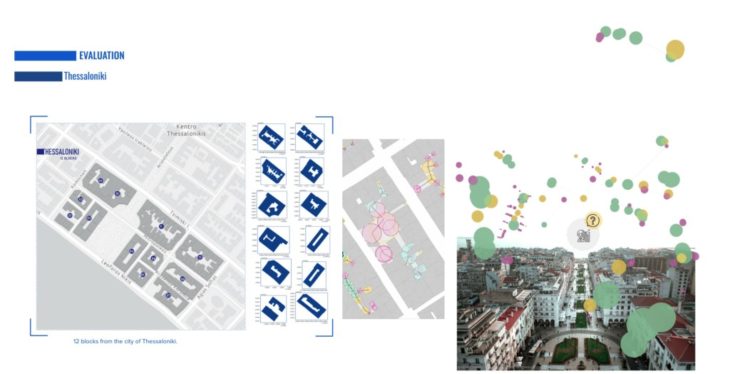
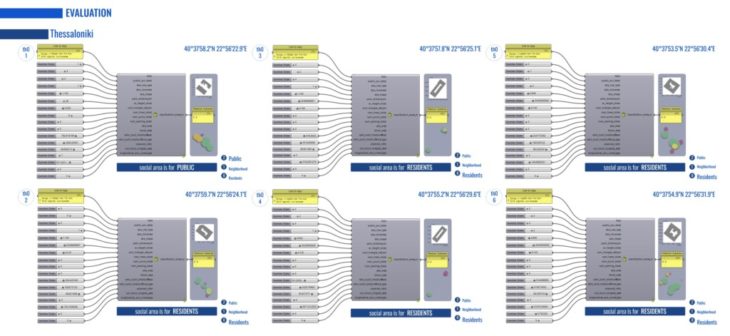
The goal of building our machine learning web application is to solve the city of Athens’s problems, opening up the way to solve similar issues in other cities. The machine learning model can only be effective if we can test it first and check if it delivers an accurate value to the usage of the medium sub-areas (yellow ones). So we deployed it locally using Hops in Grasshopper on the 12 new blocks from the city of Thessaloniki. Before we dived into the deployment results, we extracted the values of the medium sub-areas of those 12 blocks; then, we compared both values to determine whether they matched. The result was positive. All 12 blocks accurately predicted the usage of the medium sub-areas.

CONCLUSIONS
- PCA and quick model training were used to understand the different features added to the dataset and improve how to measure the confusing ones.
- For the clustering model, using more blocks with fewer features results in fewer clusters. For instance, for the 200 blocks with 34 features, we had to cluster them into ten categories, while for the dataset with 500 blocks and 19 features, we had to cluster them into seven categories.
- The main characteristics of the clusters in both models are the same, thus giving us very similar results.
- Both deep and shallow learning models for the classification with fewer features/ more data performed better.
- For the classification model, the shallow learning model performed way better than the deep learning one.
- For the SL of the 200 blocks /34 features, the XGboost performed best with a score of 1.0, leaving the Logistic Regression with a 0.966 score and the Random Forest Classifier with 0.
- While the SL for 500 blocks/19 feature, all the three models performed well with a score of 1.0
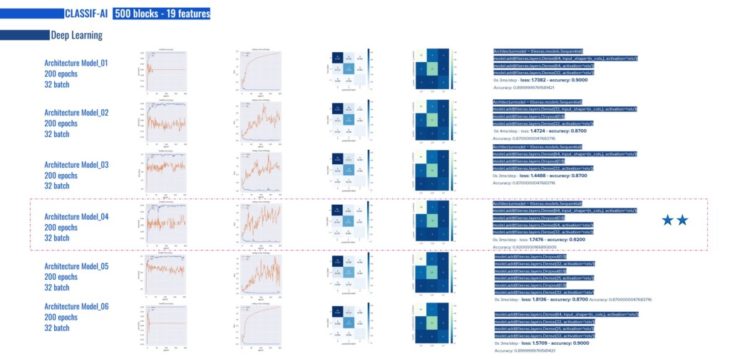
- The ANN Classification models had a worse performance with a range of accuracy of 0.57-0.70. The best performing algorithms with the 200 blocks/34 features was Arch_05, 200 epochs, and 32 batch, with an accuracy of 0.7000 and loss of 3.6310.
- The 500 blocks/19 features performed relatively better in ANN classification model Arch_04 with epochs, 32 batch, accuracy 0.9200, and loss 1.7476.
- In evaluating the Akalyptos of Thessaloniki, the model accurately predicted the usage of the medium sub-area.
FURTHER STEPS
- For the dataset creation, we would continue adding more real data of Akalytos to have an efficient model that works for the whole administrative boundary of the city. From previous experience and explorations with a similar type of machine learning, the SOM or Kohonen interpolation had introduced unrealistic values, hindering the model’s performance.
- The documentation of the data trees was based on observations from Google Maps. It could have been more accurate to be on-site and check each Akalyptos.
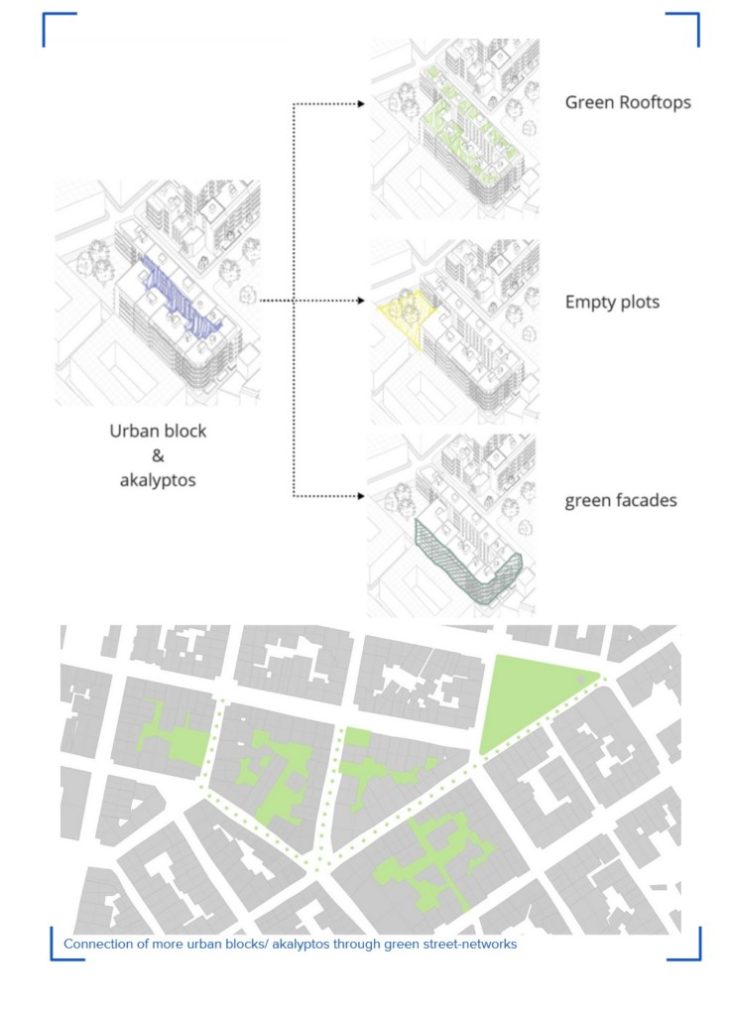
- In the future, we would like to include a classification model for the roofs to check the area and hosted shape for solar panels or green rooftops and identify ideal usage of those spaces.
- Some Akalyptos with higher elevations could be used for the Green facade to mitigate the heat waves in summer and add natural aesthetic values to the space.
- A possibility to connect the Akalyptos through pedestrian streets could activate the empty spaces in the blocks into connected green corridors.
- We would also like to run the wind analysis for every block and include this feature in our dataset.
- We want to train new models after removing the minor relevant features from the PCA to see if it improves the ANN models’ behaviors.
- Add more variety to features that are not well distributed, for example, the number of pools and parking in the block.
Re-thinking Akalyptos Space is a project of IAAC, Institute for Advanced Architecture of Catalonia developed in the Master of Advanced Computation in Architecture and Design 2021/22 Students: Jumana Hamdani, Maria Papadimitraki; Thesis Advisor : Angelos Chronis