Public Seating
Public Seating is an exploration of configurations and designs that can be generated based on descriptions identified by how people feel. A neural network was trained with a set of characteristics and ratings from a questionnaire as an input and the geometries were are the output.

Methodology
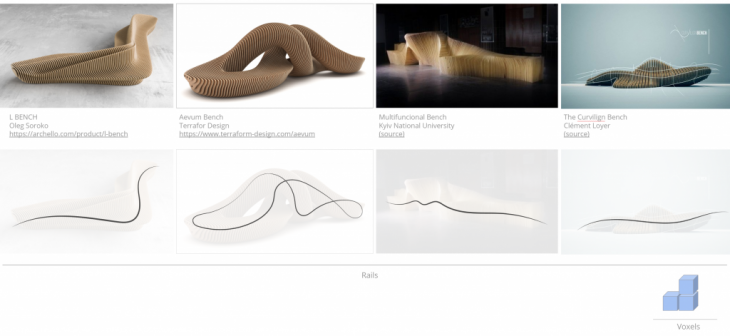
A study was conducted on existing examples. From the examples studied, we extracted the curvature of the rail and integrated voxel geometry.
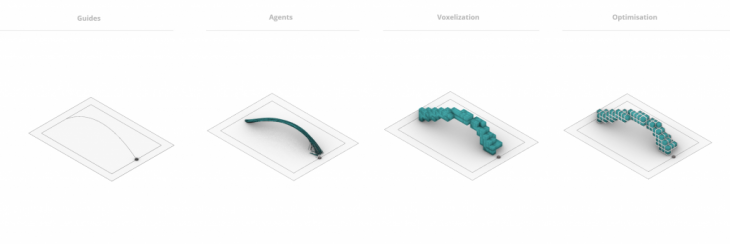
Shown below is a diagrammatic overview of how the curve leads to a design. Initially, guide-lines were set up for the benches, a set of agents was generated from the end points, which were then voxelised from the agents to generate the geometry for the seating.
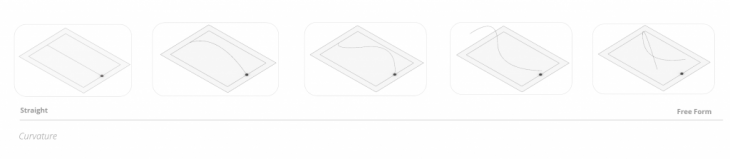
Different types of curves were used as guides; from a very simple setup with two control points to a more complex 3D curve with several control points. This will help get more variety in the design explorations, regarding overhangs or geometries that can facilitate more people as benches.
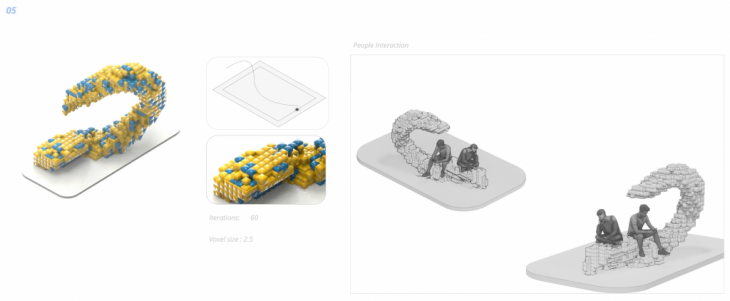
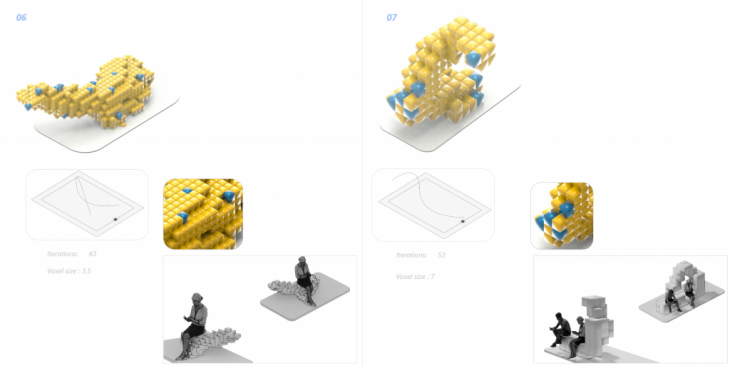
The setup below is an example with a simple guide curve. The agents revolve and move around the guide line, while the density can be increased, which will lead to a denser set of voxels at the end.

Different voxel sizes were tested to see how the geometry of the overall seating adapts to it.

Design Explorations
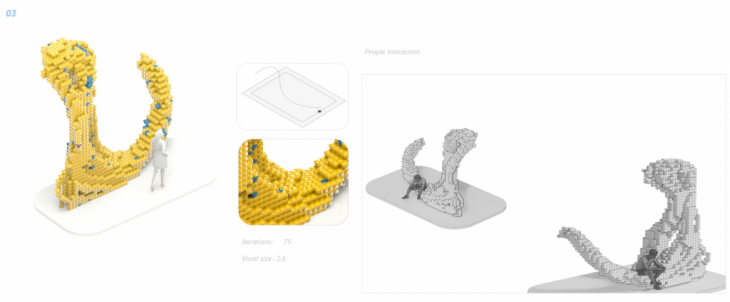
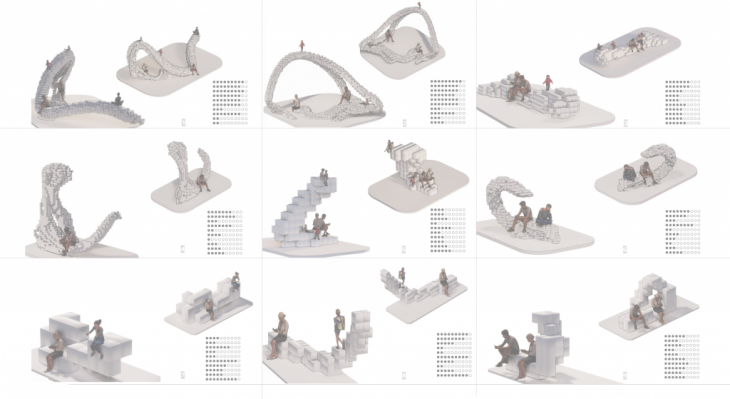
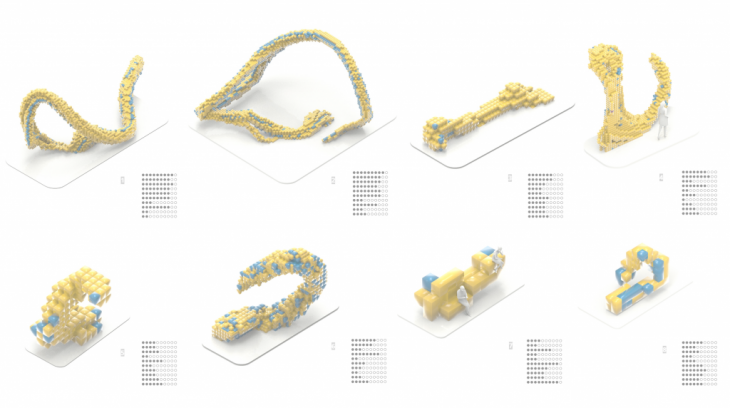
Below are a few design outcomes from the process described previously. Each image shows the curve used as a guide and the voxel size that the particular design uses. It also shows how the design immerses from these two combinations mentioned previously.
Several design outcomes are being explored, both simple and complex, different sizes of geometries and voxels.


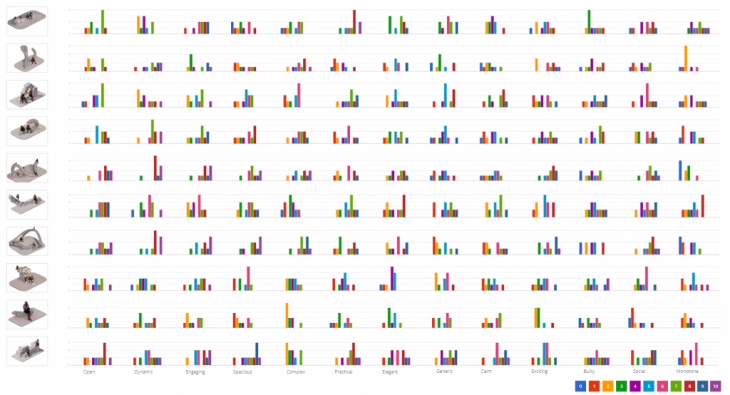
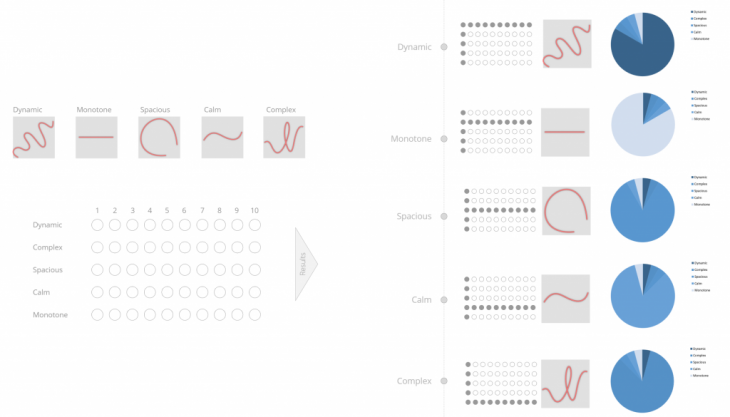
Questionnaire Structure
In order to train the network based on characteristics of the design, a questionnaire was created including the aforementioned designs. A set of descriptions was associated with each design that appeared on the questionnaire. Each description has a range from 0 to 10 and the participants were asked to rate each design individually.
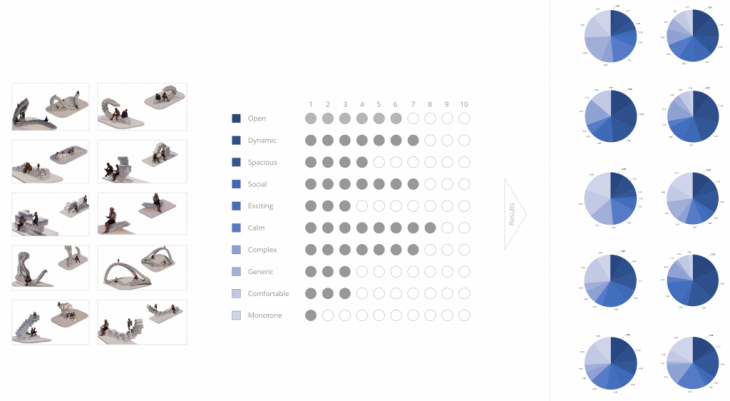
Below is a more detailed depiction of the results from the questionnaire showing the range of each description and how many participants gave that particular rating.
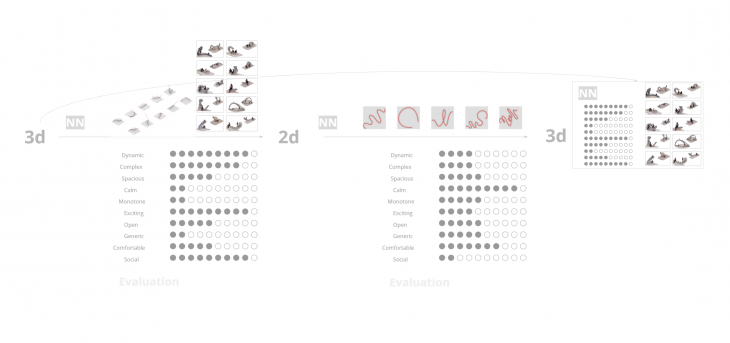
Training Methodology
The initial approach was to train the network with 3D curves. However, during the evaluation, the outcome turned out to be subjective. Therefore, it is difficult to understand if the network is useful or not. The next approach was to conduct the training by using 2d curves with clear descriptions. As such, the outcomes were comparable and easier to manage. The end goal is to go back to the 3D curves, by increasing the dataset.
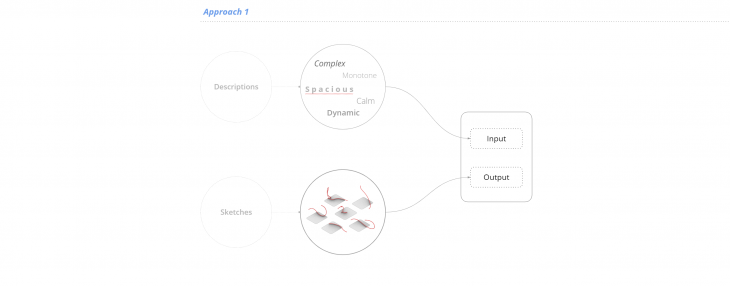
Approach 1 – Curves as an output // Approach 2 – Descriptions as an output
For the training the network, we tried two different methods by flipping the input and output for each one: For the first we use the descriptions as an input and the curves as an output and on the second one we do the opposite.
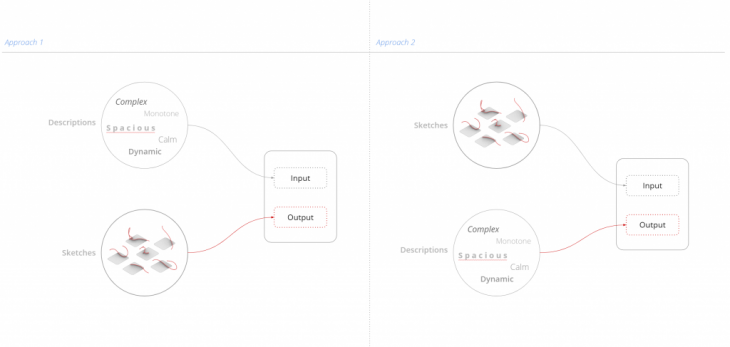
Approach 1 – Curves as an output
The first training is using the .csv file from the questionnaire as an input and the rail curves as an output. The curve was divided into 10 points which were then remaped in a tensorset with 10 tensors. Similarly we got the average values of each one of the questions regarding people’s reactions to them in the other tensorset using again 10 tensors.here we also see the neuron setup and the iterations it took to get to the minimum error levels.
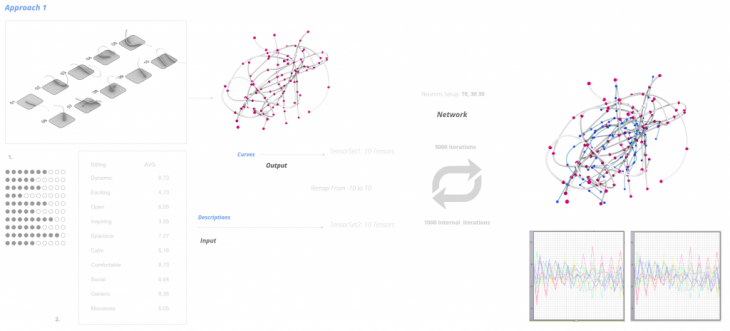
After the training, we move onto evaluating the network which means to ask the network to give use curves according to different input description parameters; for example; curves which are more or less dynamic, more or less open etc.
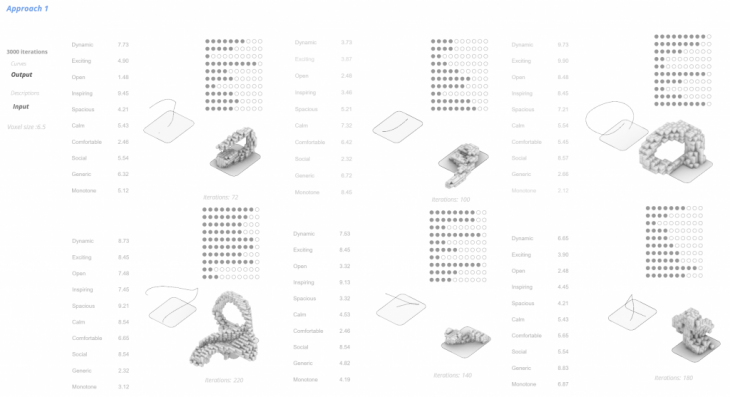
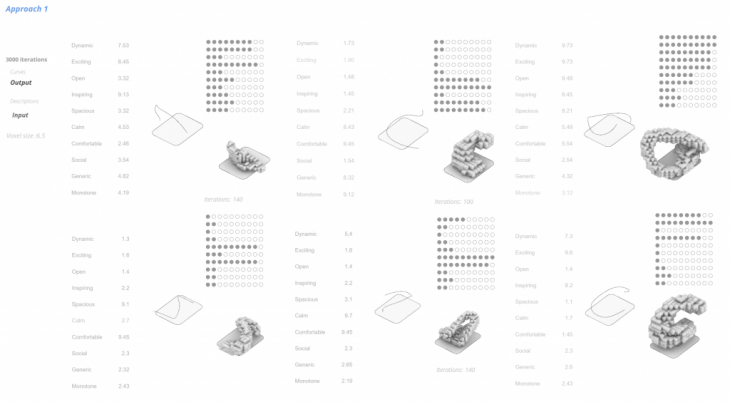
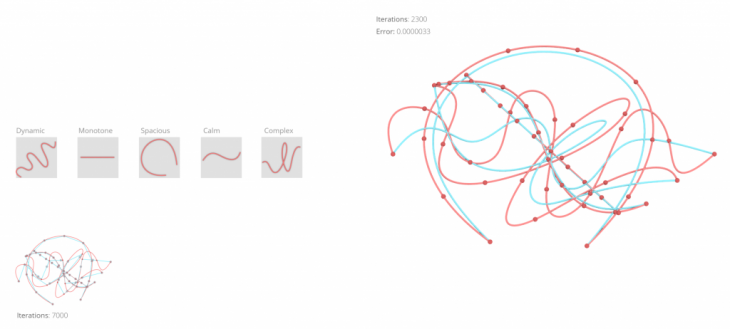
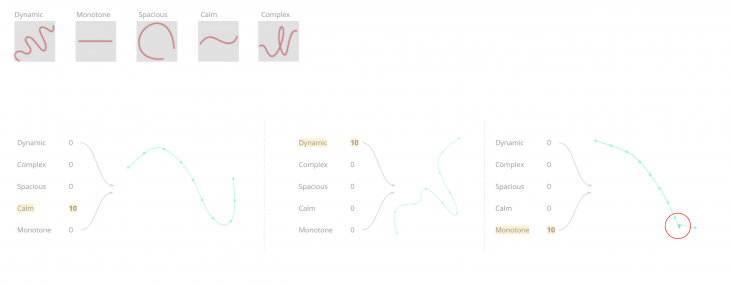
A different test was to keep all the values to a 5 and increase certain values to see how the output curves behave. The network is asked to output curves from 1-10 in dynamic and measure the step of deformation between the same points.

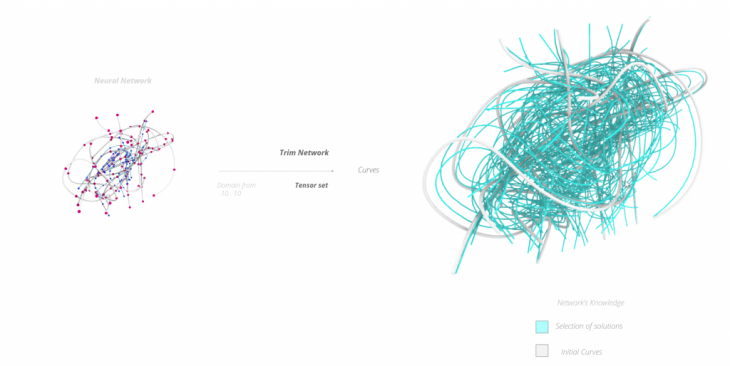
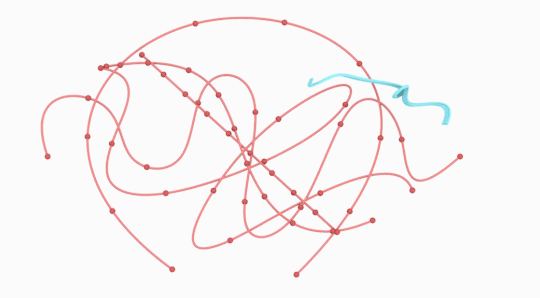
Below is a visual array of all the intermediate points in space and essentially the curves the network was exposed through learning process.
Approach 2 – Descriptions as an output
On the second approach, the geometry is the input and the descriptions are the output using the .csv file from the questionnaire.
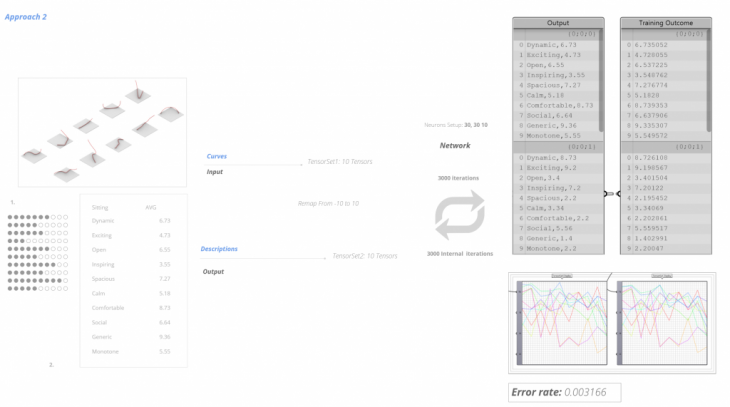
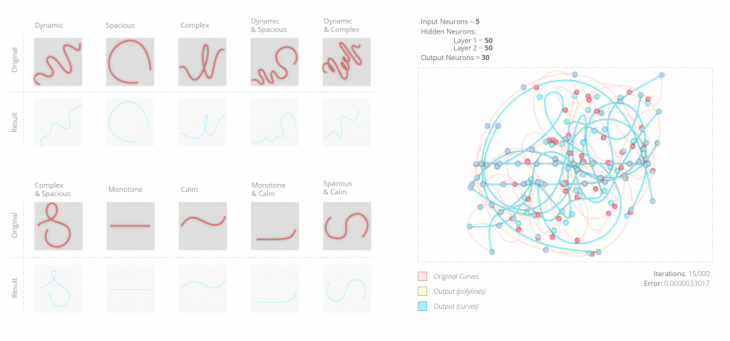
This is the original training. Below, the top row of images show the descriptions and ratings as we read them from the questionnaire results. The bottom row is what we get after the training. We notice some areas where there is a high discrepancy, which are highlighted in red.

After training the network (with descriptions as outputs), we input new curves to evaluate the training. These are the same curves presented in “Approach 1”.
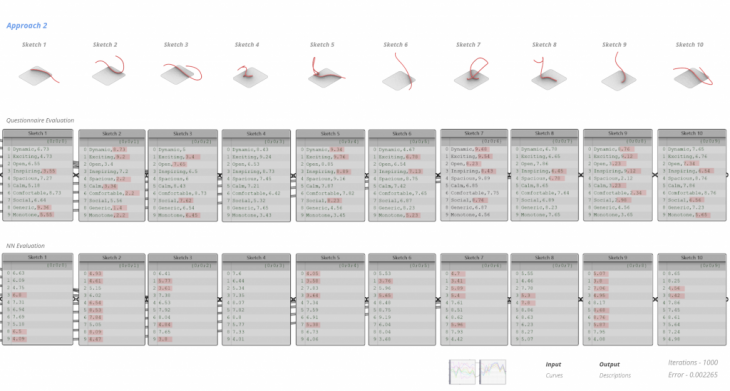
For “Approach 2” to work properly, the dataset would need to be much larger. For that reason, we continue with “Approach 1”, with the descriptions as an input and curves as an output.
2D Curves
The next tests were conducted by using 2D curves, which gave us more control over the training.

Five curves and five descriptions were used respectively. For every curve, one of the descriptions was maximized and the rest stayed at the same minimum value.
The five categories of descriptions are; dynamic, monotone, spacious, calm and complex. Below, there is a comparison between the initial curve and the training outcome.
To test how successful the training was, we conduct an evaluation. During the evaluation, it is possible to run into invalid results. This will determine if we need to increase the size of the dataset and repeat the training. In this case, we were required to do that.
The new dataset of rail curves consists of ten tensor sets. The initial curves are still part of the dataset with an additional five in-between curves, as shown below. In the new items of the dataset, two of the descriptions are on the maximum value and the rest are minimum.

The training runs for 15,000 total iterations. Below we see the original curves and the training result. We increase the iterations or number of hidden layers to test the accuracy.
Similarly to the previously explained method of evaluation, we run test the training results once again as demonstrated below.

It is possible to explore different outcomes by using any range number between 1-10 for one or more descriptions simultaneously and explore the output curve.
3D
After testing what works on the 2D curves and how it can be managed, we are interested to further explore what possibilites we can get from going back to a dataset that consists of 3D curves.
Public Seating is a project of IaaC, Institute for Advanced Architecture of Catalonia, developed at Master in Robotics and Advanced Construction in 2019-2020
Students: Alexandros Varvantakis, Gjeorgjia Lilo
Faculty: Mateusz Zwierzycki
Faculty Assistant: Soroush Garivani