HOTSPELL
Concept:
The aim is to draw people’s attention to temperature change over a period of time. With this project it will be possible to analyse the temperature levels of the world over the past 120 years and also the constant changes occurring with our climate in different regions.
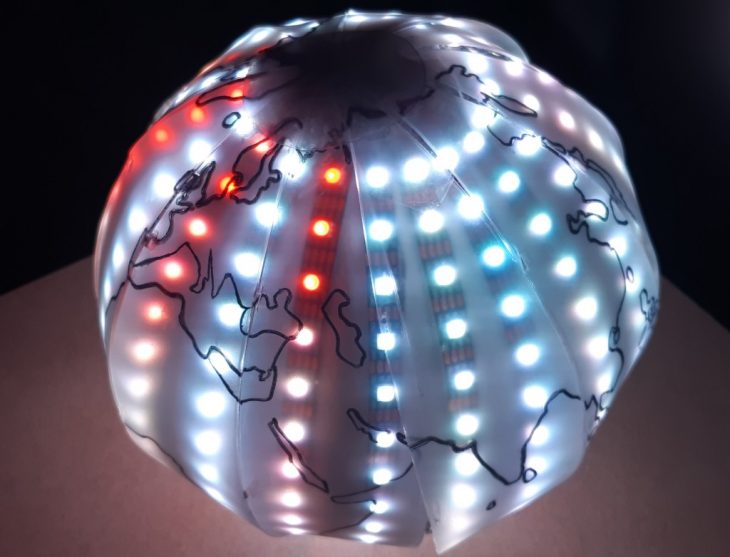
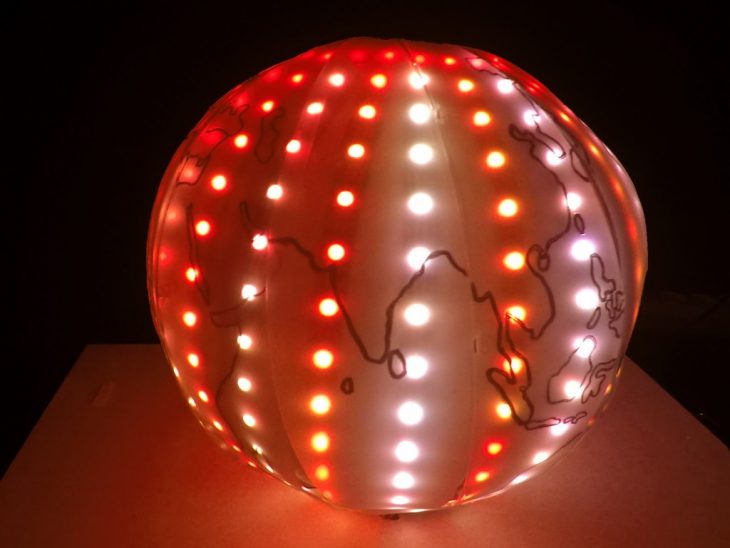
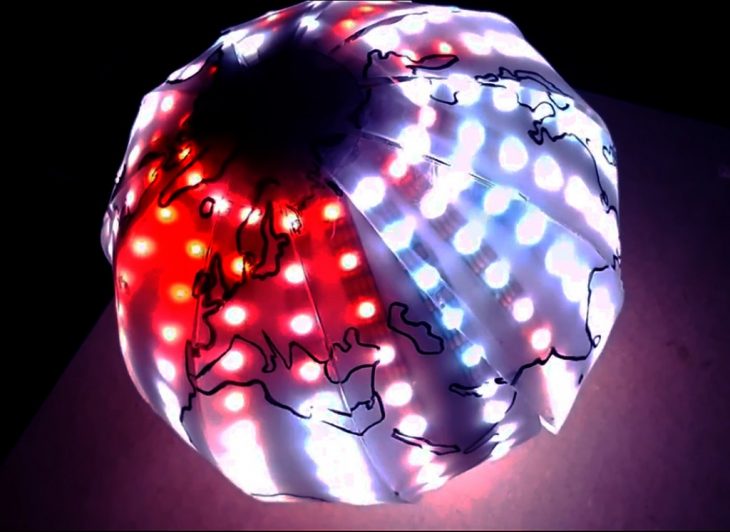
It is a sphere made of LED strip lights that take the data about the temperature changes around the world and displays it in a spectrum of colors ranging from blue to red (coolest to warmest) of 5 critical years in a lapse of 30 years ranging from 1897-2017.
Input: Climate data of the World
Output: Light globe
Seventeen of the 18 warmest years in the 136-year record all have occurred since 2001, with the exception of 1998. The year 2016 ranks as the warmest on record. (Source: NASA/GISS). To make people aware about the drastic climate transformation, we made a LED globe indicating the change in temperature due to evolution in the hierarchical system of settlements.
Construction:
A linear strip of Neopixel LED is cut into 20 strips comprising of 15 Leds each and stuck on a thermocol sphere in equal intervals. After fixing the lights in place, a polypropylene sheet traced with the map of the world is capped over the sphere with lights.

Presentation:
The climate spectrum globe displays temperature changes of the 5 most critical years –
- 1907
- 1934
- 1961
- 1988
- 2017
Arduino Code
The process involves analyzing the climate data of the world and is mapped using processing code which is then converted into a spectrum of colours; the particular attribute being LED.
