‘PLUGIN POTENTIAL’ Dashboard
An approach for obtaining, curating and visualizing urban data.
INTRODUCTION
21st century cities are exponentially displaying cases of programmed obsolescence and development opportunities. The current framework of the construction industry is highly unsustainable. One way to regulate this industry is an attempt at adopting the principles of urban mining. Conversely, our project for the studio internet of buildings explores the possibility of Plugin Facades, a new urban configuration, informed by the circular re-use network. We used our learnings from the digital tools and big data sessions to sort and analyse the data on materials in the city; we also focus on creating a dashboard application to present and allow users to interact with a data set relevant for the studio project by exploring the basics of computer vision and the potential of machine learning for urban analytics and planning.
AIM
To create a dashboard exploring urban mining and plugin potential by creating geolocated material distribution maps, identifying relevant interconnections and proposing opportunities for impactful urban scale reuse strategies.
GOAL
To form a consolidated body of knowledge establishing buildings as urban material banks in an interconnected network of physical and informational circular infrastructure using a digital interface based on computer vision and machine learning that enables building material data collection from standardised online street captures.
ROLE OF DATA
For this project we extract, clean, edit, and visualise data using many different tools. This is analogous to the many tools we have been exposed to in the MaCT program. Not only were we shown different data analysis tools, we were taught to understand how to use these tools in conjunction with one another to achieve outputs; this is what the following will represent.
METHODOLOGY
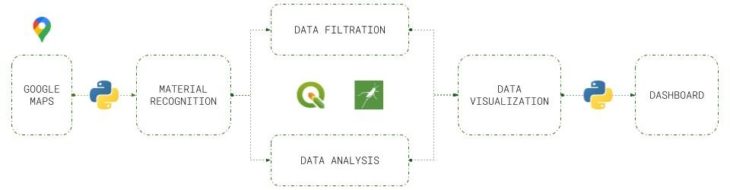
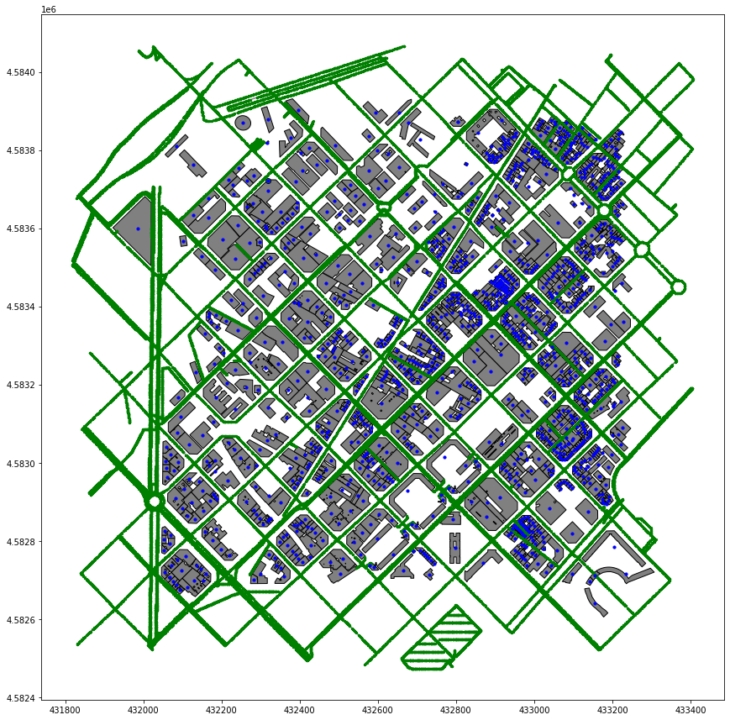
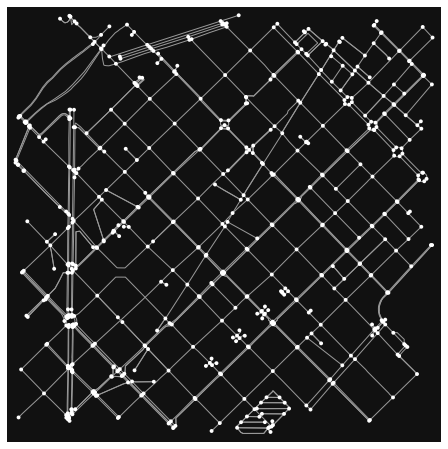
The methodology revolves around extracting data from a machine learning algorithm developed by Hesham Shawny to create an open source dashboard that visualises urban analytics surrounding the face materiality of Barcelona. The foundation of the script is a node point in lat-lng format along with the radius to query data, using osmnx library we retrieve data (street networks and buildings) from OpenStreetMap’s. From this point we run a closest point analysis for projecting building centroids to the street network, calculate the bearing value from each street point, and measure the distance between that point and the building edge. The next step is to retrieve images in order to obtain their façade material calculation; this is done with Google street view. Images are converted to material label using pix2pix mode, the predictions are done using a pre-trained model The image is specified using request parameters. The script is designed to help us in developing and extracting a material data frame in csv format that comprises all nodes, buildings, street networks, façade material, and percentages ready for further analysis.
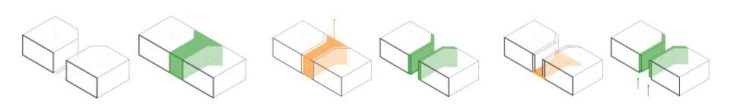
PLUGIN POTENTIAL: BARCELONA
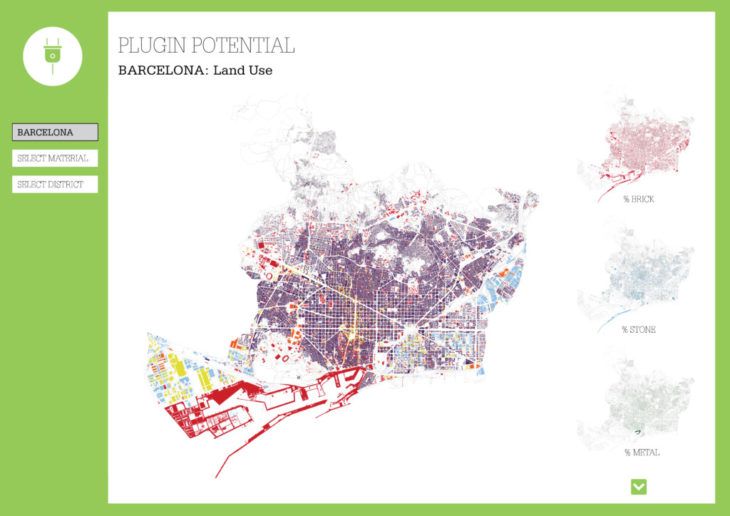
The plugin potential dashboard visualises materiality of facades across Barcelona and curates it into a platform that helps the data visualisation and referencing for urban understandings. The primary task of the dashboard is illustrating the relationship between percentage of façade material and the use of the building. The user can navigate the dashboard in two ways; by either selecting a material or by selecting a district. The Users can freely extrapolate data based visualisation for material clusters, percentages, availability and current land use by tweaking their search criteria’s. For visualisation purposes we have chosen to show the path where a user selects a district, for example, Sant Marti.
PLUGIN POTENTIAL: SANT MARTI OVERVIEW
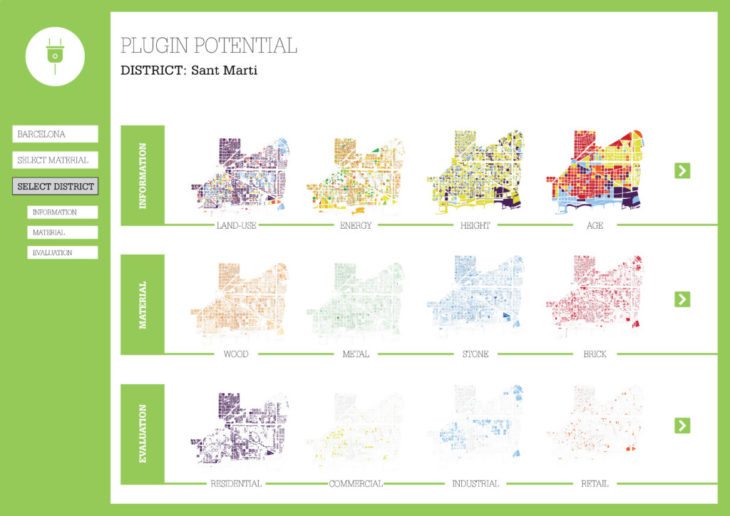
By selecting a district, the platform curates all data visualisations that are necessary for a potential plugin development into three main categories, ‘Information’, ‘Material’ and ‘Evaluation’. The figure above shows the landing page for the district of Sant Marti. Each category has more than one set of analysis that can be viewed by clicking on the maps or the ‘more’ button. The relevant maps under the information category come from open data BCN. The exposition of material maps are a result of the machine learning algorithm and the evaluation maps come from the grasshopper analysis and optimization of particular sites. The dashboard offers users a curation of material availability data in absolute percentages.
PLUGIN POTENTIAL: SANT MARTI OUTPUT
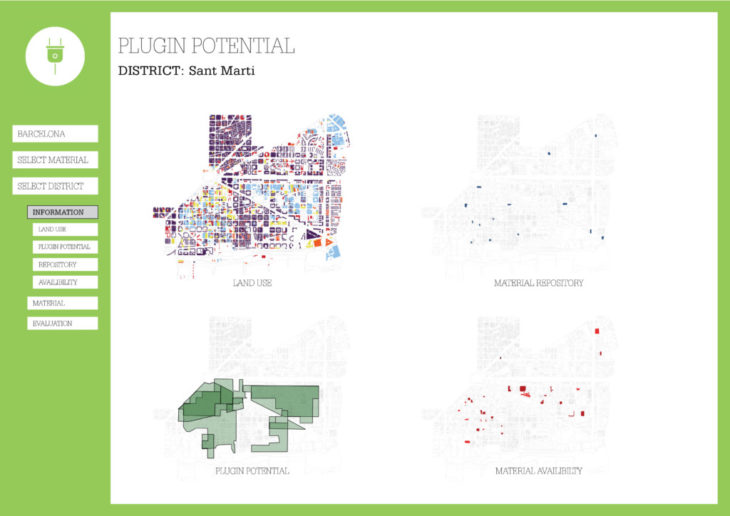
This depicts what happens when a user chooses the ‘Information’ category; they are able to see and interact with all of the maps within this category for the development of the plug-in. By choosing one specific map, the user is then able to see the data itself; for example, information on each of the waste collection & fabrication centres, as defined in the ‘Material Repository’ map. When a user chooses the ‘Material’ category, they are presented with a map for each material for the district with the material percentage for every building.
PLUGIN POTENTIAL: ANALYSIS
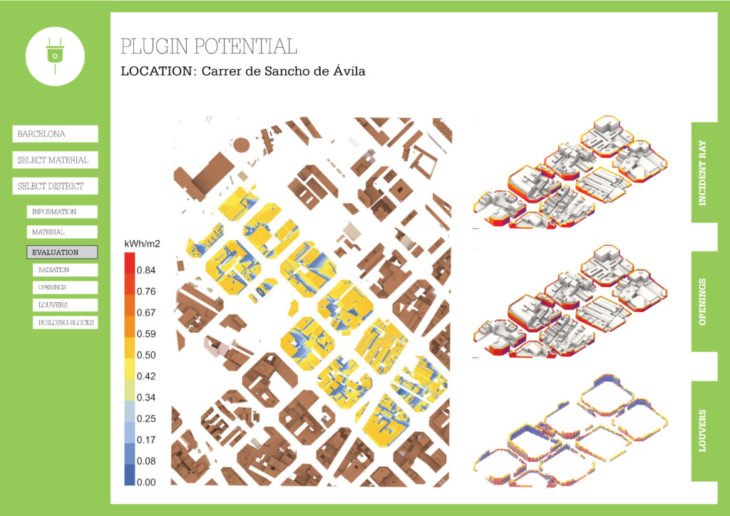
This depicts what happens when a user chooses the ‘Evaluation’ category; the user can visualise the results of several performance analyses run over the choice of their particular location. These include, radiation analysis, wind analysis and opening and louvre optimization. These analyses and their results cumulatively illustrate the potential spaces that can be used to host a facade plugin. Furthermore, users can find in depth data of their building blocks, its current materiality, nearby urban mining practices, waste collection centres & fabrication centres, active construction and demolitions.
CONCLUSION
In summary, the visualisations of the dashboard all were created with the data extracted from the Google API. The user is able to see maps of the land use, the materials and buildings themselves, as well as some basic analysis for a specific area of interest. All of this is relevant in the context of urban mining; to have a comprehensive but accessible approach to the subject, it is necessary to compile this information for easy analysis. The functionality of the dashboard will allow users to interact with each map; they can see details on material type, percentage, and location, akin to the information in the original csv file extracted. To conclude, this dashboard is a tool for urban mining, to study and analyse the materials and buildings that make the city.
‘Plugin Potential Dashboard’ is a project of IAAC, Institute for Advanced Architecture of Catalonia developed in the Master in City & Technology 2020/21 by Students: Julia McGee, Parshav Sheth, Weronika Sojka and Faculty: Diego Pajarito & Faculty Assistant: Tugdual Sarazin