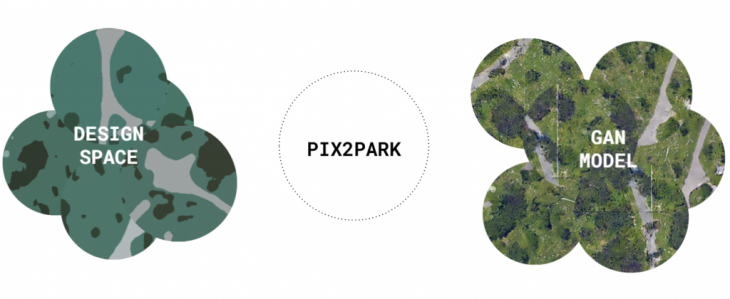
The PIX2PARK project sets out to explore the relationship between generative models, specifically the Pix2Pix model developed by Isola, Zhu, Zhou and Efros at Cornell University, and computational design tools that are already part of the architectural practice, such as Rhino and Grasshopper. The Pix2Pix model allows us to compare two images, A and B, where A is an original and B is a segmented version of it. Depending on the logic of the segmentation, as designers we can feed either A or B to a trained model and get its opposite as a result. The PIX2PARK project aims to train a model that can take a segmented image of a park generated in Rhino/Grasshopper and convert it into a photorealistic one. Our goals were divided into four:
- To develop an original dataset, which would allow us to explore and understand the underlying process of data collection and processing.
- To deploy a generative model along with a computational design tool with a seamless integration.
- To understand the limitations and flexibility of the Pix2Pix model hyperparameters as applied to our dataset.
- And finally, to generate a project as a proof of concept.
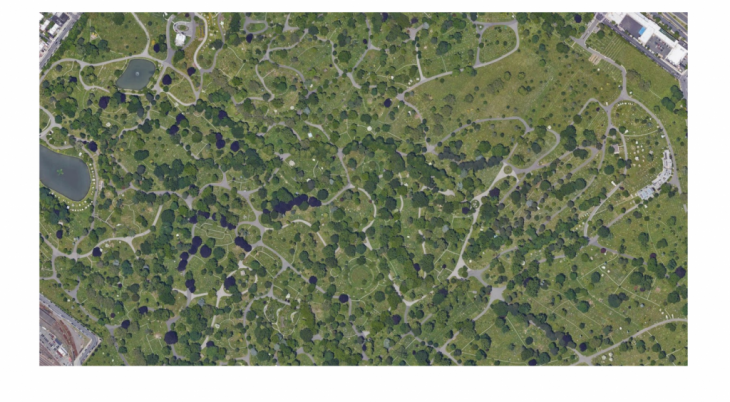
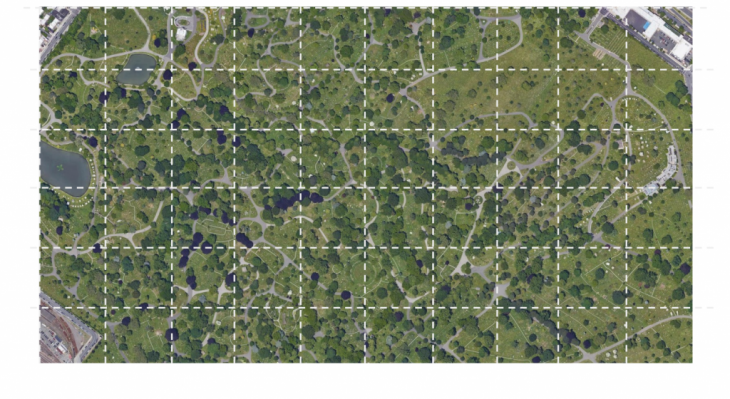
Site selection and original data extraction
We started by selecting a site, the Greenwood Cemetery in South Slope, Brooklyn which lays a few blocks south of the famous Park Slope, designed by F. Olmstead. The cemetery is a classic example of 1800s parks throughout the American northeast, and it emulates a naturalistic park-like landscape in the then established English manner. We extracted a high-quality satellite image that was cropped into 256×256 pixels images, as it is required to fit the Pix2Pix model, which resulted in 160 square images. However, this was still a limited set of data therefore we began to apply strategies of data augmentation such as flipping and rotating using the OpenCV and Scikit-learn libraries which resulted in 1100 original images.

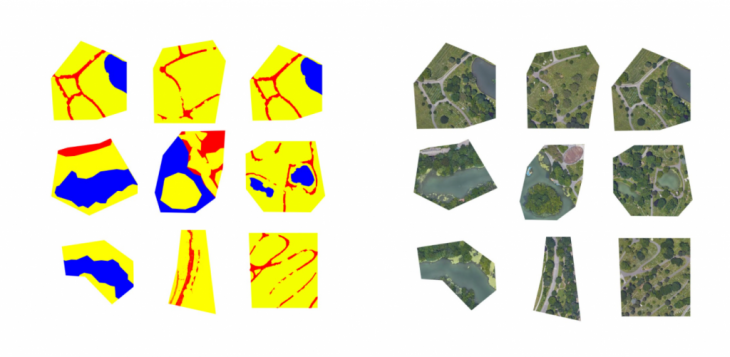
Initial segmentation
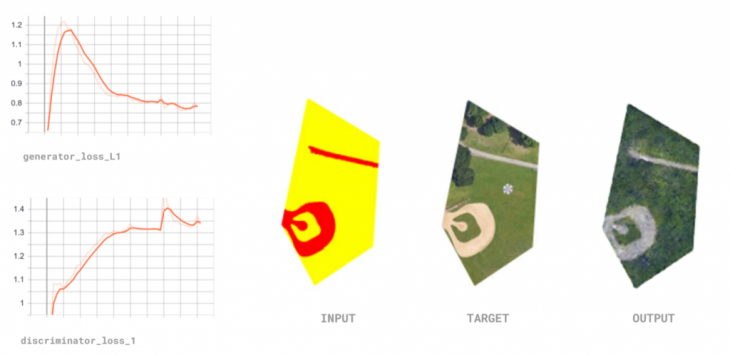
We did our first trial at segmenting our images manually, providing a clear and simple segmentation protocol limited to three colors: Blue-Water, Red-Pathways, and Yellow-Greenery. The results were surprisingly good, where the benchmark model, as published by Isola et. al, was able to learn the difference between the segmented parts. However, our segmentation protocol had a critical flaw, it did not discern trees from grass and therefore the model was not able to do so either.
Second Pass at segmentation
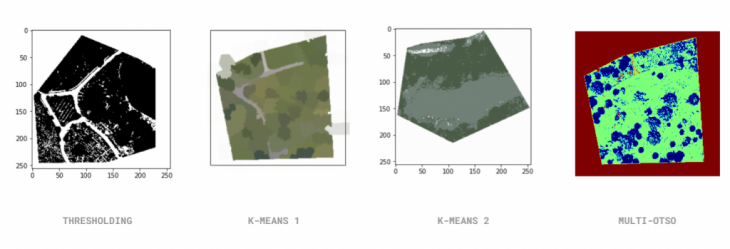
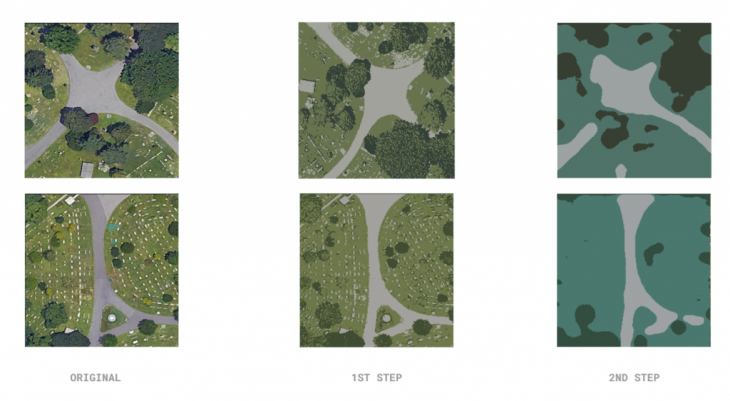
Considering that for our purposes we wanted a clear separation between trees, grass, water, and pathways, we began exploring how to automate our segmentation. For this, we experimented with four different methods of filtering with OpenCV and Scikit-learn: Thresholding, by which we hoped to define the edges of each object in the picture but was not sensitive enough to provide definition considering the close range of color in our target images. Two kinds of K-means clustering, which were either too complex to repeat in our design space (Rhino and Grasshopper) or otherwise oversimplified the landscape. And Multi-Otso, which was not able to differentiate between grass and pathways. We realized that we needed a two-step process, one in which we first applied a K-means clustering that would differentiate between trees, grass, paths, and water, and finally an averaging OpenCV filter that would further segment and normalize the colors in each section of the image.
AI TRAINING
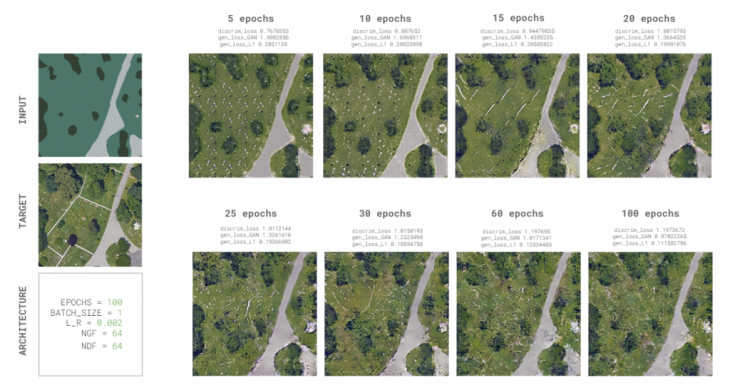
To understand how our data was interacting with the benchmark model, we ran a training with 100 epochs that would output images at every 5 epoch intervals. From this exercise, we could visually analyze at what point had our model reached an optimal visual output. We decided that 30 epochs were the number that provided clear enough results, especially because from then onwards the output images began improving at a slower rate without adding more value.
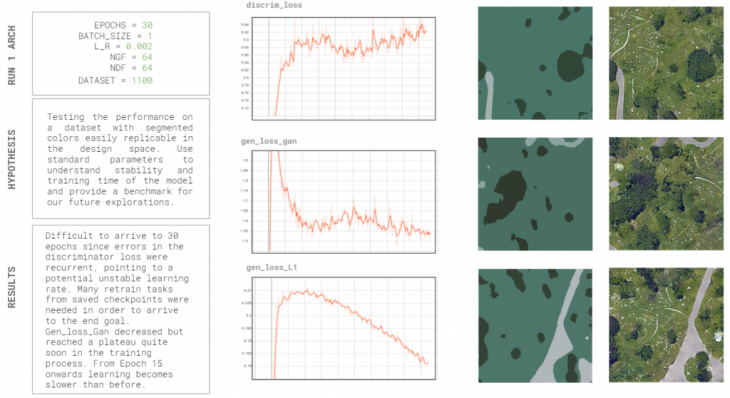
Test 1 : Benchmark run
Our first test made use of the standard published hyperparameters in the original Pix2Pix paper, with an architecture of 64 layers for the discriminator and generator, a learning rate of 0.002, and at 30 epochs as defined on our first training. We wanted to understand the stability and training time of the model, as well as provide a benchmark for comparison for our future tests. The results showed an unstable model; it became difficult to arrive at 30 epochs and got multiple discriminator loss errors. We resorted to using checkpoints for training, which made it difficult to extract graphs, and it took over 2 hours to finish the training.
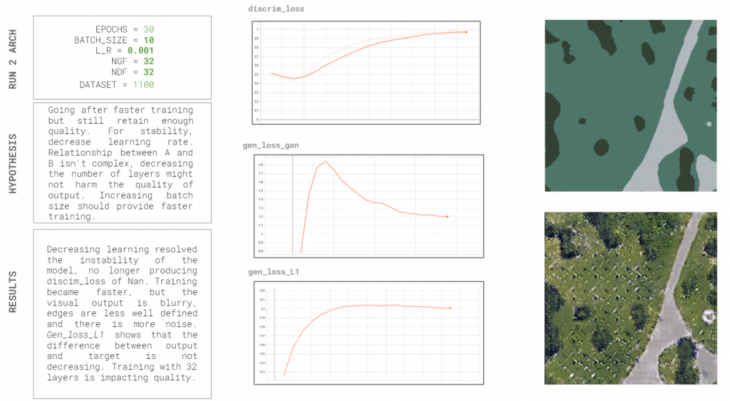
Test 2: Faster training
To arrive at a faster training, we lowered the learning rate by half, to 0.001, and increased the batch size of our model. We hoped that by having a slower learning rate the model could be more stable, but that by increasing the batch size it could be faster. We also lowered the number of layers for the discriminator and generator since the relationship between the original and segmented images was not too complex. The results showed that indeed by lowering the learning rate we were able to stabilize the model, however the changes in other hyperparameters resulted in unsuccessful visual outputs. We believe that this was the result of lowering the generator and discriminator layers.
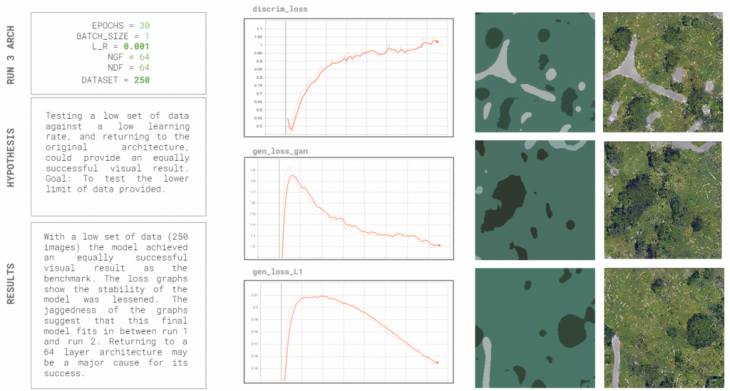
Test 3: Less data
We thought that if we returned to the original number of layers for the discriminator and generator, but still lowered the learning rate, we could get a stable model with good results. However, had we decided to use our full set of data the training time would have doubled to 4 hours. With our aim being speed, we figured that maybe we did not need our full dataset to have the model learn the relationship between the original and the segmented images. This final run showed a successful visual output, was a much more stable model than the benchmark model and reinforced the idea that properly segmented data can be used to train the Pix2Pix model for our purposes.
Training conclusions
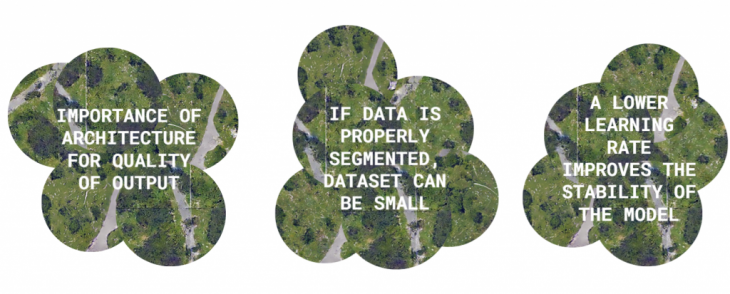
- For a tool to be useful, it must be easy to use. Our main goal with stabilizing the model was exactly this. We believe that by altering the learning rate we managed to achieve an improved stability.
- The depth of the architecture of the original benchmark model was necessary for our dataset to achieve a good visual output.
- If the dataset is segmented with a simple protocol that discerns between all desired elements, and the images are not too complex, then the dataset can be quite small.
PROOF OF CONCEPT
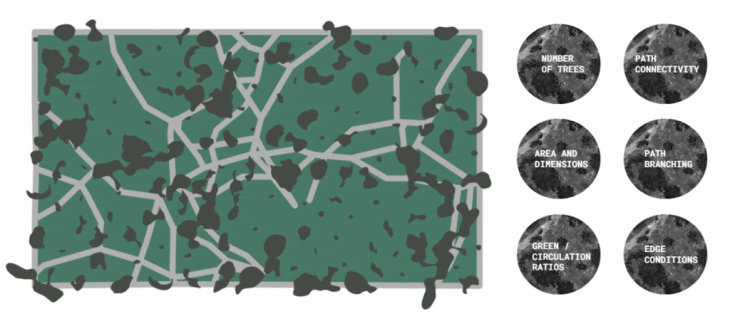
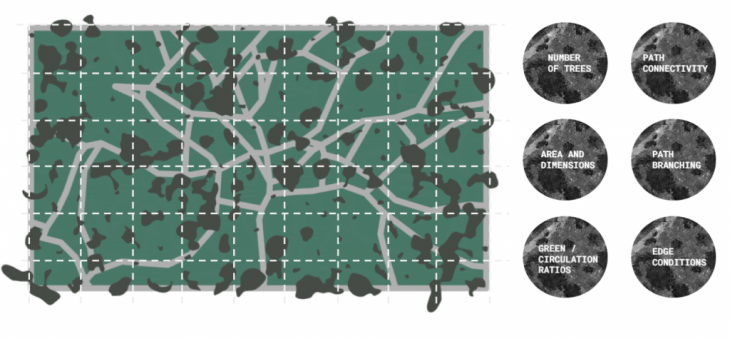
We developed a grasshopper script that included certain parameters, such as number of trees, path connectivity, path branching, edge conditions, etc. From these, we could get multiple iterations for the proposal of a park intervention at a given rectangular site. The grasshopper script was designed so that the output of each iteration would visually match the required input for our PIX2PARK model. These images were then cropped and separated through a python code, and then fed into the PIX2PARK model.
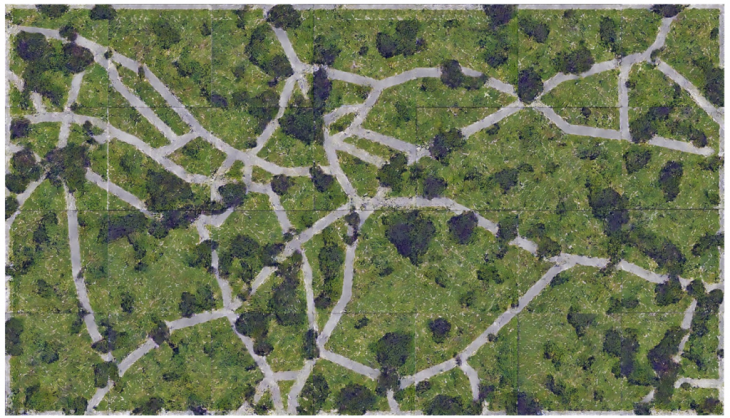
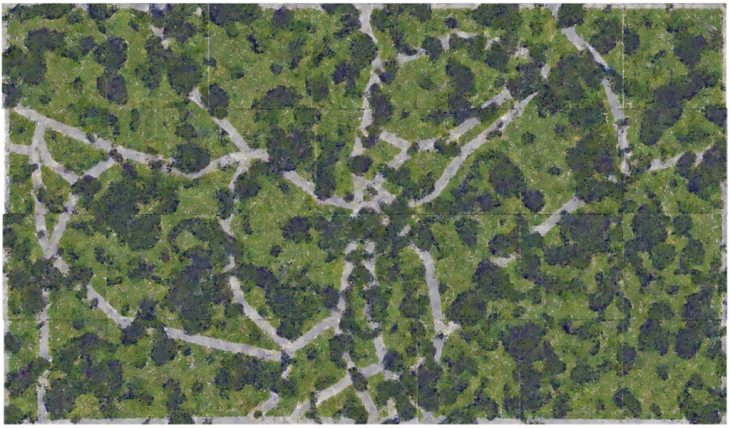
Although the output results are not precisely photorealistic, there is a certain aesthetic quality that is pleasing. The output images exist between satellite photographs and oil paintings, providing both a believable and affected presentation style.
‘Pix2Park’ is a project of IAAC, Institute for Advanced Architecture of Catalonia developed in the Masters of Advanced Computation for Architecture & Design 2020/21 by Students: Joao Silva and Cami Quinteros and Faculty: Stanislav Charou & Oana Taut