Introduction
Pandora is an intervention to work with unseen energies in our environment – the sensorial forces amongst which we exist, but which are rarely acknowledged in architectural design. These forces include infrasonic frequencies, magnetic fields, chemical flows… here, we focus on exploring the thermal energies present in the site of Les Tres Xemeneies de Sant Adrià de Besos, a half-deconstructed former power station on the coastline above Barcelona.
Although the site is currently uninhabited by humans and contains no energy infrastructure, the geometry and material of the building’s shell create a thermal footprint which sets in play a dynamic interaction with its environment and the more-than-human creatures that make use of it.
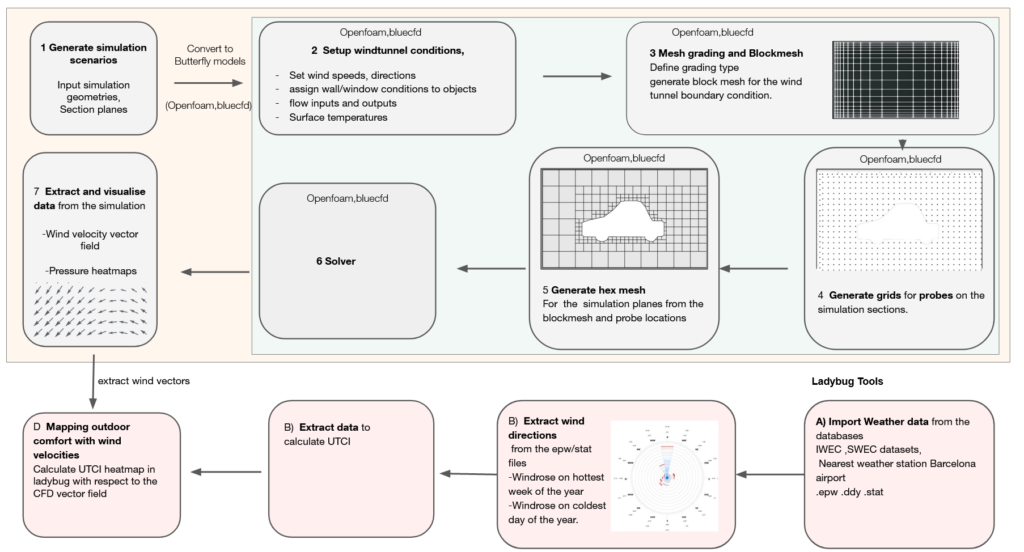
This sensing studio explores a toolset to enable us to quantify and visualize surface temperatures, heat potentials, and convection and airflow patterns that can occur around these types of built geometries. Where access to the site was denied, scaled experiments were conducted to qualitatively study airflow patterns on smaller models, although thermal behavior is not scalable.
Unseen energies through varied perspectives
The sensorial envelope
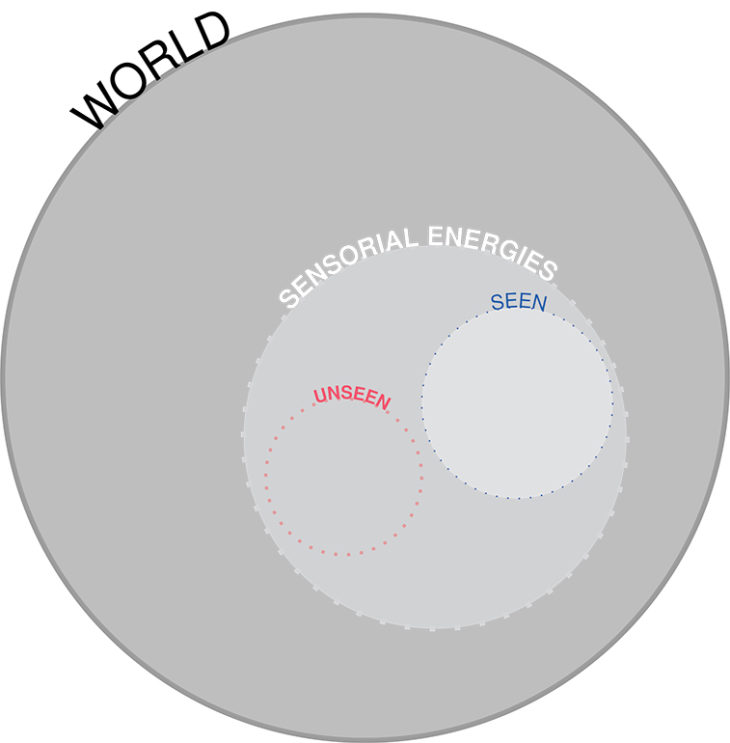
Our experience of the world is defined by our sensory perception. Some unseen energies, such as heat, wind and water, we are clearly able to perceive, and others, such as infrasonic frequencies, electromagnetic radiation, and the chemical composition of the air, are perceived less notably, or not at all. Architect Sean Lally, in his book The Air From Other Planets, terms this perception bubble the ‘sensorial envelope’.
Although created (mostly) for human inhabitation, buildings are typically not designed around the human sensorial envelope, nor the unseen energies that arise from the environment or its interaction with the constructed geometry.
Comfort control
Instead, human senses are most acknowledged in buildings through the concept of ‘comfort control’ – a narrow window of thermal conditions deemed optimal for the human body. Lally critiques this definition, pointing out that the conditions were initially created so as to provide the optimal environment for goods manufacturing in factories, and later updated to include the humans shopping for those goods in the same spaces. Comfort control was later standardised by the HVAC industry, which, handily, then sold the infrastructure to deliver these conditions.
At the scale of the built environment, this has resulted in a binary energy layout of rigidly-controlled interior environments, and largely ignored exterior environments. Energy seeks homeostasis: energy excesses from the interior environments are dumped into the surrounding exterior environments in narrow, concentrated outlets. The thermal footprint of cities is acknowledged in the phenomenon of urban heat islands, but the thermal effect of a building on its immediate surroundings is rarely acknowledged in the architectural process of creating that building. At greater scales of built landscapes and over time, this human-centric, industry-friendly, one-size-fits-all approach to energy can easily be linked to anthropocentric climate change.
Comfort for whom?
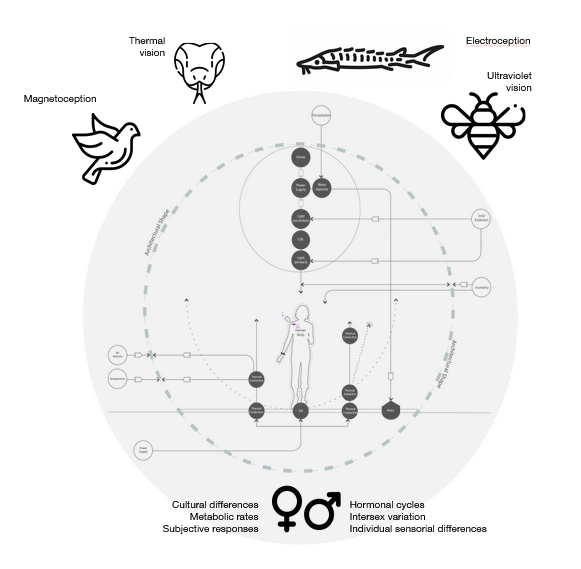
Defining a region of comfort control also begs the question – comfort for whom? A person’s ideal thermal environment can vary with their sex, hormonal cycles, metabolic rates, cultural differences, sensory variation, and subjective preference. Beyond the human experience, the more-than-human world has a far wider range of sensorial abilities: bees are able to see ultraviolet light; some fish can perceive electric fields; boas, pythons and pit vipers hunt by ‘seeing’ the heat generated by their prey and birds are thought to be able to navigate the globe due to perception of its magnetic field.
The idea of a one-size-fits all approach to energetic surroundings & sensorial environments is dangerously myopic. At scale, such a lack of sensitivity wastes energy, wastes money, and contributes to anthropocentric climate change and degradation.
What opportunities does digital technology provide in being able to sense the unseen & bring it into the design process for the built environment?
Tres Xemeneies: a symbol of the anthropocene
The focus site of the project has hosted thermal power plants since the late 19th Century. The current architecture, known locally as Tres Xemeneies for its characteristic three chimneys, is the last remnants of the San Adrian Thermal Power Plant, which operated from 1973 to 2011. The social history of the site is complex: while the plant initially brought employment to the local area and electrified much of the wider metropolis, unrest over workers’ rights was rife, peaking in the shooting of one worker by a policeman during a protest in the 1970s. The environmental damage caused by the burning of fossil fuels is now known to be the driving factor for anthropocentric climate change, but had also long been acknowledged locally, with the severe pollution of the Besos river, a genocide of local wildlife, and air so filled with soot that on at least one occasion it rained alluvia negra (black rain).
It is interesting to note the parallels of this history with the anthropocene, the unofficially-acknowledged geological epoch in which human activity has become so significant that it has altered the planet’s climate and ecosystems. The notion of mass manufacture enabled by the industrial revolution brought a one-size-fits all attitude also apparent in the centralised energy generation model, so suited to fossil fuels, that fuelled climate change. The brutalist architectural style of the power plant, once utopian in design, is now recognised to also be part of a rise in cement construction so profligate that concrete is now one of the most ubiquitous material on earth, second only to water. The building and its operations are also deeply human-centric, as evidenced in the local and global destruction of wildlife and habitats caused by plants such as Tre Xemeneies, for the perceived advantage of human society.
Pandora as salve
Pandora is an attempt to redress the site of Tres Xemeneies, as a symbol of the anthropocene, in a mechanism towards a multi-species, inclusive, post-anthropocentric future.
The project uses techniques of multispectral cognification to be able to visualise thermal energies. Within the time and scope of this project, this has included photogrammetry, thermography, computational fluid dynamics, Schlieren imaging and animal collaboration for the sensing of thermal energy. The scope could extend with more time.
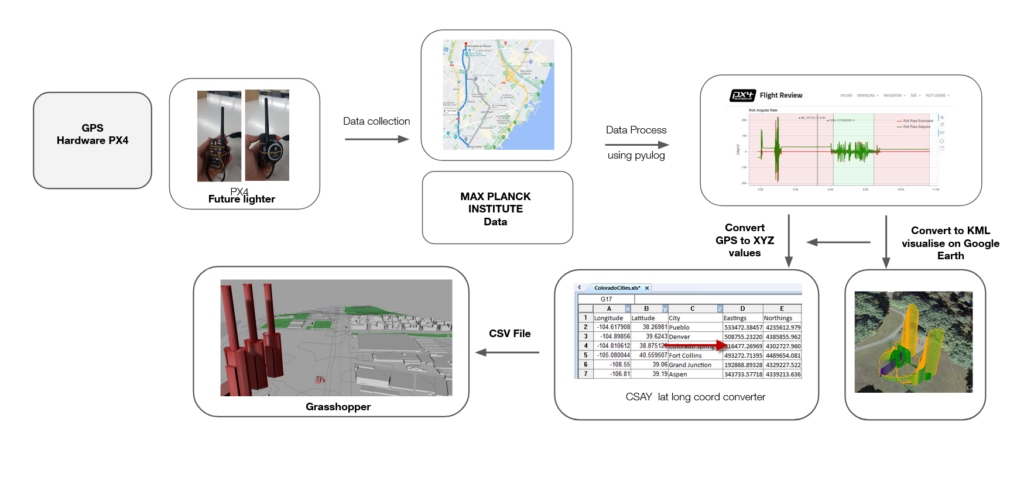
The project has been conceptually influenced by the writings of Donna Haraway, Sean Lally and Philippe Rahm architectes, and the work of the Max Planck Institute of Animal Behaviour.
Its research objectives are:
- sensing thermal potential
- visualising thermal radiation
- modelling thermal flows
- integrating thermals in urban design
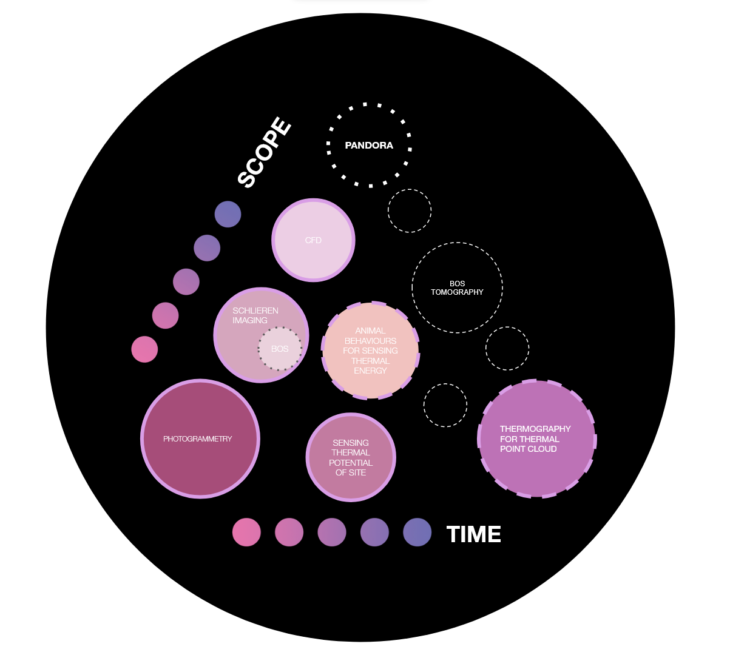
Multispectral cognification: experiments
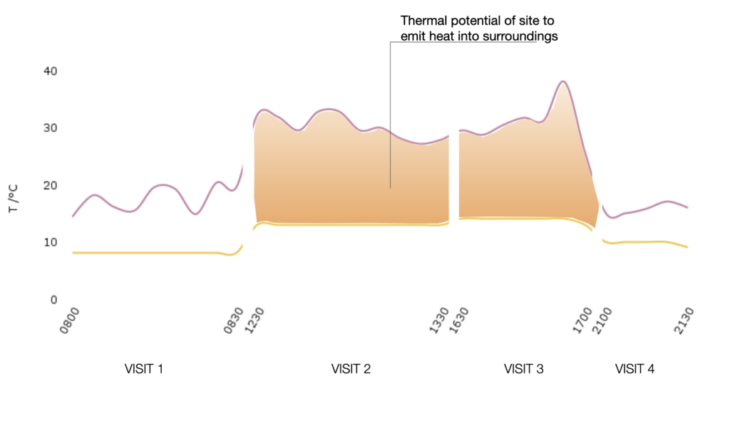
Experiment 1: sensing thermal gradients
Methodology
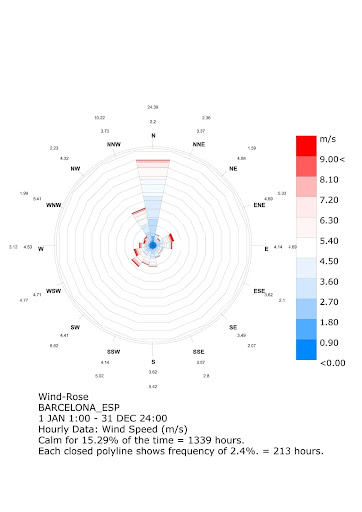
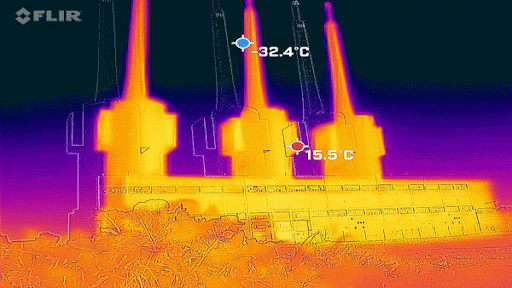
Using a FLIR-One thermal camera, the site was photographed at four intervals during a day: just after sunrise; mid morning; mid afternoon; and just after sunset. The camera was calibrated to keep the same temperature range throughout, and the images taken from the same vantage point.
Conclusions
Analysis of the site temperature from these photographs, cross-referenced with ambient temperature at the same time, revealed a lag between the rising and falling temperature of the incident sunlight and the building material. As the ambient temperature rose, the building remained cooler, and took some time to absorb sunlight and rise in temperature. As the sun sank, the building retained heat.
In conclusion, we observed that concrete absorbs heat from incident sunlight, and that that retained heat creates a temperature gradient between the concrete and surrounding air.
From this, we assume that the concrete becomes a source of heat radiation into environment.
Experiment 2: mapping thermal gradients in 3D
Methodology
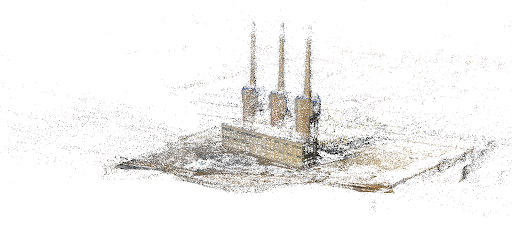
Having photographed the infrared radiation of the site at points during the day, we wanted to understand the thermal footprint of the site through a more spatial methodology. We sought to create a thermal point cloud of Tres Xemeneies, which required the following workflow:
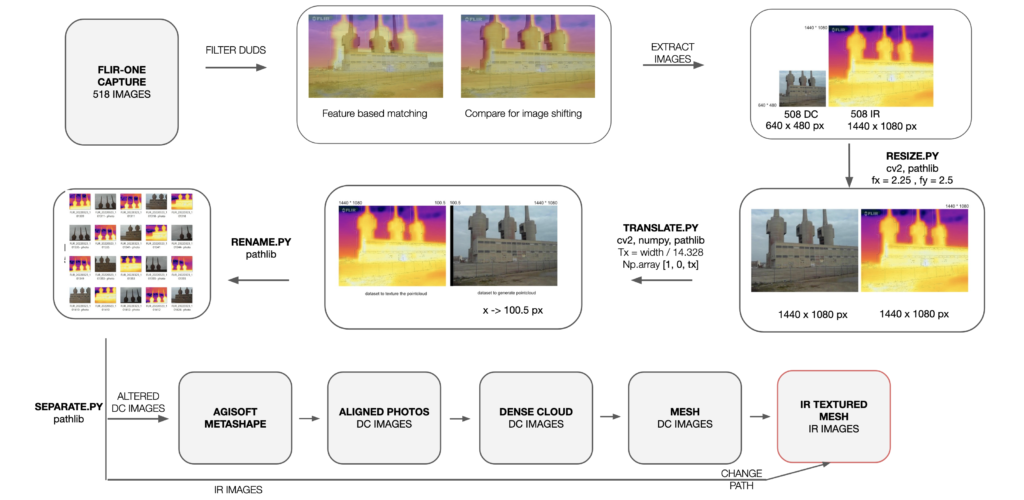
Results and conclusions
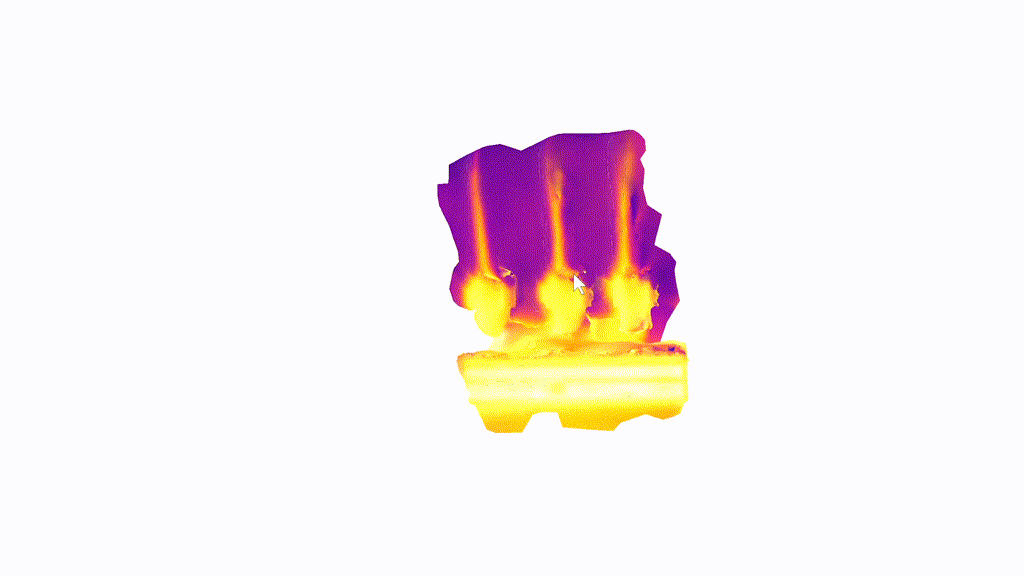
By its nature, thermal energy behaves as gradients. The majority of our visual capture technology operates by recognising borders: algorithms look for edges; the presence or absence of a contrast. In the process of creating a point cloud from photogrammetry, softwares align images via the edges of objects depicted in them. Thermal point clouds are therefore inherently difficult to create, as they will be more likely to show gradual gradients, rather than edges, which makes them difficult for point cloud softwares to align. Thermal images are also usually low resolution. We were therefore pleased with the thermal point cloud we were able to capture here, by texturing a regular DC point cloud with thermal images, and the way that the outline of the chimneys is soft, alluding to the gradient of heat that dissipates from the concrete in to the surrounding air.
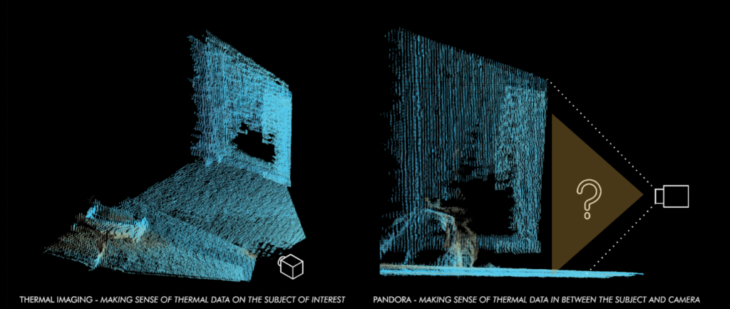
Experiment 3: visualising thermal radiation through Schlieren imaging
Experiments 1 and 2 utilised thermal imaging, which is making sense of the themal data on the subject of interest, and had identified the site material as a thermal object in its surroundings. However, the technique falls short in visualising the thermal gradients that dissipate from these thermal objects into their surroundings. We want to try and understand the mechanics and patterns of the heat as it radiated out into the environment.
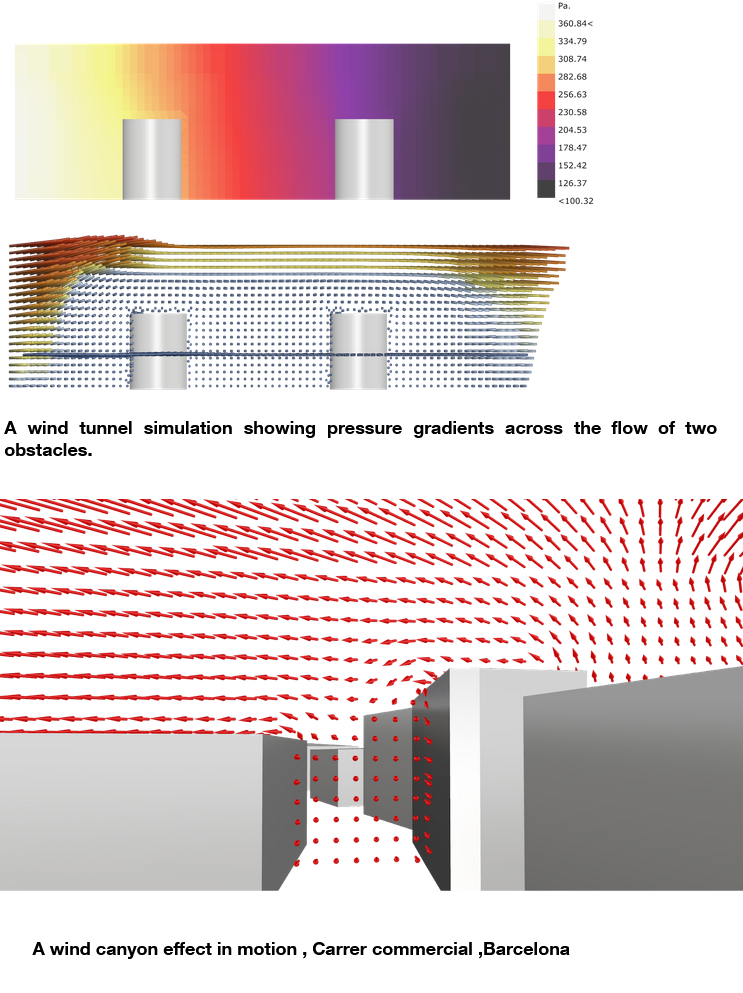
For our third experiment we focused on Schlieren photography, a method used for capturing fluid flow. It is most regularly used in the field of aeronautical engineering to capture the flow of air around objects, or more recently by NASA in photographing supersonic shockwaves. We wanted to use it to video heat emanating from a hot object into the surrounding air, to be able to visualise the flow of dissipating temperature.
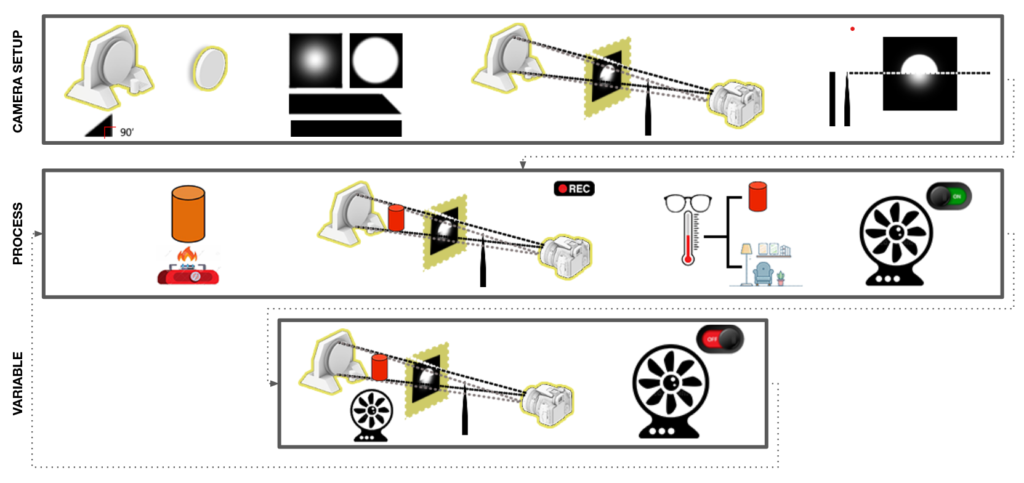
While the equipment for Schlieren imaging can easily run into hundreds of thousands of dollars, we were able to create a successful set up using a 4″ spherical mirror sourced from a dissembled astronomical telescope, and a consumer-level DSLR. The complete experimental set up is depicted below. Naturally, this limited the scope of the size of hot object we were able to capture. We created an experimental set up in a dark room and began to capture heat coming off smaller heated objects in an effort to create a syntax across a variety of geometries.
We then wanted to apply computer vision to digitise the thermal heat flows from the objects.
Methodology
Schlieren imaging: capture methodology
A 4″ spherical mirror is fixed at a perpendicular angle to the floor of the experiment. A consumer-level DSLR is placed approximately 1.5m from the mirror, and a pinprick light source placed next to the camera, pointing at the mirror. We experimented with bright flashlights, pinprick LEDs and optical fibre, but ultimately a more diffuse light was most successful for our imaging. A blade is used to split the beams coming from the light source as they go towards the mirror. A heated object is placed in front of the mirror, and the reflection of the split light beam makes it possible to see the heat waves on the camera’s feed capture.
A series of clay geometries, 10-20cm in size, were heated to the temperature observed from thermography of the Tres Xemeneies site, in an ambient surrounding temperature similar to that observed in experiment 1.
Post processing
The video outputs from the camera were then analysed by a range of algorithms. The algorithms generated frame-by-frame analysis of the video inputs, which were then re-compiled into video outputs using ffmpeg.

Schlieren imaging: post processing methodology
HISTOGRAM OF ORIENTED GRADIENTS (HOG) ALGORITHM
The workflow is as follows:
- (Resize to 128 x 64 px)
- Calculate horizontal and vertical gradients for each pixel
- Calculate histogram of gradients in 8×8 cells
- 16 x 16 block normalisation
- Calculate feature vector
- Visualise
BACKGROUND ORIENTED SCHLIEREN
Although also capturing Schlieren photography, this algorithm requires a slightly different experimental set up, with a fine checkerboard pattern behind the heated object instead of the spherical mirror. The algorithm is specific to BOS. The results were decent, and the process more versatile. However, we were getting better quality of resolution with the spherical mirror set up, so we decided not to continue with BOS in this circumstance.
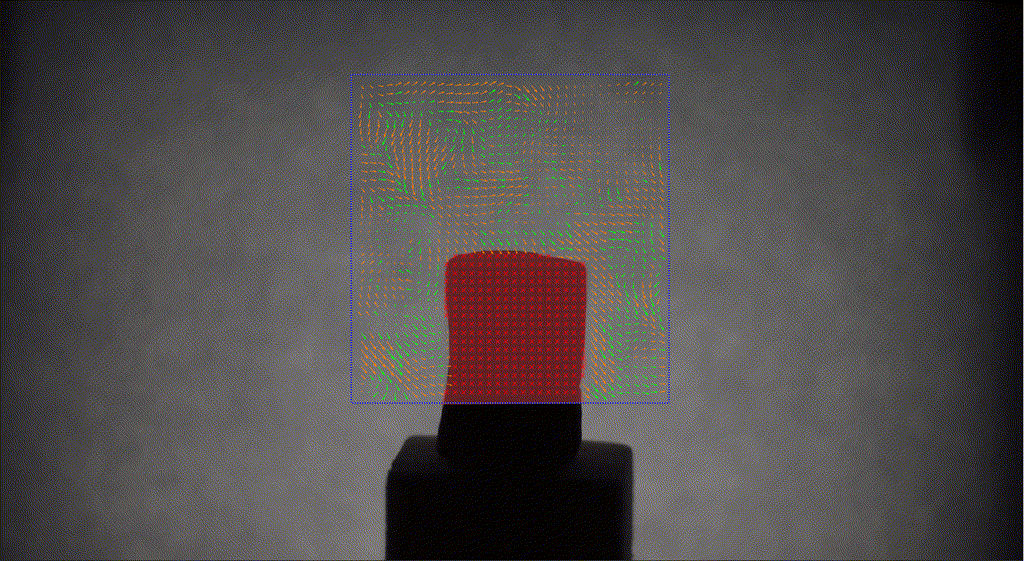
OPTICAL FLOW ALGORITHM
Tracks the movement of pixels from one frame to the next, assuming constant intensities. Both dense and sparse optical flow were used.
Sparse optical flow – uses the Lucas Kanade method and the cv2.calcOpticalFlowPyrLK() function from OpenCV. The algorithm works only on corner point pixels, detected by Shi-Tomasi Algorithm.
Dense optical flow – uses the Gunnar Farneback method and the cv2.calcOpticalFlowFarneback() function from OpenCV. The algorithm works on every pixel, which was more suited to our purpose of tracking thermal flows. For greater visibility the results can also be viewed in hsv format.
Future development would be to extract minimum and maximum values from the vector matrices for numerical analysis of flows.