During the Digital tools for Cloud-based Data Management seminar, we developed, through a series of exercises, the basic skills to start building our web pages. We do not only use them as a tool to showcase our designs but also to let other people, potential clients perhaps, interact with our designs by tweaking their parameters and taking part in the design process. For this second part, we used Rhino.Compute in combination with Javascript.
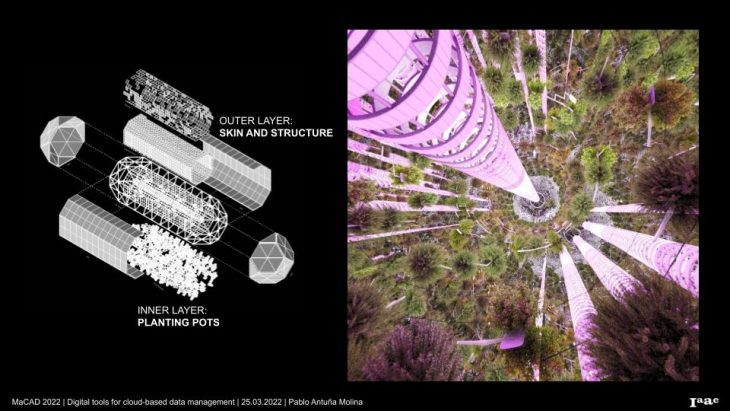
Exploded axonometry showing the different layers and an interior image.
To test this potential, I decided to use the project we had been developing in the Studio seminar, a spatial greenhouse that could be part of a space station, and create a configurator that would allow the user to fiddle with its parameters, preview relevant information and, in the end, download the result.
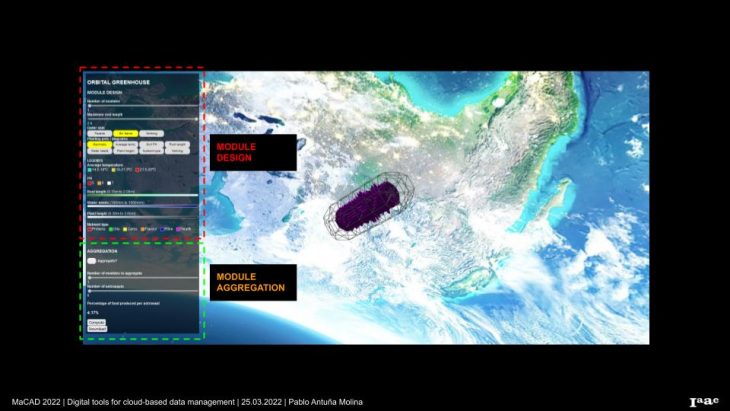
On the page, the sidebar is divided into two: module design and aggregation.
The configurator consists of two parts, the first one lets you design the module while the second one aggregates it following its geometrical constraints.
The design part has a starting set of rules that were thoroughly designed beforehand: each module corresponds to the 25% of the food needed by an astronaut, and the relevant data from the crops and nutritional requirements come from earlier research. Its user inputs are the number of modules to aggregate, a maximum of four, which means 100% of food needs, and the maximum root length of the crops planted. In the end, the website performs a series of analyses in the back that can be later displayed.
The aggregation part takes the modules previously designed and, giving the number of modules to aggregate and the astronauts that will be feeding on those greenhouses, it returns the aggregation geometry and the percentage of food per astronaut that the aggregation can provide.
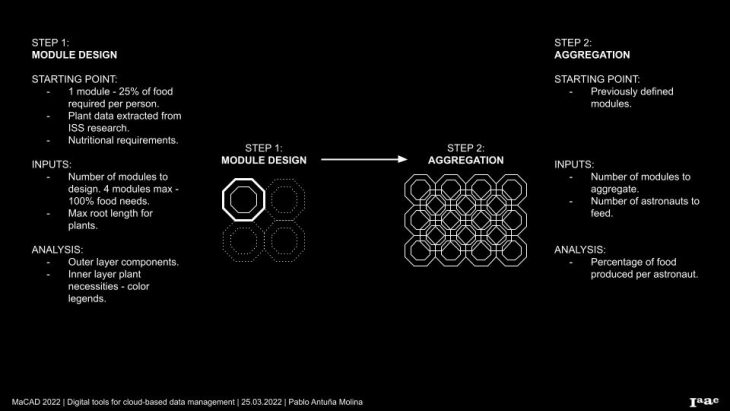
Module design and aggregation steps defined.
As mentioned, in the module design part, the user can use the number of modules to design and the maximum root length of the crops to plant, which defines the modules’ overall volume.
The first slider in the module design part sets the number of modules to design.
The second slider sets the maximum root length of the planted crops.
The final step lets you preview the different construction layers of the modules – facade and structural frame – and some planting information about the crops – average temperature, soil PH, root length, water needs, plant height or nutrient type. Afterwards, the modules can be downloaded and the geometry will have as user attributes the plants that are being planted in them and the mesh’s area.
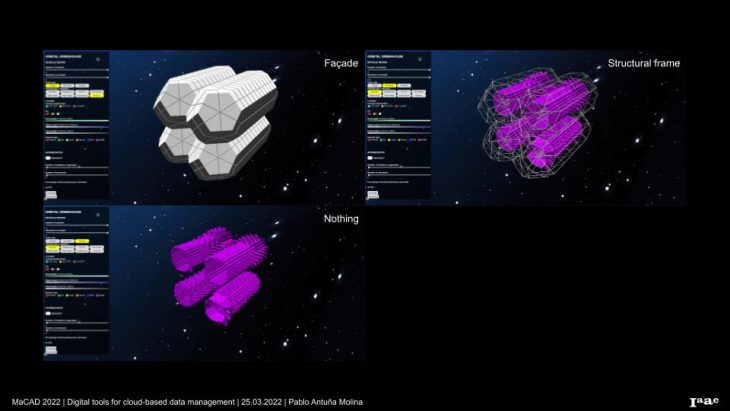
The outer layers to preview of the modules are the facade panelling, the structural frame or none.
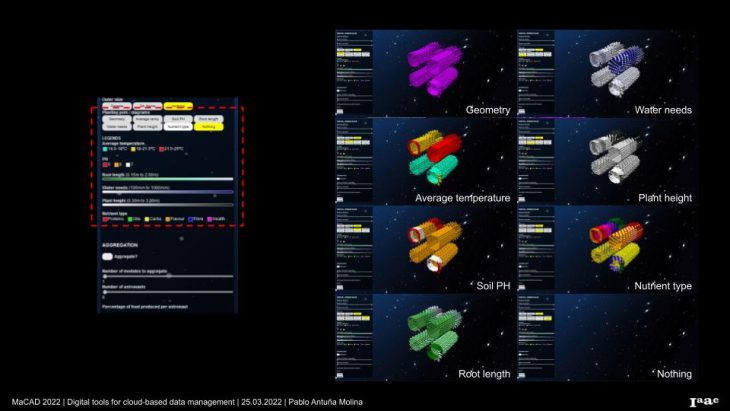
The data that can be previewed from the inner layer is plant-related: average temperature, soil PH, root length, water needs, plant height, nutrient type or none.
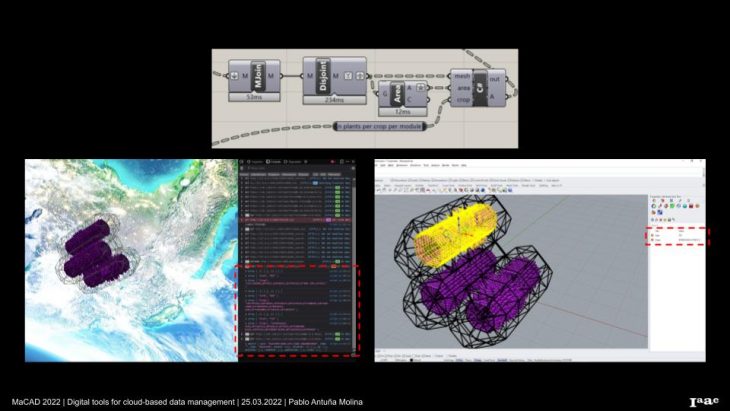
Using a short C# script, data from the Grasshopper definition can be passed as userstrings that will be set as user attributes to the geometry via JS. This way, the downloaded model will have the information embedded.
Even though the aggregation is the shortest part of the script, it requires the most computation. Some measures were taken to avoid calling Rhino.Compute accidentally while playing around with the site. First, to call compute, the “Compute” button needs to be pressed. Second, to aggregate one must tick the checkbox. Third, any time one of the de module design parameters is changed, the checkbox is unchecked. And fourth, the function that analyses the percentage of food produced per astronaut, a simple numerical operation, is done in Javascript to avoid the need to call compute. In this way, it takes a bit more time to navigate throw the website but it is saved when Rhino.Compute is not called accidentally.
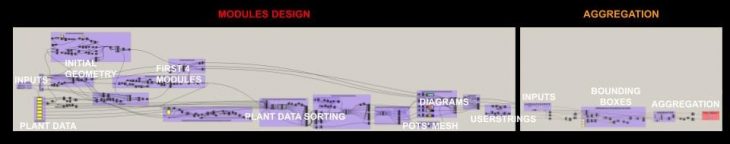
The size of the script for the module design is much bigger than the one for the aggregation even though it takes less time to compute.
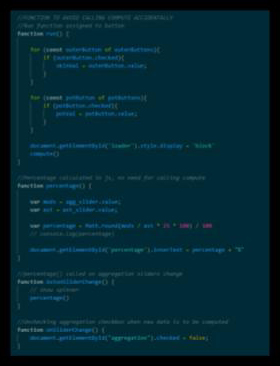
These functions are the ones that avoid calling compute accidentally while playing with the site.
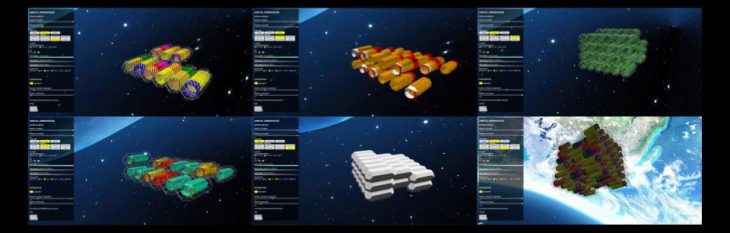
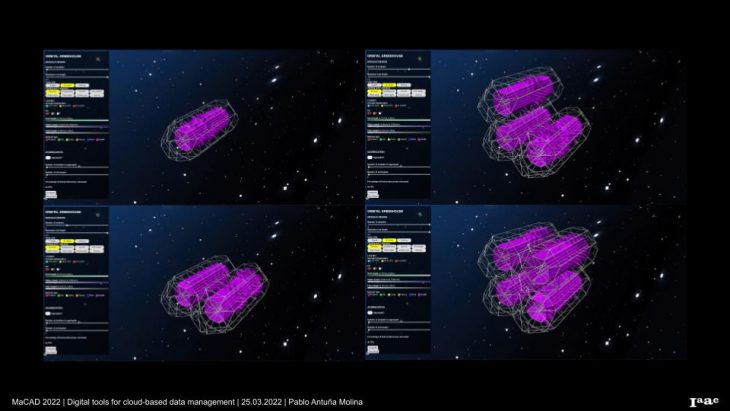
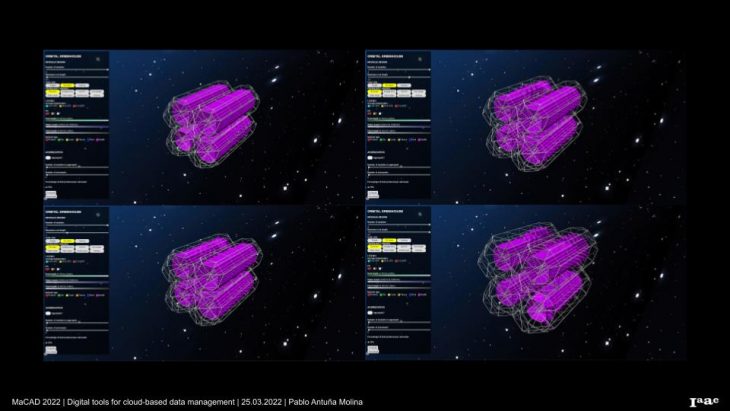
Different examples of aggregation.
“Orbital Greenhouse – Digital tools for Cloud-based Data Management” is a project of IAAC, Institute for Advanced Architecture of Catalonia developed at the Masters in Advanced Computation for Architecture and Design in 2022 by:
Student: Pablo Antuña Molina.
Faculty: David Andrés León.
Assistant: Hesham Shawqy.
