GENERATIVE CITIES
NEOTOKYO
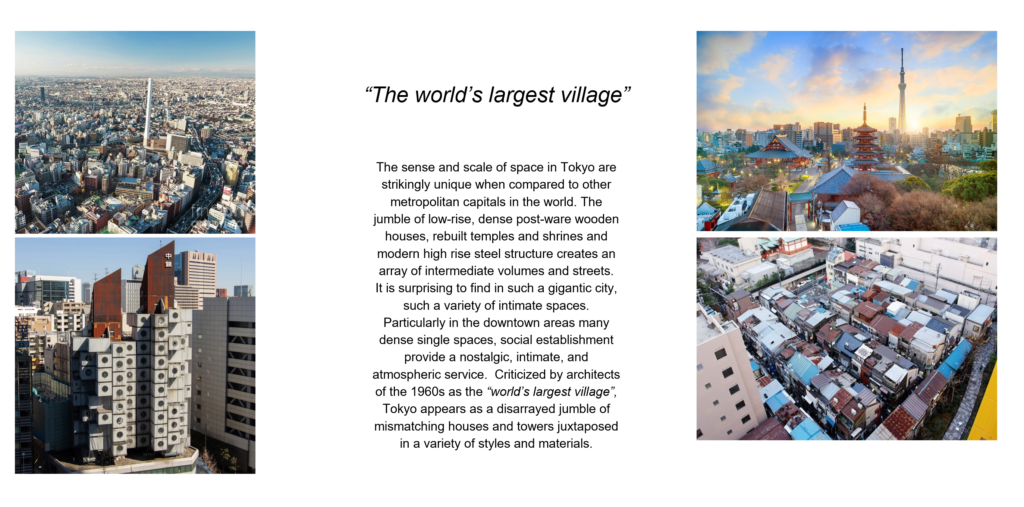
INSPIRATION: Tokyo and the Urban Jumble
Criticized by architects of the 1960s as the “world’s largest village”, The gigantic city of Tokyo, is one of contrasts and juxtapositions which we take inspiration from. From traditional to high tech, from low to high
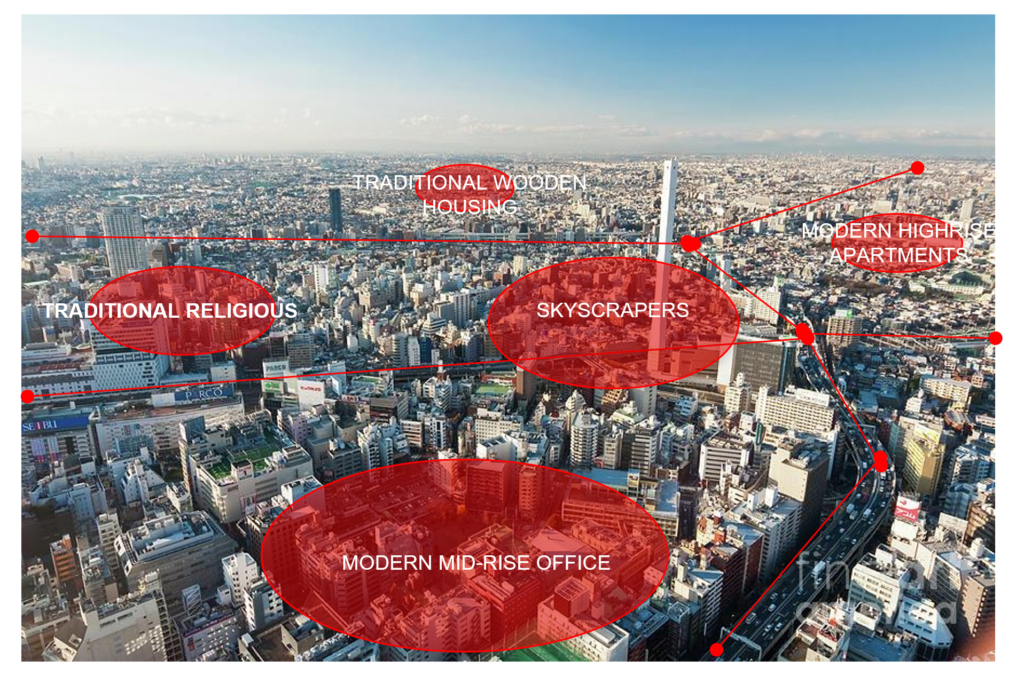
The focus of our analysis and city generation is the polycentric nature of Tokyo and the juxtapositions of building cluster types and heights.
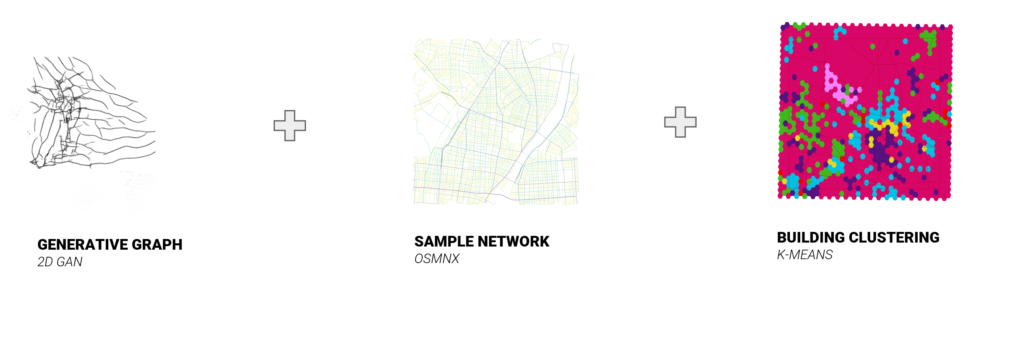
We have combined 3 methods in order to achieve this: first generating the starting graph network using a DC GAN to understand the dense network of Tokyo, then manually analysing Tokyo’s districts using OSMNX to understand the core network and finally clustering existing building types from the sampled zones to get an understanding of categories and groupings. All this together would create NeoTokyo.
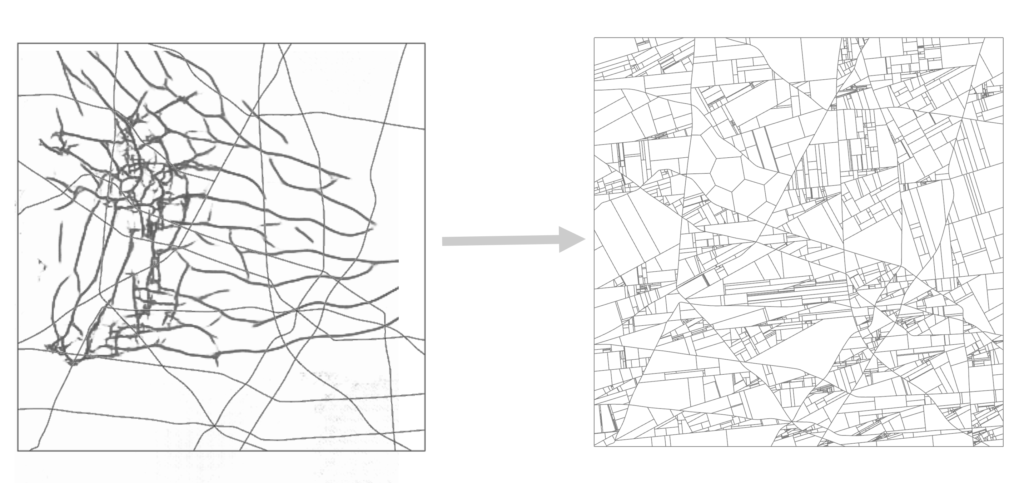
DC GAN: 2D URBAN NETWORK GENERATION
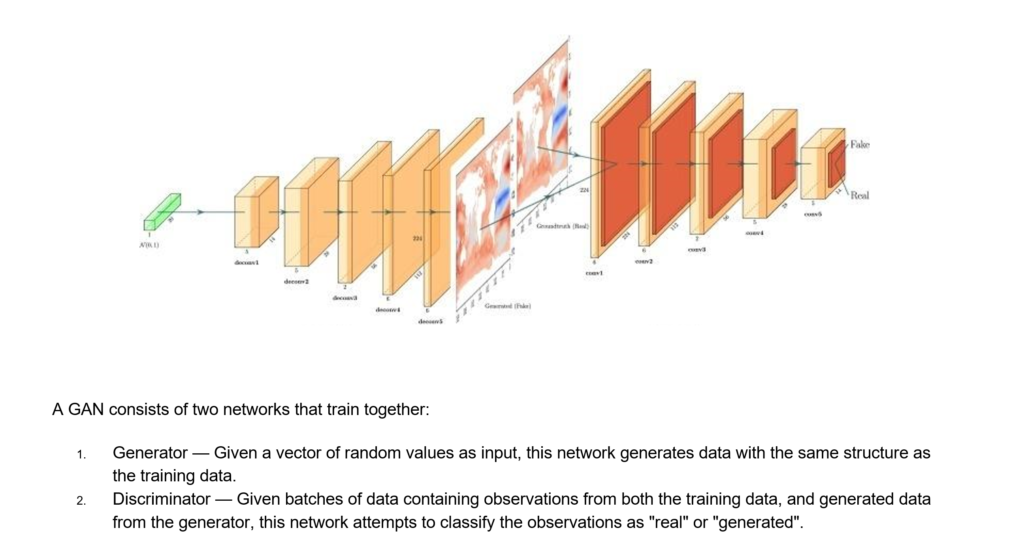
First step involved the initial network graph generation using GAN algorithms to predict the density of Tokyo’s districts. We chose image generation for its speed and ease to create MANY 2D NETWORK samples. Using a deep convolutional GAN, the AI architecture works by estimating the generative models using samples between real models and discriminating between the real and fake samples created.
We created 2000 images samples from districts across Tokyo, by tiling the city into 1000m grids from OSM data and creating png images from them.
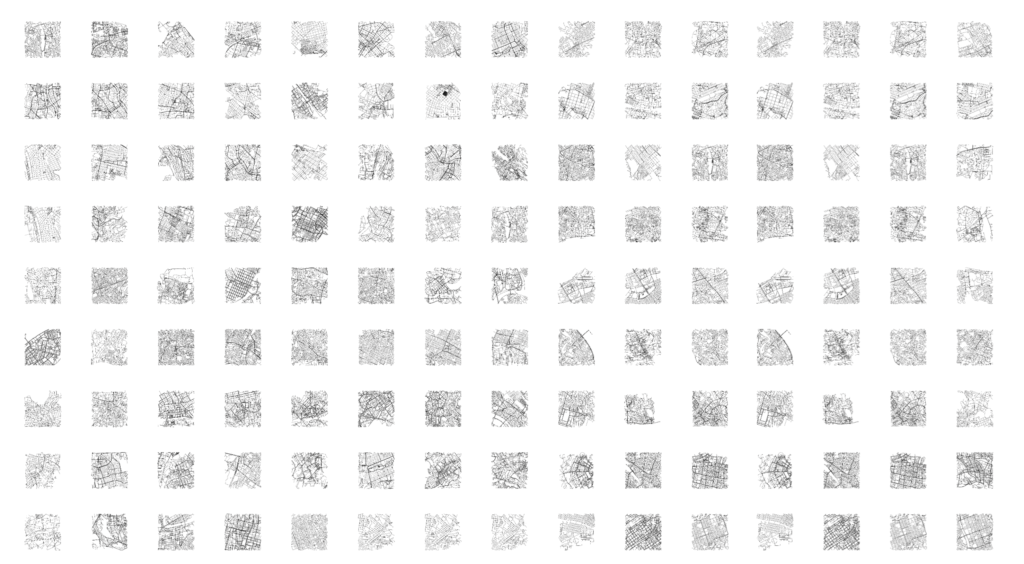
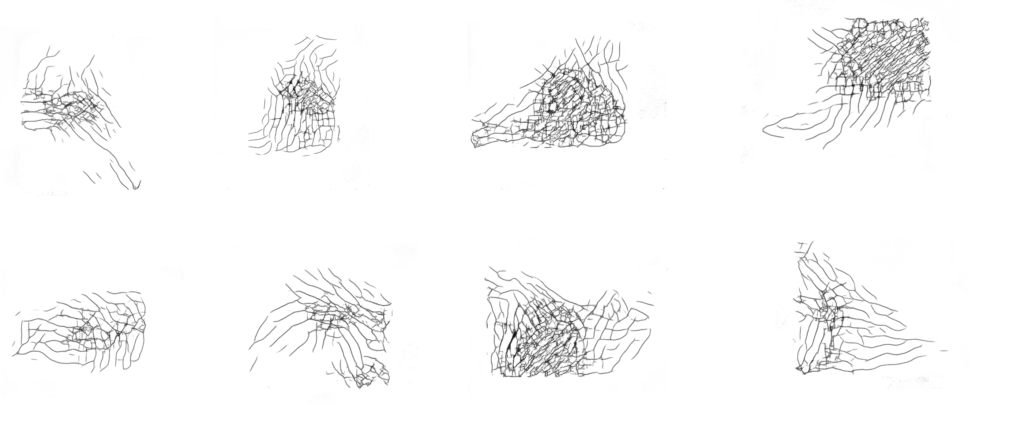
Then the training ran for over 3000 epochs until the dense jumble of the Tokyo network became more apparent. In order to improve these results, there could be more samples from Tokyo and be more selectively filter to only use the most dense images. Running the training for more epochs would also increase the pattern recognition quality.
From this we selected graphs that we liked best to use as a reference for our city generation.
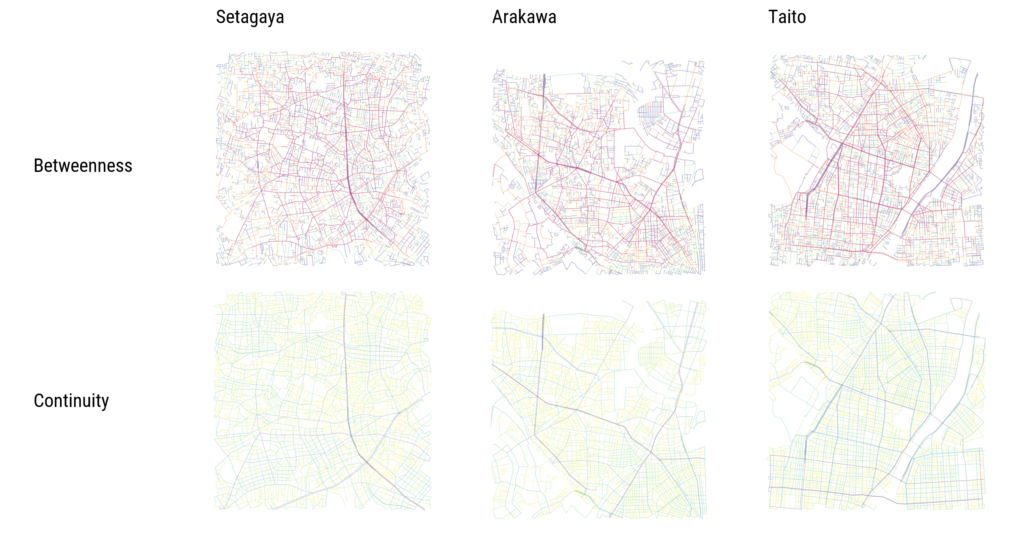
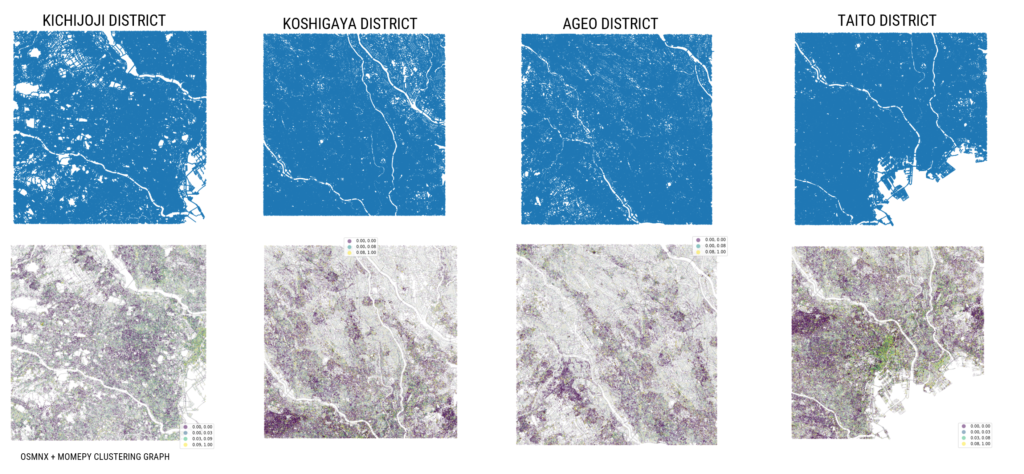
OSMNX GRAPH NETWORKS: Graph theory and analysis
Since the GANs created very rough networks we then manually analysed parts of the city to get a stronger understanding using graph theory and the python library OSMNX. Three similar districts within Tokyo were selected and used for our network generation.
We combined both the outcomes from 2D GAN and network analysis to make a base grid for Neo Tokyo. We then used the Substrate algorithm to make it dense as Tokyo currently exists and to exaggerate the features.
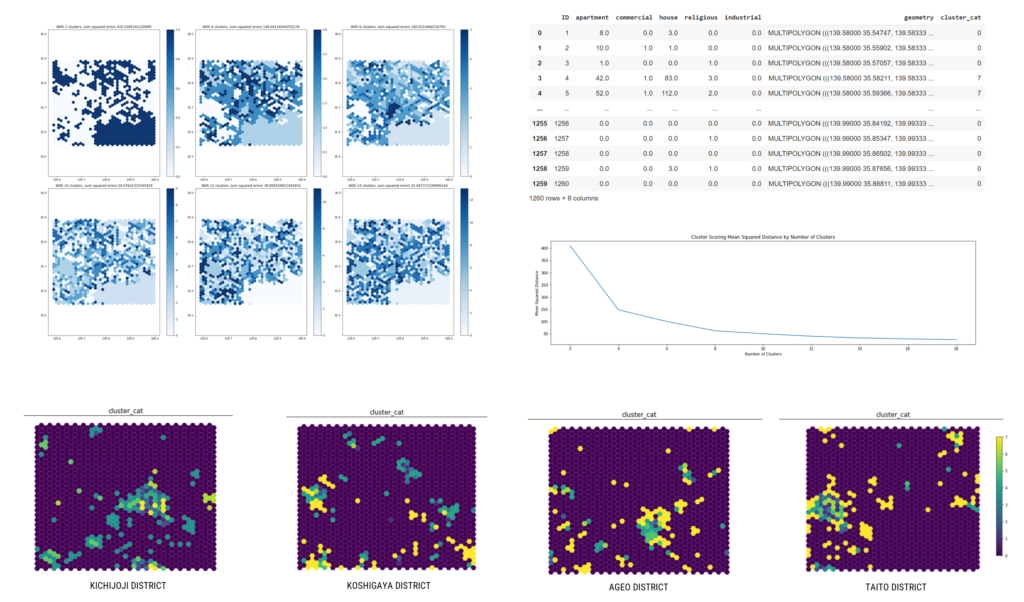
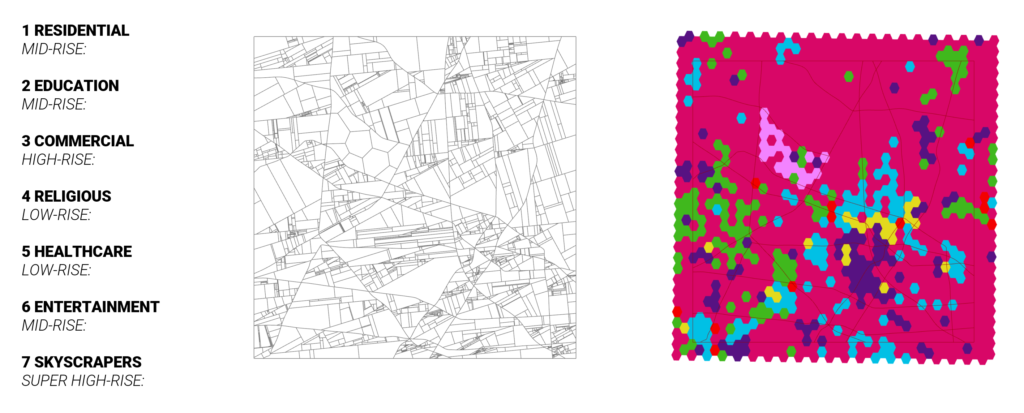
BUILDING CLUSTERING: K-means and OSM data
The final part of gathering building data and heights was generated through clustering existing OSM data across 4 large dense districts.
Each district had specific building categories which were counted by centroid and then clustered to created individual zones, then added to a database. Elbow analysis was used to predict the best number of clusters and was repeated for all four samples districts.
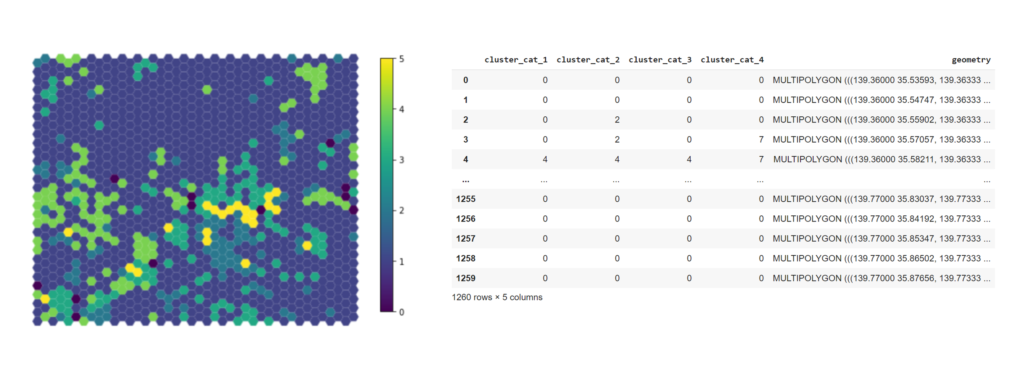
The four district zones were then clustered again to give a combined zoning map to generate the areas need for NeoTokyo.
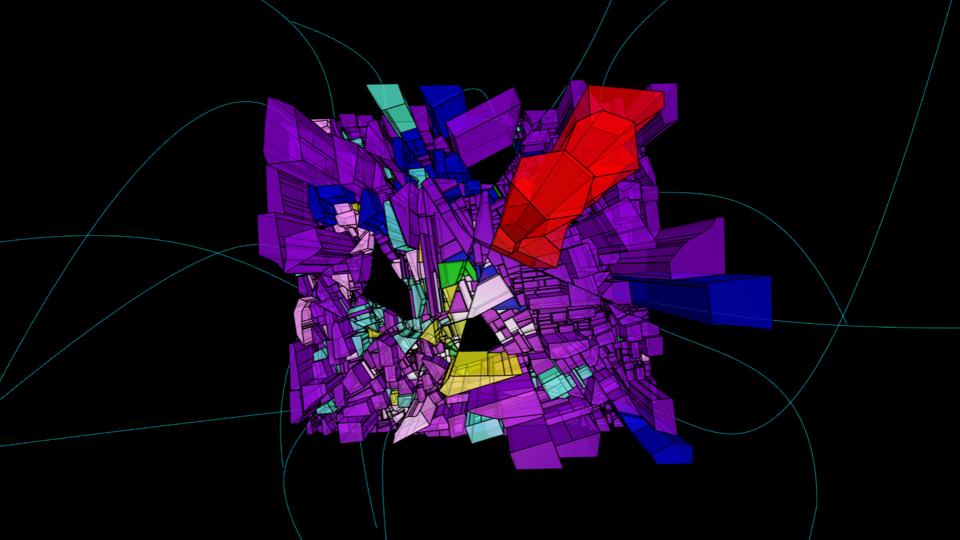
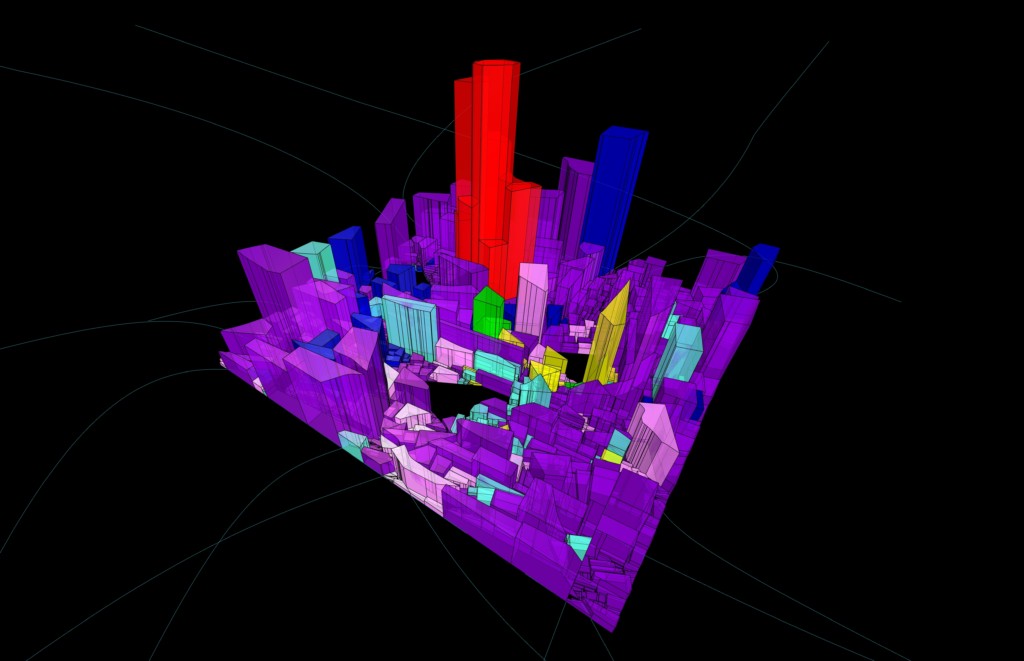
CITY GENERATION: Combining the Data
The final city generation was accomplished through the combined cluster building zones and network so that we allocate a category to each section and overlay with the network.
This is the 3D visualization of NeoTokyo, a juxtaposition between high-rise skyscrapers, low-rise buildings and polycentric zoning. A city of contrasts.
As an additional step, with our city generated we then visualised the graphs, data and points within the python library Follium. This allows for the creation of an interactive HTML file whereby anyone can hover over the clustered zones to see the categories, select building points to see height data and overlay the created line network.
We would hope to further develop this by developing more the 2D GAN network generation to integrate more with the street network to create a much larger and cohesive scheme.
CREDITS:
STUDENTS: MICHAL GRYKO + TAKEAKI SAKAKIBARA
SENIOR FACULTY: DAVID ANDRES LEON
FACULTY ASSISTANT: DAI KANDIL