Cities are built around transportation strategies. The constructed urban environment is influenced by our accumulated individual transport choices, and by the decisions of transportation planners who continue to rely on tools designed to hasten the expansion of car culture. Past experiences incorporating cars, trains, and horses have demonstrated that paradigm shifts in mobility technology impact activity patterns in cities.
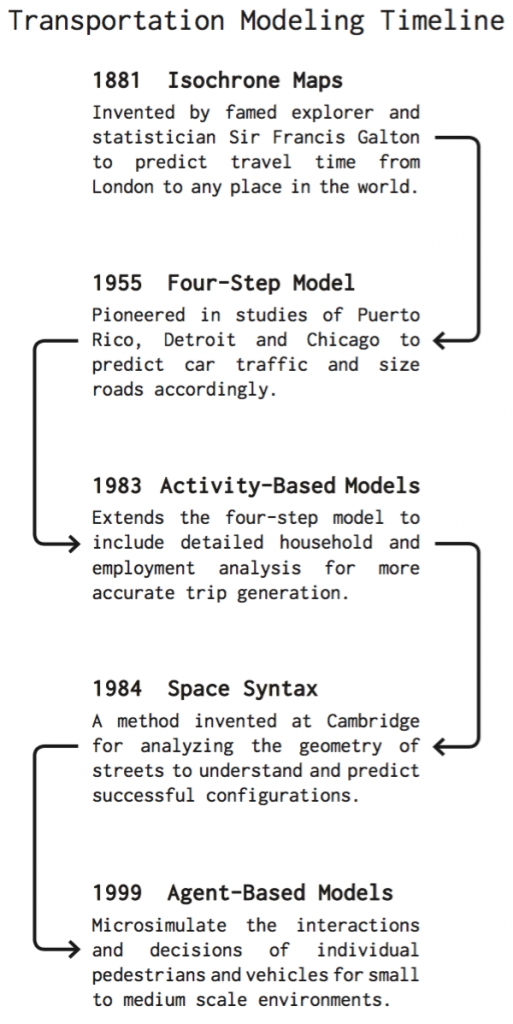
Recent technological advances suggest that in a few years, roads will be populated by self-driving cars. Improved safety on streets, reduced cost of travel, and greater transportation equality are among the expected benefits of autonomous vehicles (AVs) frequently cited by futurists and engineers. However, to anticipate that any single technology would solve every problem would be naive. Experience with past mobility revolutions tells us that the response of planners to this emerging technology will define the character of our cities and societies for generations. A potential challenge with successfully adopting AVs is that the main computational tool transportation planners rely on to simulate future use is still the traditional four-step model developed during the 1950s to predict traffic demand for expressways.
AVs will revolutionize urban mobility, but the positive and negative consequences of driverless personal transport on cities and societies remain unknown. The probability of a beneficial impact will increase with more and better tools available for analyzing existing transportation habits and predicting future possibilities. This project presents a variation on traditional transportation modeling that is faster and more versatile, visual, and tactile.
The mobility topography model (MTM) is a multimodal route simulator that evaluates probable modal choice for hypothetical travelers distributed across a digitized representation of any given urban landscape. Route impedance calculations determine utility values for each mode of transport, and are combined inside a multinomial logit model, with coefficients calibrated by a genetic algorithm. The resulting visualization of predicted modal choice probabilities is based on actual ridership data, transportation infrastructure, and economic conditions. The user interacts with adjustable input parameters to investigate the potential impacts of evolving technologies and changing circumstances. The MTM is flexible, general, and well suited for casting holistic projections of future scenarios, rather than for precise accounting of specific interventions.
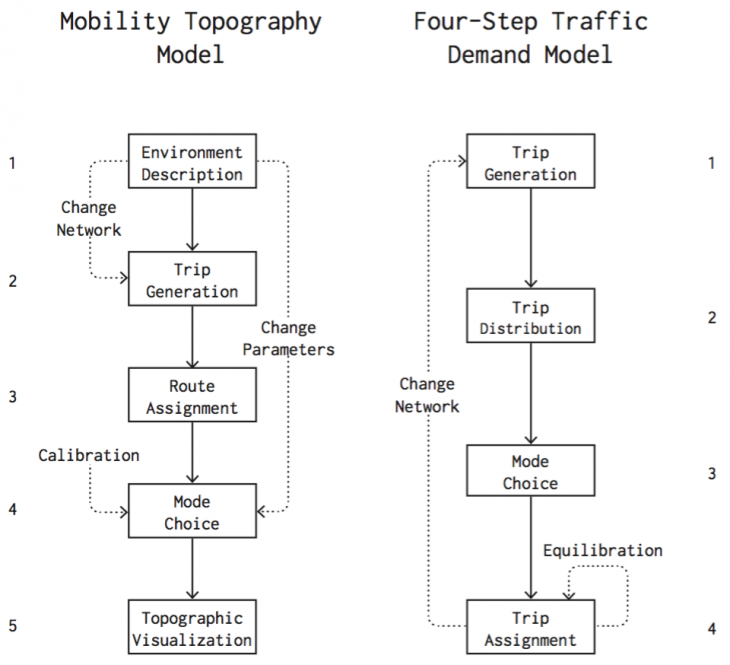
Comparing the architecture of the MTM with traditional four-step models reveals the MTM’s clear advantages in terms of calculation time. To consider changes to the network, a four-step model must loop back to the trip distribution step, while changes in activity production must be recalculated from the trip generation step. In comparison, once it has been initialized, the MTM can skip the costly trip generation and route assignment steps, giving the user a seamless, tactile experience.
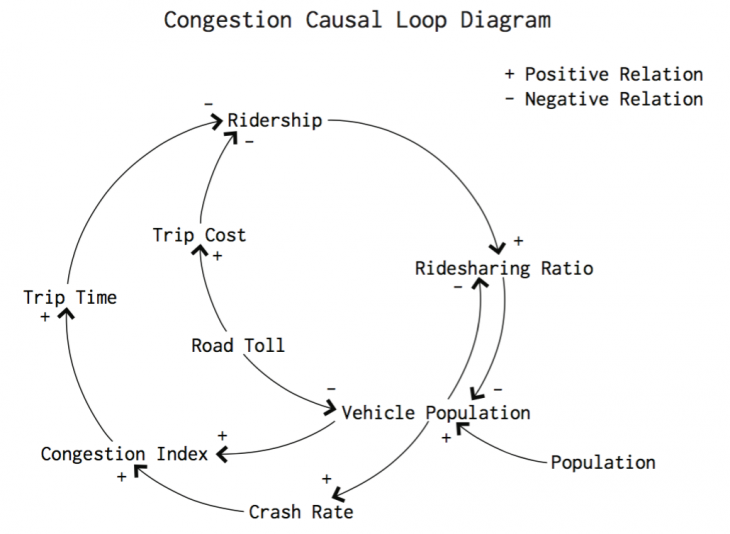
Traditional models rationalize congestion as an imbalance between trip demand and link capacity, and usually depend on equilibrating these two forces by reassigning trips within a feedback loop. However, since travelers continue to depend on heavily congested roads, this understanding of congestion can fail to accurately represent reality, particularly due to induced demand. Instead, the MTM uses an innovative algorithm based on congestion indices.
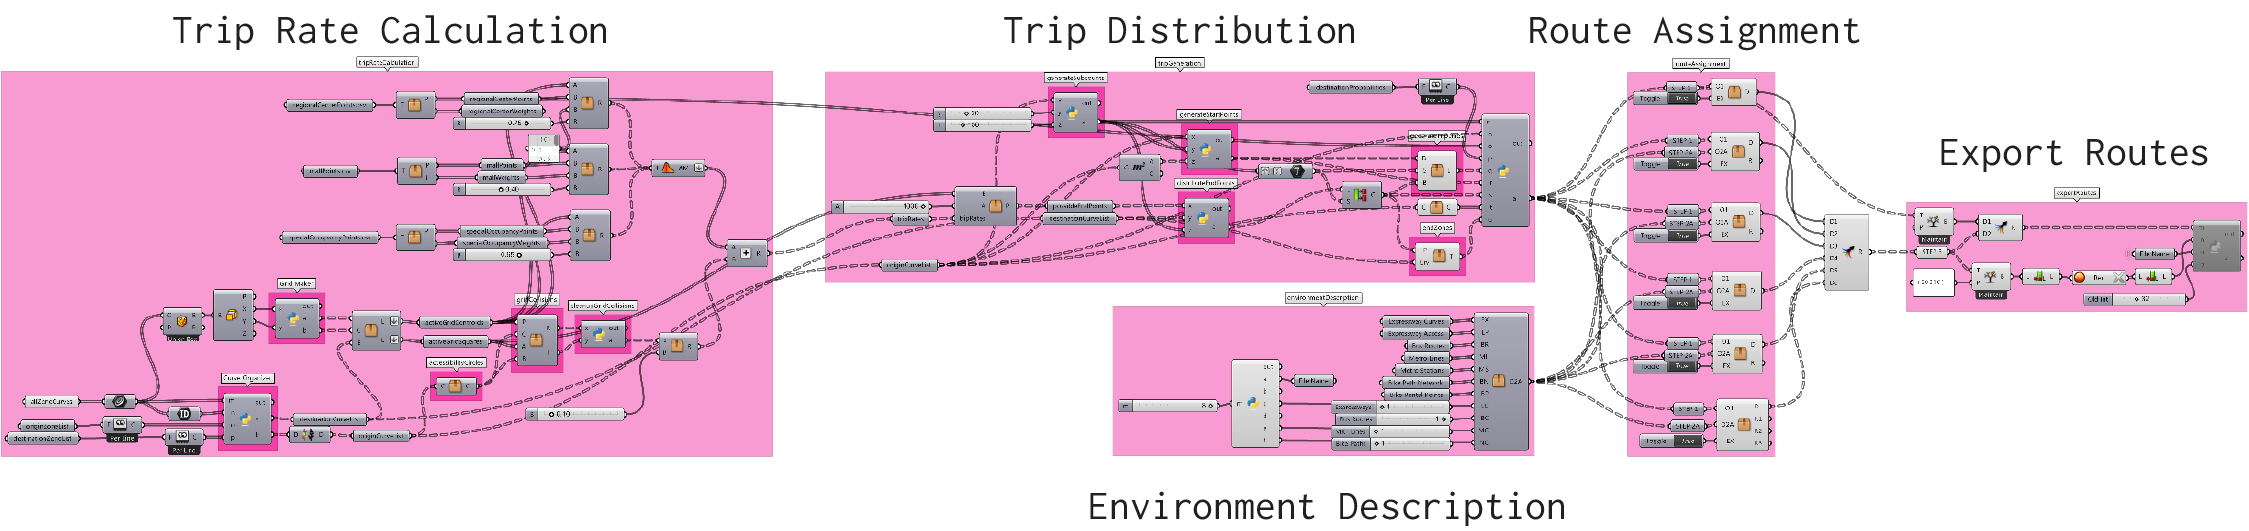
To implement trip generation and route assignment, the urban environment data aggregated in Rhinoceros3D is processed in Grasshopper via algorithms written using a combination of native components and custom Python scripts.
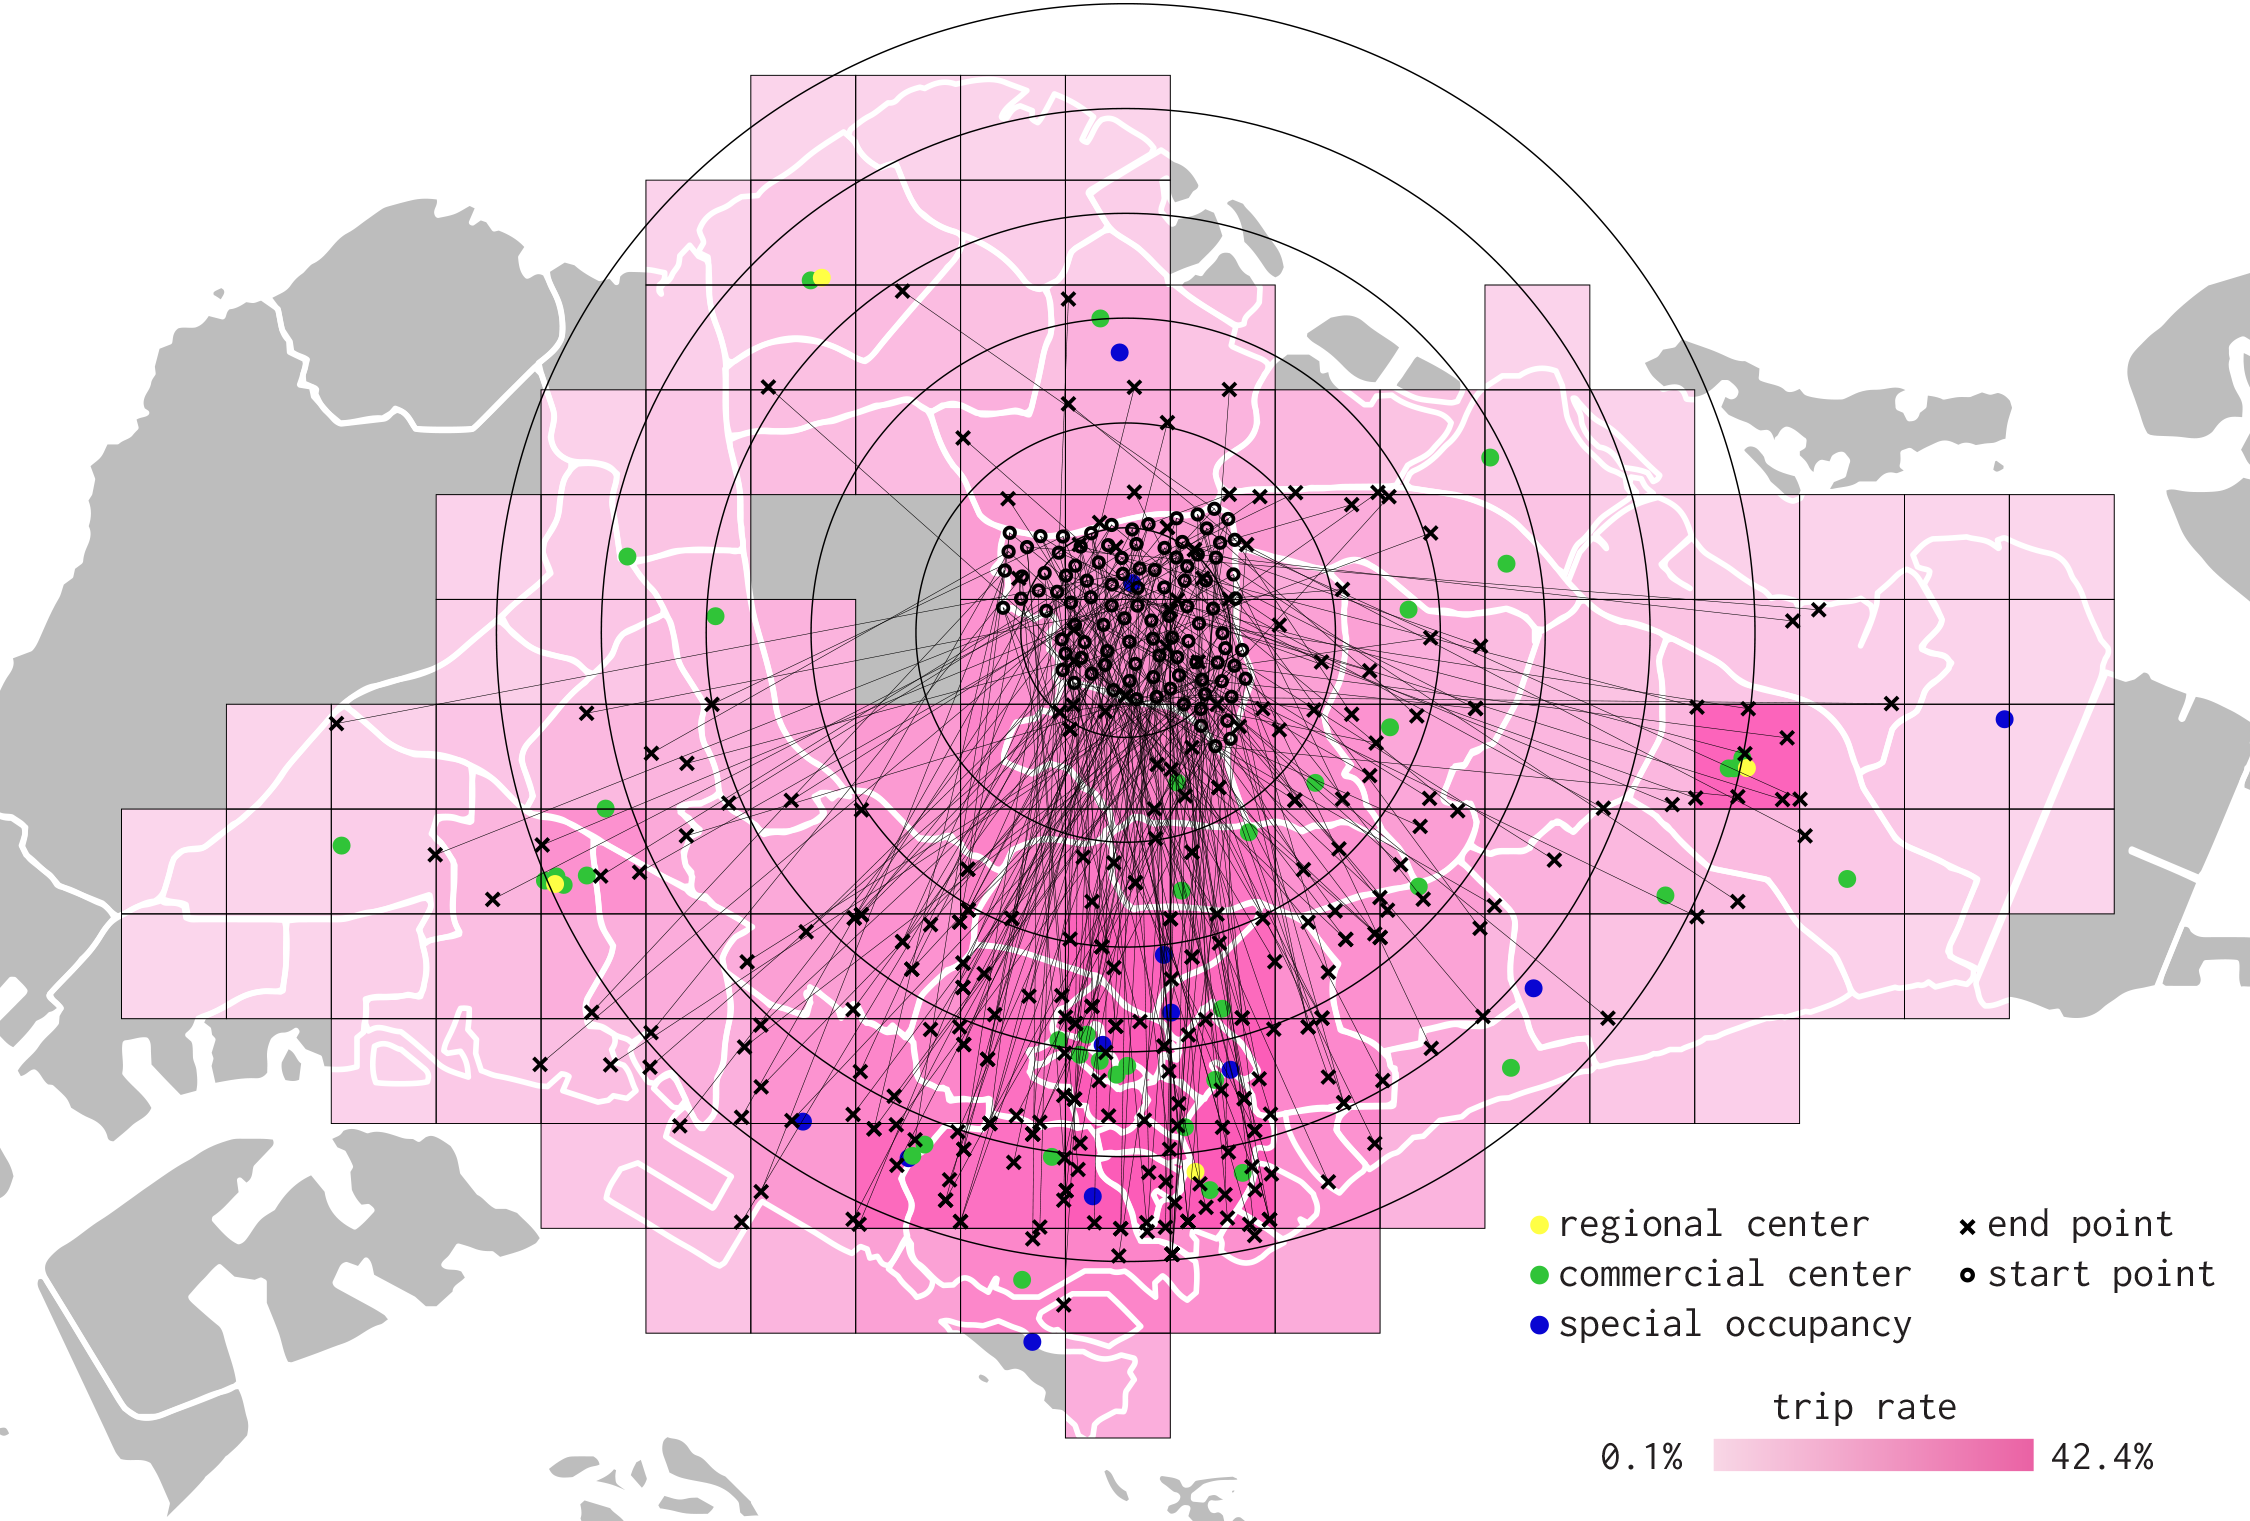
The MTM trip generation algorithm essentially performs a simplified activity analysis using points to represent generators of economic activity. Occupancies are separated into categories for malls, business districts, and special occupancies (eg. hospitals, airports, etc.). The points are then weighted according to the scale of each individual occupancy. Next, the distances to each activity generator are sampled from the centroid of each grid, and combined with an accessibility index to produce a trip rate for the grid cell, visualized here as a color gradient. An accessibility index is a multiplier ranging from 0 to 1 that decreases as the distance from the traffic analysis zone gets greater. The trip rates generated by this process are unique for every analysis zone. Without entering into a detailed household analysis, the trip rates that are produced by this algorithm can approximate the demand for trips due to employment in Singapore.
At the core of the MTM are the very same concepts of mode utility and probable modal choice as in traditional models. Mode utility derives from projected travel time and travel cost calculated with route data extracted from a designated trip on the chosen mode. Other socioeconomic variables can be included in the mode utility calculation, such as the age of the traveller, their income, their household size, etc. For the purposes of the MTM, only income was included in the equation as a denominator below travel cost. When income rises, more expensive modes of travel become more appealing, and vice versa. Once time, cost, and income have been determined, they are modified by coefficients that represent the intangible decision-making factors for the traveler, including stigmas and biases, as well as accounting for error and uncertainty.
Once utility has been calculated, the next step is to calculate the probable modal choice for each mode. This equation is essentially a percentage for the utility of the chosen mode over the net total utility for all modes. However, each mode utility value is first multiplied by the natural exponent.

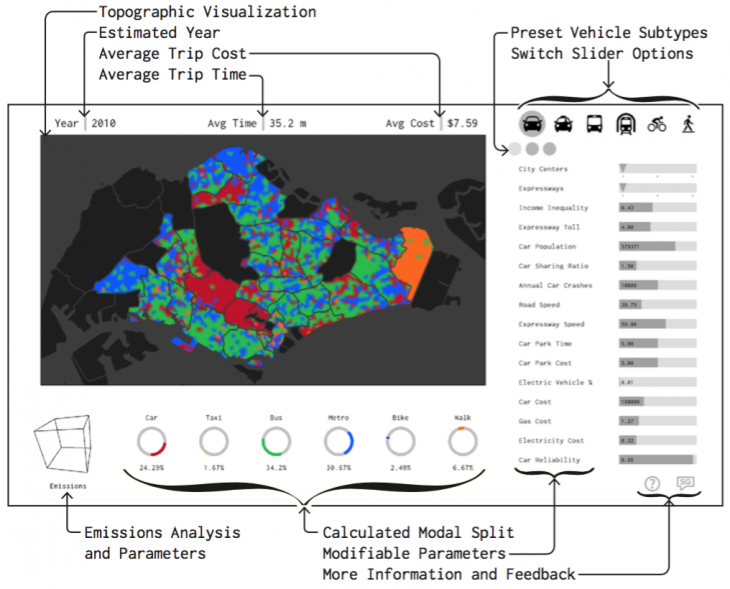
Route data based on Singapore’s 2009 infrastructure and urban conditions was used for calibrating mode utility coefficients with a genetic algorithm. The output coefficients are combined with calculated route data in a standalone application developed with Processing. The application interface was designed to be simple and intuitive, while offering the user complete control over the entire range of mobility model parameters. Although the application is currently focused on Singapore, it can be adapted to model any urban environment.
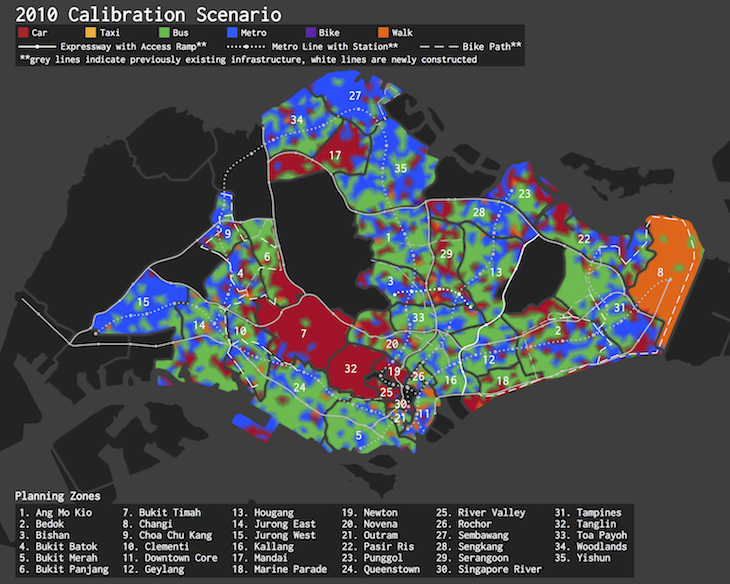
The map analysis below investigates the impact of AVs in Singapore with a series of three scenarios that could occur over 30 years of technological and infrastructural evolution. Scenario one is a snapshot of Singapore in 2009, based on data from the 2010 census. Several features of Singapore’s existing mobility topography are apparent at this holistic scale. There is widespread reliance on bus travel despite frequent long wait times, and the frequent dominance of walking in the Downtown Core and sporadically in other areas is characteristic of walkable cities like Singapore.
Scenario two is a projection into 2025, with several major infrastructure projects completed and AVs in place of manually driven vehicles, including cars, taxis, and even buses. Such an extreme paradigm shift can be represented in the model by modifying a range of car and taxi parameters including parking time, vehicle speed, perceived cost, and crash rates.
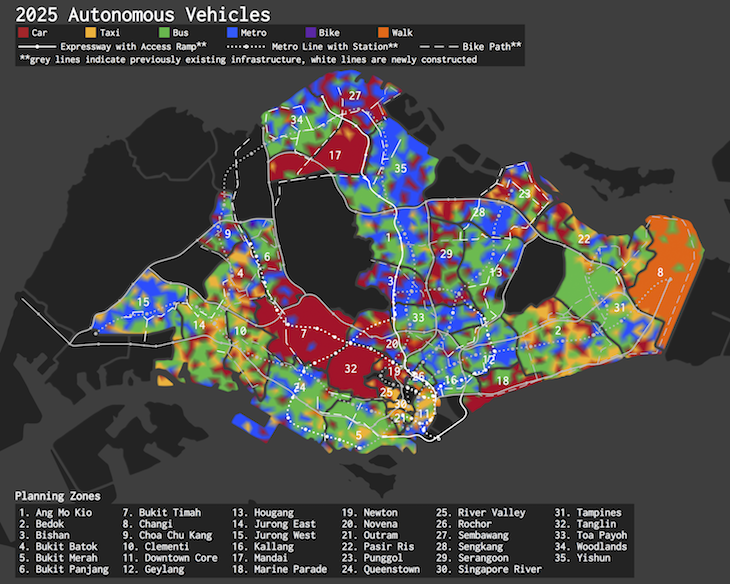
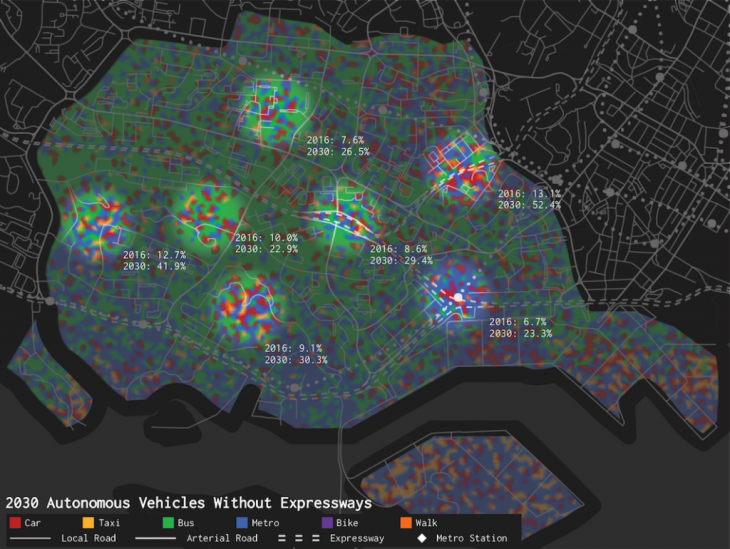
By comparing the mobility topography map for scenarios one and two above, there are several interesting conclusions to be made, for example in zone 31 and the surrounding medium income residential zones where present day occupants rely on a mixture of car, bus, and metro transport for their commutes. When AVs are introduced into this environment, the MTM predicts that most of Pasir Ris and large swaths of Bedok and Tampines would switch to AVs, despite facing a 23.8% increase in average cost per trip.
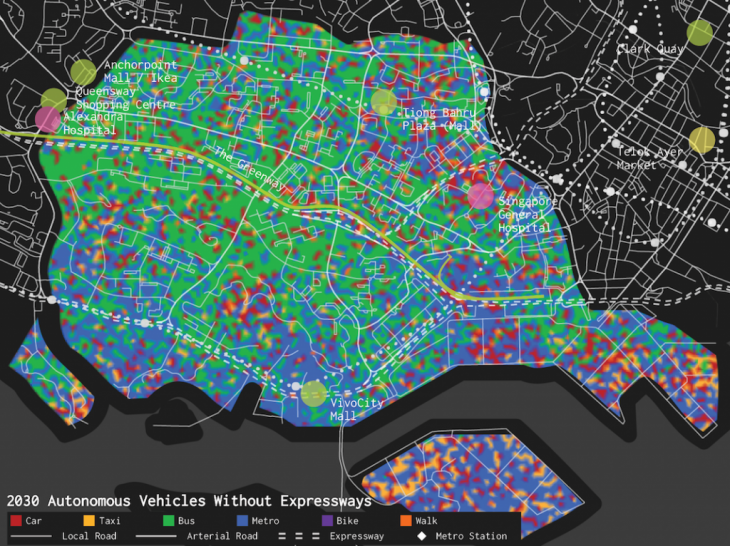
The third scenario is a more distant projection of Singapore as it might exist in 2040, with the main assumption being that the entire network of restricted-access expressways will have been removed. This significant planning decision is simulated by reducing vehicle speed parameters on expressways to zero, forcing the model to consider only direct routes for cars and taxis.
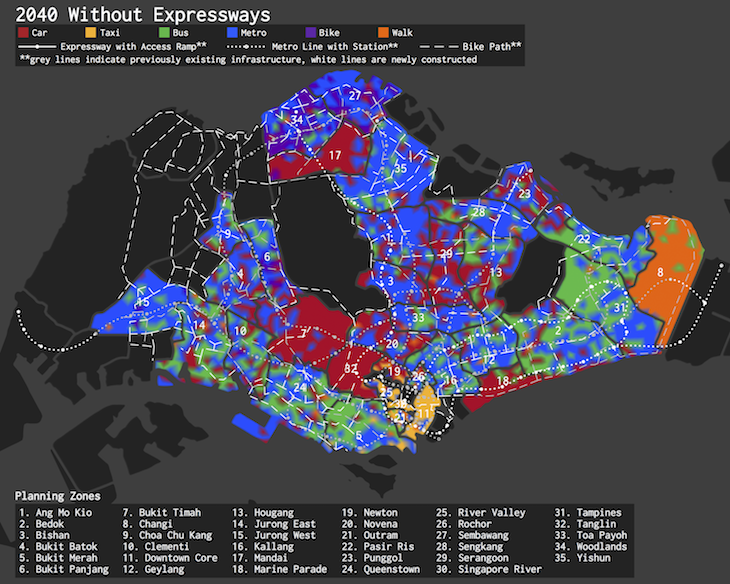
Without expressways the calculated probability for residents of Tampines, Bedok, and Pasir Ris to travel by car drops dramatically by 2040. The general shift towards mass transit predicted by the MTM comes with an 11.3% increase in average travel time, while the average cost per trip drops by 31.1%. The implication of this analysis is that expressways and tolls perpetuate a two-tier transportation system. Without expressways to divide the urban fabric, the model concludes that mobility would be more democratic and substantially cheaper.
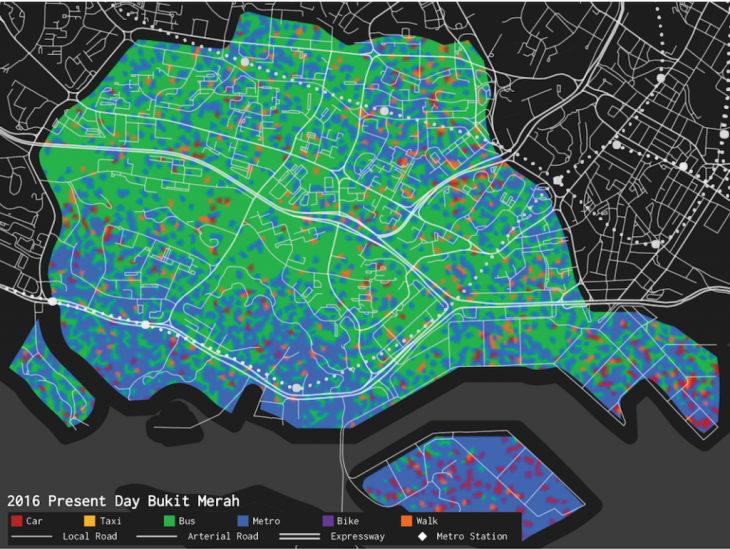
With that conclusion in mind, the next step is to apply the mobility topography model to a single zone at a high resolution. Here the map is focused exclusively on Bukit Merah, a large planning zone adjacent to downtown with a mixture of residential, industrial, and recreational occupancies. This map of present day Bukit Merah indicates that metro stations are a strong factor in determining metro use. Between the stations residents appear to rely more on bus travel than other modes.
The next map presents a hypothetical Bukit Merah with widespread AV use, but also where expressways have been removed as per the recommendation of the previous section. Comparing the two mobility topography maps above, it is immediately apparent that car use within Bukit Merah increases dramatically. Most likely this is because the expensive road tolls for using the highways are prohibitive for the low-income resident population. Without expressways, car use becomes much more affordable, and as the model predicts, much more attractive.
Notably there are several pockets within the district that are predicted to experience a dramatically increased probability of car use. These pockets are highlighted in the next map below. It is these regions that will be the battleground for encouraging the adoption of environmentally and socially sustainable transport. Without concerted efforts to combat the inherent ease of AV use with more attractive options, the spooky, solitary worlds of science fiction films like WALL-E and Minority Report could become reality.
The map below imagines Singapore in 2035 following the introduction of built programs into the large voids of the former expressways, along with a new public transit route. The proposed urban interventions include an expansion of the existing Singapore General Hospital into a health and wellness-oriented Hospital Village,a new economic hub and marketplace at the Viaduct Centre, and a combined cultural and residential district at the Greenway Terminus focused on sports and community infrastructure.
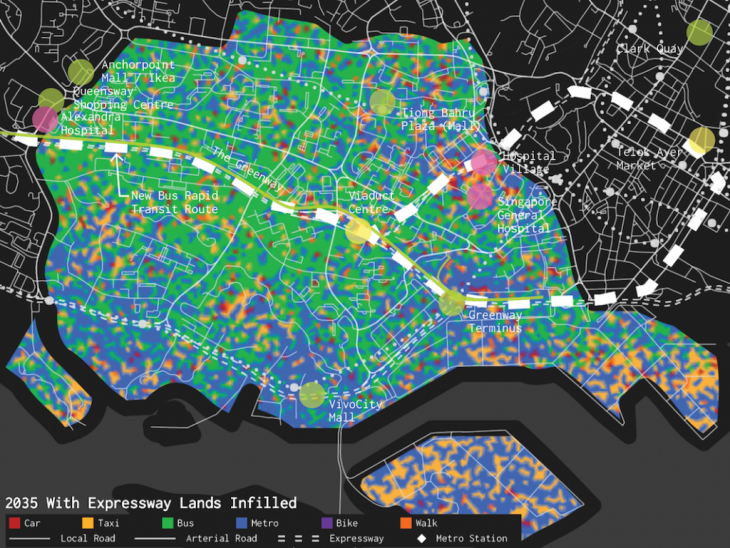
These proposed interventions result in a significant reduction in private vehicle use within Bukit Merah from 18.4% to 12.9%. The model also predicts an 8.7% drop in the average cost per trip, and a 7.4% drop in harmful greenhouse gas emissions.
The intent of this project was to construct a predictive model that would complement the existing toolkit for transportation planning. Certainly, the MTM is capable of completing tasks that would be arduous and nearly impossible using other types of models. While this is currently a speculative project without empirical evidence to validate its predictions, the MTM is still a potentially valuable tool for planners to consult during the decision-making process. Indeed, the substantial urban analysis demonstrated here barely probes the surface of the conceivable applications for this tool. The model is currently hosted by the Institute for Advanced Architecture of Catalonia (IAAC), and is available for download as a stand-alone application. With an active internet connection, the model is capable of collecting feedback from users.
Download URL:
http://students.iaac.net/singapore-mobility-topography-model/
The MTM implementation described in this paper compresses hundreds of megabytes of data relevant to a system of urban transportation into an intuitive and accessible tool. Essentially, it is an intermediary between the unimaginable complexity of an urban transportation system and the innate creative process of the human imagination. It is said that truly original ideas are incredibly rare, and that most ideas are in fact syntheses of observed information. As such, the primary strength of the MTM is that it permits observation and analysis of the previously invisible mobility layer of cities. With access to this data, solutions to complex problems can be synthesized and verified through a free exchange of information between the new tool presented here and the mind of the designer.