Introduction
This project is an excerpt from the Internet of People studio, which focuses on data related to the rental housing market in Barcelona’s Eixample district. We will explore a data analysis process to understand rental listings on the Fotocasa real estate portal. Our analysis used Python to clean and transform a large data set of unique property listings posted on the platform in 2019. This blog will explore our process, outcomes, and insights.
Libraries Used
Import pandas as pd
Import geopandas as gpd
Import matplotlib.pyplot as plt
From glob2 import glob
Import numpy as np
Import seaborn as sns
Part I: Cleaning & Sorting
We began with a CSV data set from Fotocasa. At over 1.9 million entries, it included all real estate listings posted across Spain in 2019. By nesting for loop operations, we cleaned and filtered this data extensively.
1st loop: set Python to read and clean each data file one by one
2nd loop: separates CSV values into columns and produce geometry points
3rd loop: produce a new data frame for Barcelona only
4th loop: produce a new data frame for rental listings only, clipped to the Eixample district, and rotated the geometry for visualization purposes
After the nested for loop process, we created a new data frame by merging and concatenating the outputs. Ultimately the original data set was cleaned from 1.9 million listings to just 74,462.
1. Fotocasa listings weekly in 2019
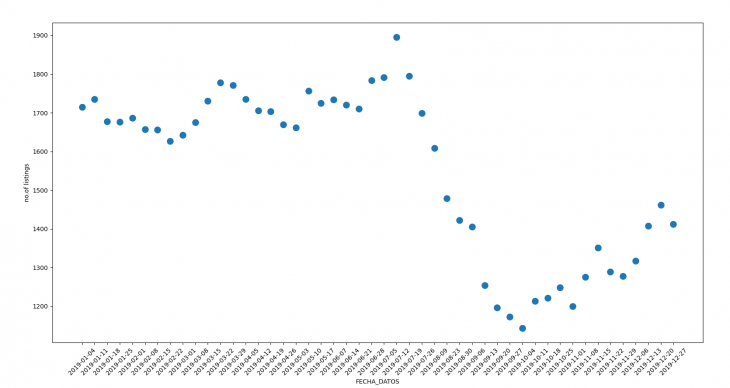
2. Number of listings weekly in 2019 (Scatter plot)
Part II: Processing and Transforming
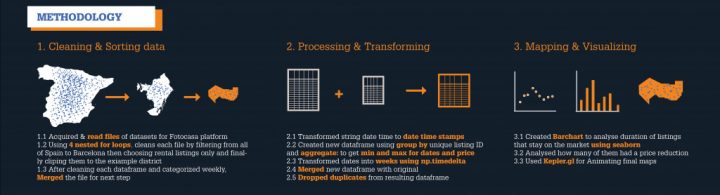
3. Methodology
With the data set cleaned, we applied multiple transformations. Firstly, the date information on each listing had to be converted from text string into a data readable format. This was achieved using the pandas library date time function. Next, we created a new data frame using the group by and aggregate function. We grouped the listings by the unique location ID (when a listing is renewed or reposted, Fotocasa generates a new listing but keeps the same location ID), then aggregated listings by their start and end dates to find the total duration of time each unit stayed on the market. The output in days for each listing was then transformed into weeks using the numpy library time delta function. Additionally, the listings were aggregated by start price and end price to determine which listings had their initial price reduced while on the market. Finally, the resulting data frames were merged with the original data set and dropped duplicates.
Part III: Plotting and Mapping
Once the transformations and sorting were completed we plotted the number of listings available each week using seaborn and the duration for which they were listed. In addition, we plotted the price reduction to reveal the proportion of listings that reduced their initial price before being rented.
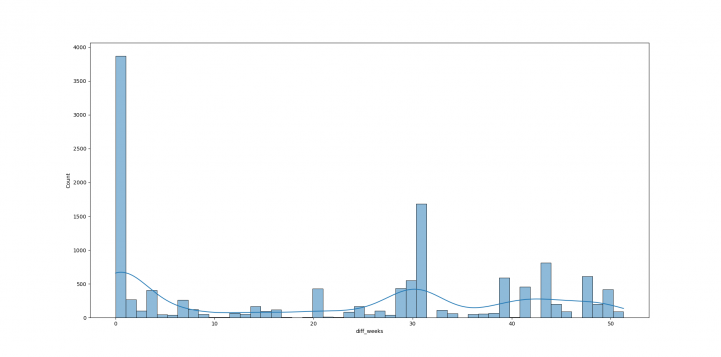
4. Duration of property listings available on the market
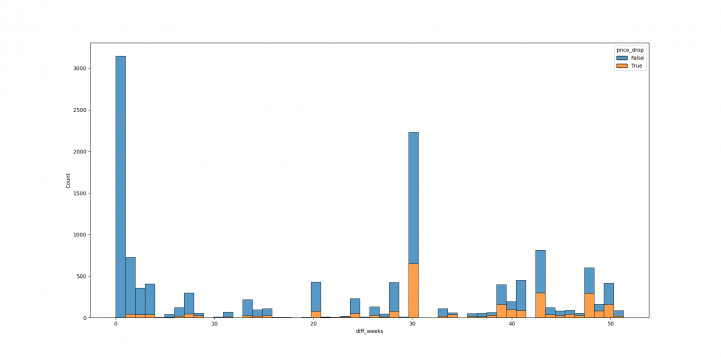
5. Change in price of available listings in the market
The final output was further visualized using kepler.gl geospatial data visualization tool.
Poster :
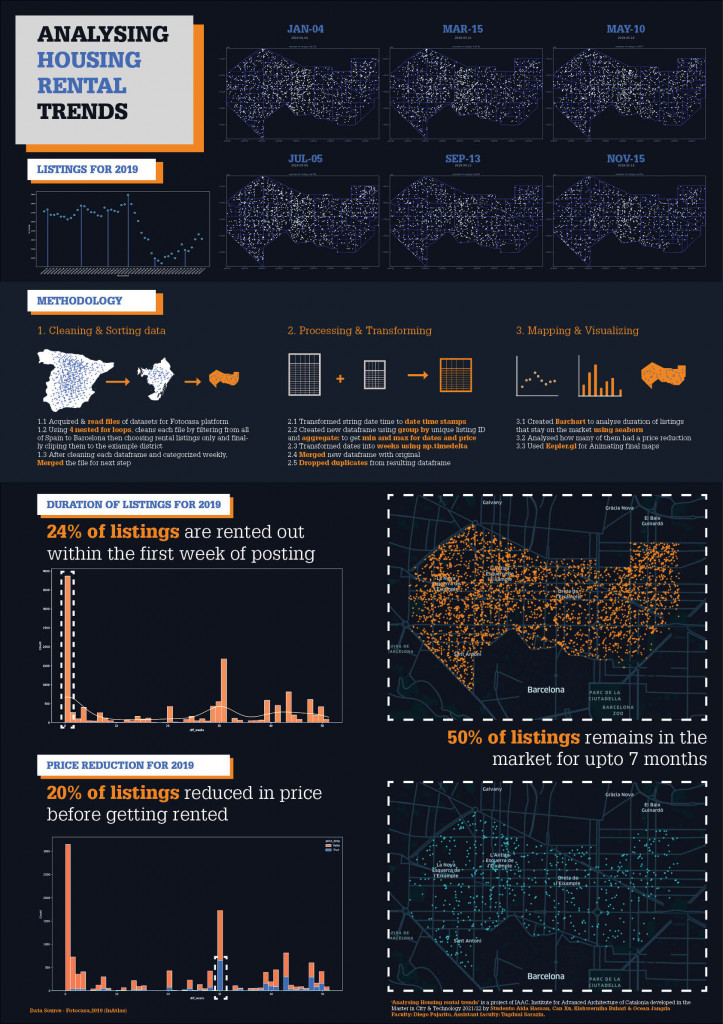
Poster: Analysing housing rental trends
Conclusion
The trends in the rental market that were revealed over the course of the analysis are:
- Around a quarter (24%) of the apartments listed with Fotocasa in 2019 were rented within a week. Unsurprisingly, none of those units changed their asking price.
- There was a dramatic drop-off in apartment listings at the beginning of the school year.
- Overall, only 20% of all listings were reduced in price before going off the market.
- 50% of the listings were on the market for 7 months or more
The process of the analysis revealed trends and patterns that could not be foreseen, so this surely establishes the potential for this type of analysis for the housing rental market.
‘Rental Market Trends’ is a project of IAAC, Institute for Advanced Architecture of Catalonia developed in the Master in City & Technology 2021/22 by Students: Aida Hassan, Can Xu, Kishwerniha Buhari, and Ocean Jangda and Faculty: Diego Pajarito, Assistant faculty: Tugdual Sarazin