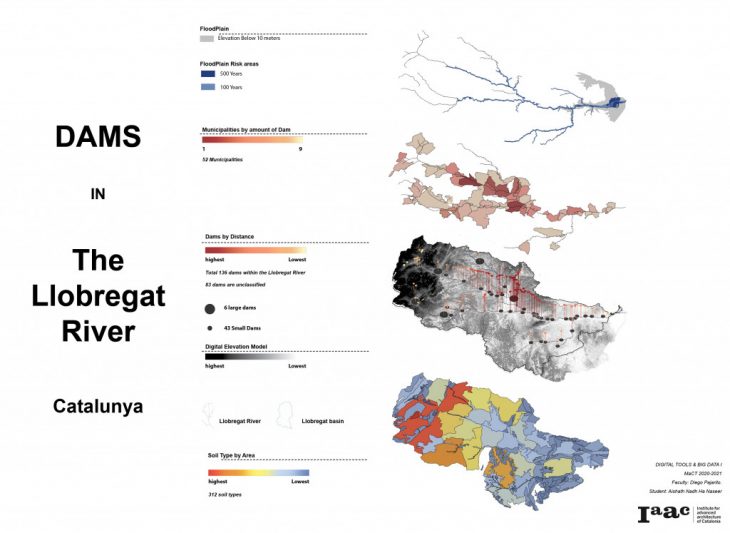
The project aims to analyse the llobregat river by looking at elements that are imposed by humans such as dams onto the river.
the analysis begins with the collection of raster images to create a digital elevation model of the area. As the focus was on the Llobregat River, the Raster file was clipped by the extents of the basin in which the river falls into. This Dem raster image was resampled to 100 cells and translated to an Asc format to prepare it for the importation into grasshopper platform.
Dams were imported through data found from open street maps and combined with manually added points from google earth that were imported to the Qgis platform to visualise them. Dams were filtered by the ones that appear only on LLobregat River Basin. With the aim of understanding where the dams accumulate a heat map was created by calculating the distance between these dams. once this was done the municipalities in which these dams fall into was filtered and the number of dams per municipalities was generated before the data were exported as csv files to be imported to grasshopper to visualise in an axonometric view where the heat map was now represented in a gradient and as changing heights.
To view the floodplain the dem was used to calculate the lowest elevation level and the flood risk areas was imported by WMS which had its limitations in accessing the actual data therefore an image of this visualisation set to canvas extent was taken to maintain the geolocation values. the image was imported as a raster and converted to a shape file which was then taken to grasshopper where it was visualised in an axonometric view along with the rest of the elements.
Data Sources :
- Generalitat de Catalunya
- Google Earth
Llobregat Dams is a project of IAAC, Institute for Advanced Architecture of Catalonia developed at Master in City & Technology in 2020/21 //Digital Tools & Big Data
Student: Aishath Nadh Ha Naseer,
Faculty: Diego Pajarito.