LIVING WORK-SPACE | creating an evolving work environment by using data
The aim of “Living Work-space” is to create a tool for optimizing the layout of the workplace using sensors and tracking algorithms.
Introduction
One of the goals while developing this tools is to address the gap between design intent and real use over time and fill that gap by continuously collecting data that can by implemented in the design development process.
Objectives:
> Analyse a work-space
> Collect data about how a work-space is
> being used
> Visualize the data
> Data analysis
> Using the data for space optimization
In a famous scene in the movie “The Founder” there is a simulation of workflows in a kitchen layout drawn with chalk on a tennis court. Is where the McDonald brothers test their method for time-optimizing the burger-making. They observe, track and analyze the motion of the workers. They use the data in a qualitative method to adjust the layout. A series of iterations are being examined until the best layout necessary to achieve maximum efficiency is found.

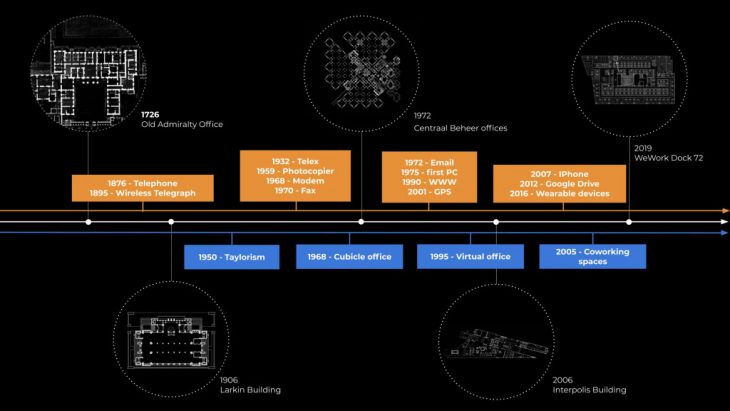
Historic Overview
Numerous forces have shaped the workplace, one of the most significant being advancements in technology that have changed how communication is being conducted. In fact, the design of offices has evolved through the lenses of social, economical, and technological forces that have also shaped society in its entirety.
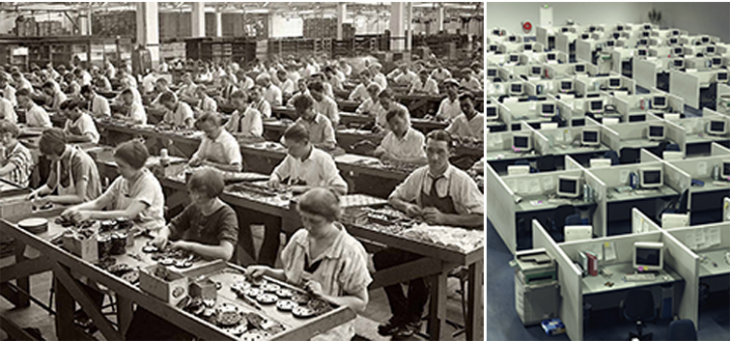
Taylorism VS Cubicle Farms
One of the first workplace trends is known as Taylorism (ca. 1904), named after its founder Frederick Winslow Taylor. Taylorism is characterized by the notion of systematizing the workplace into a hierarchical management of activities. As a result, separate offices are dedicated to intellectual work so that the employee may not be interrupted. For the more mechanical work, an open space is populated by rows upon rows of desks and narrow corridors where the superintend can encircle the clerks to ensure that work is being done through proper supervision.
The implementation of cubicles in the workplace are a result of Action Office I and II (ca.1964). Also known as the Cubicle Farm Office (ca. 1980) this desk setup was a cheap and easy way to concentrate many workers into one space while accounting for privacy. These standard issue composition was not much different than the Taylorism style.
(Below: Left – Taylorism style office, Right – Cubicle setup)
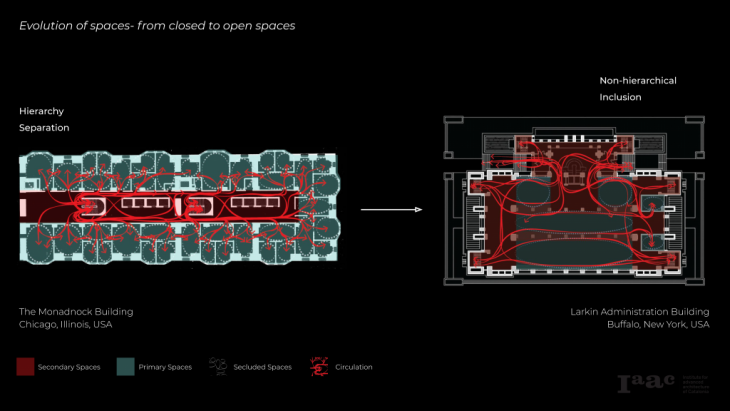
We conduct a comparative analysis of two exemplary office layouts: The Monadnock Building and the Larkin Administration Building. The spaces are divided into primary and secondary and we look into overlaps, divisions and circulation. The former is an example of isolation of spaces while the second is an open plan with overlapping functions.
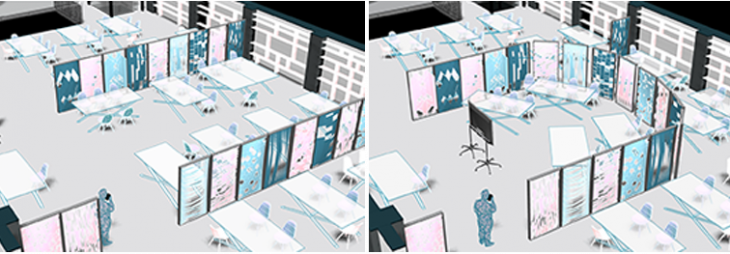
Space Analysis: Atelier
To conduct our experiment we used the first floor of the IaaC Atelier.
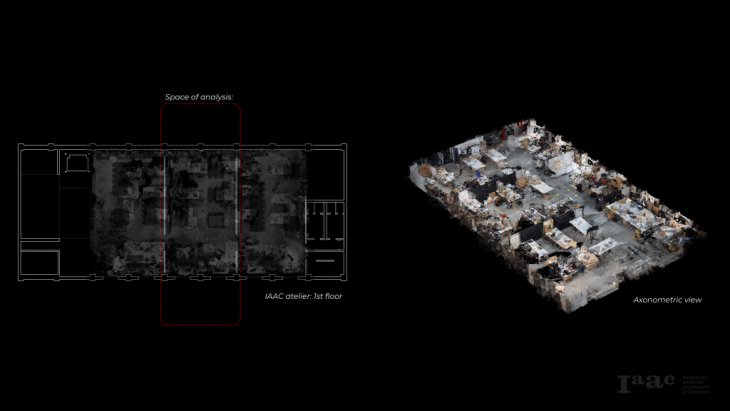
We scanned the space to create a point cloud that we can use for analysis and data extraction.
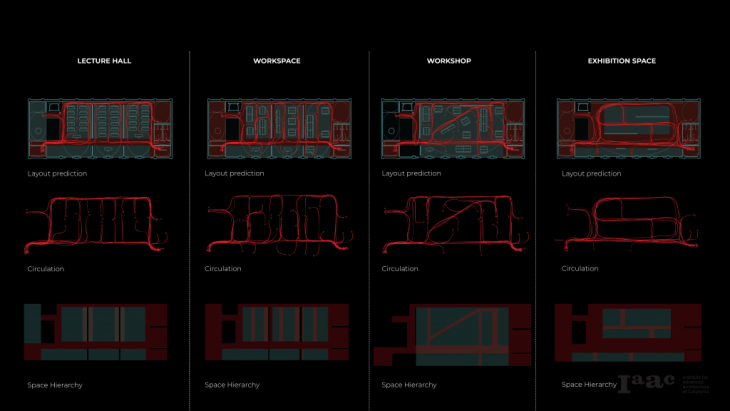
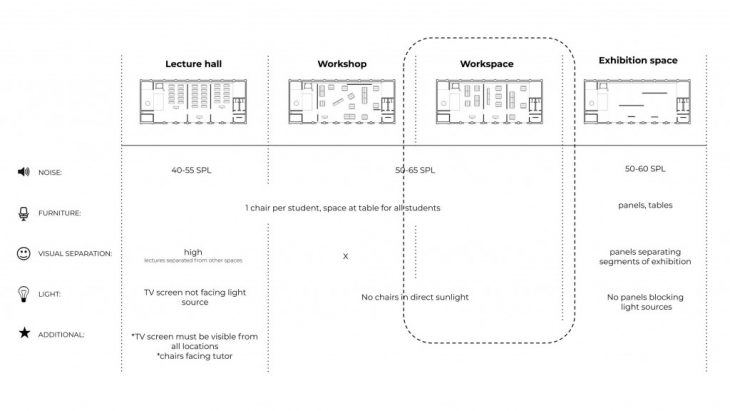
The atelier’s first floor has four main functions:
> Lecture Hall
> Workshop
> Workspace
> Exhibition Space
These functions are being depicted below. We conducted the same analysis as shown in the precedents studies to understand the differentiation between primary and secondary spaces.
Furthermore, we define some criteria that needs to be satisfied to support the best outcome of each function.
Current methods of analyzing space occupancy:
Path simulations made intuitively by hand and Path simulations using agent-based analysis.
DepthmapX – a program designed to understand social processes within the built environment. It is based on theories behind Space Syntax.

Data Organization
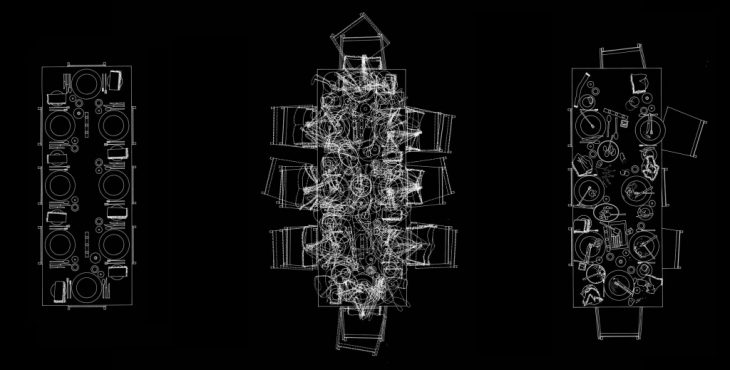
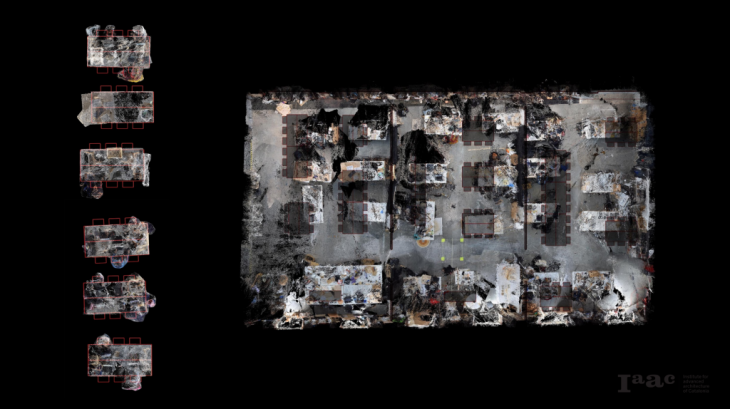
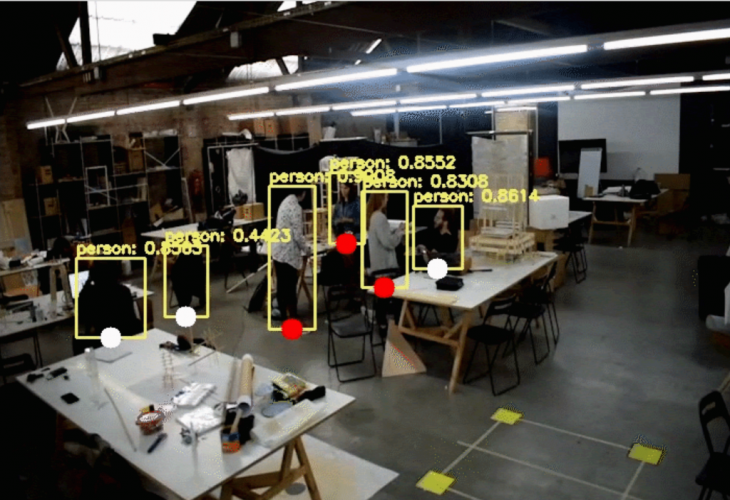
We used Computer Vision to detect the users of the space. We recorded footages throughout different times of the day and input each file through the YOLOv2 neural network trained on the COCO Dataset. Inside out algorithm we isolated the class ID “person” to avoid detecting and tracking other objects. To visualize each detection and the tracking point we used OpenCV functions to draw the bounding boxes and a circle on each box. The center of the circle is the point we are tracking and storing.
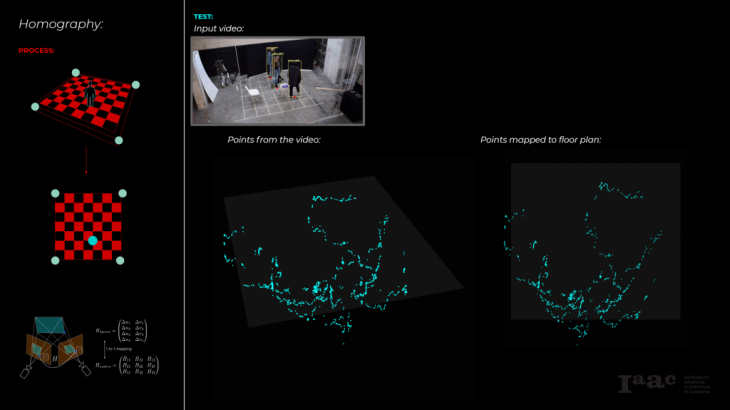
To do the mapping of our recorded data to the floor plan, we marked 4 green points on the floor and used a color detection algorithm to locate and store coordinate data of those points.
Our outputs were two coordinate files that we input into Grasshopper and used the homography process to do the mapping.
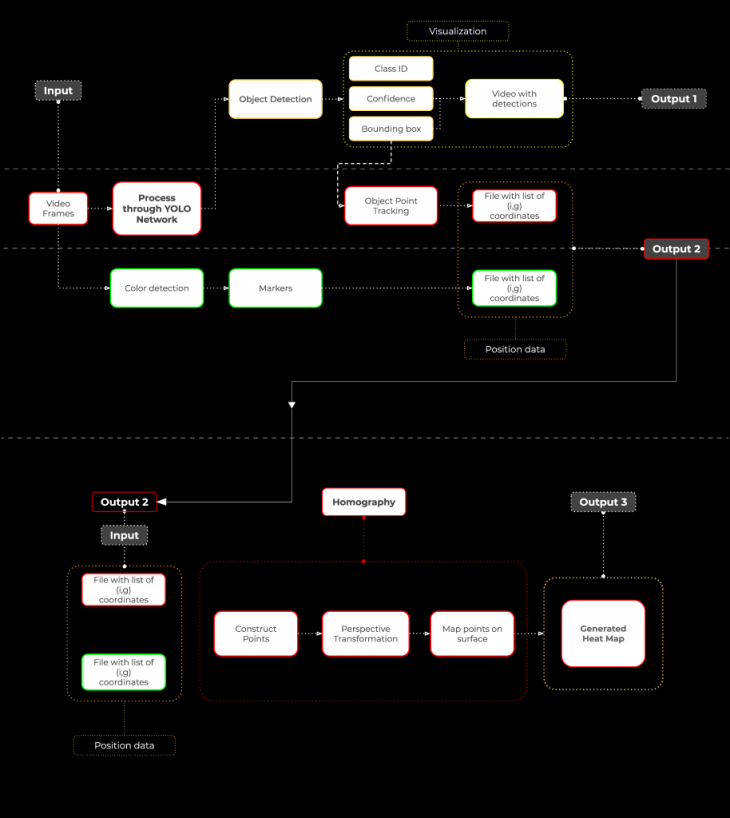
The visual output is a video that indicates the class ID, the confidence and the bounding box.
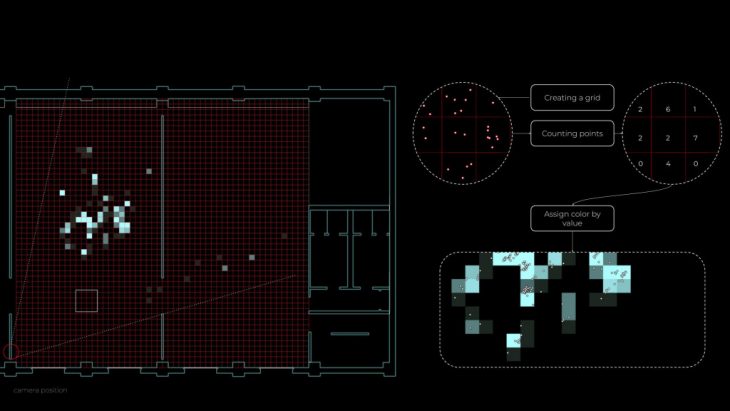
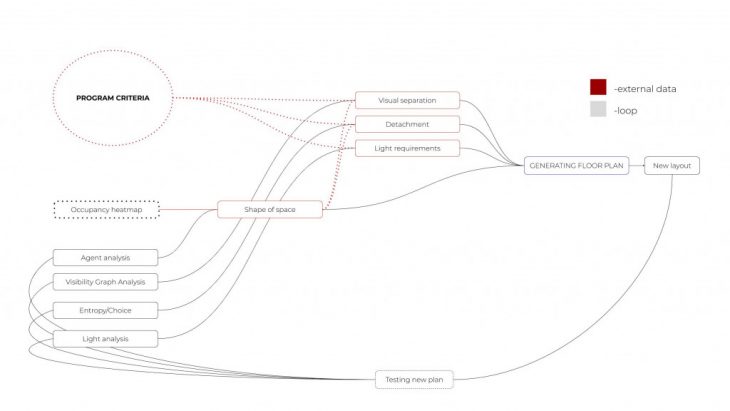
Generating the heat-map according number of points on the floor plan using homography to project the points of the coordinate files and create our diagram.
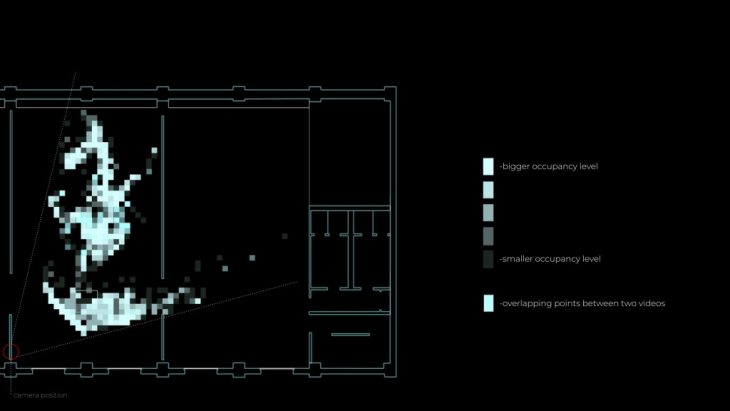
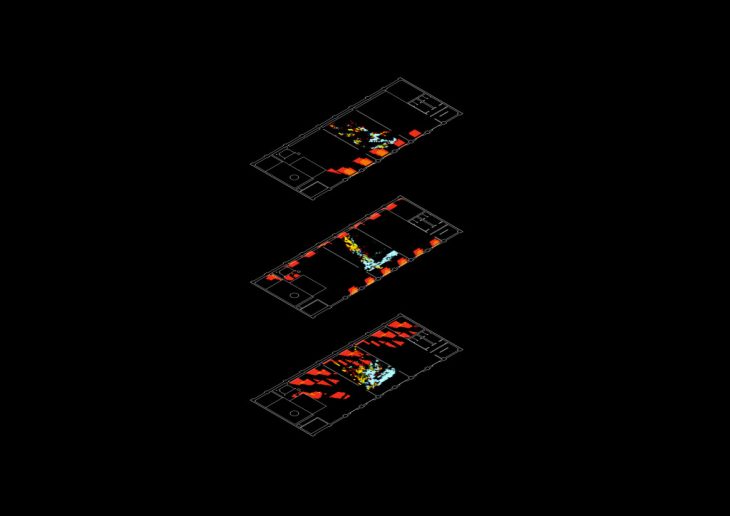
Mapped Data
Occupancy Data
External Data
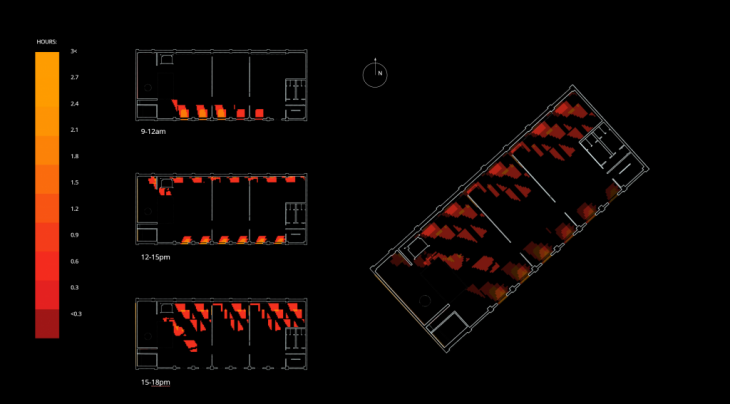
Natural Sunlight Analysis
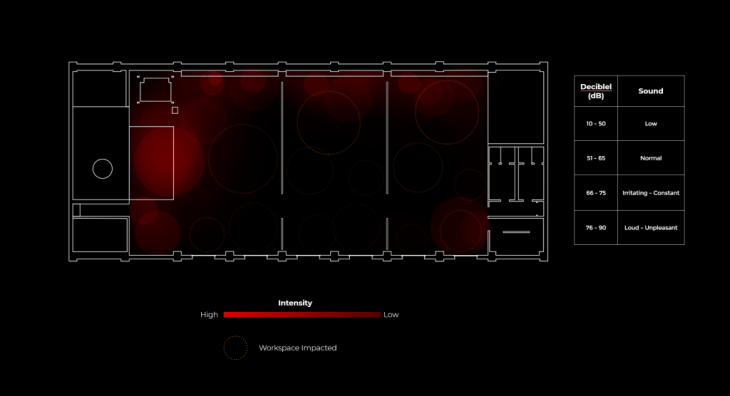
Mapped Noise Data
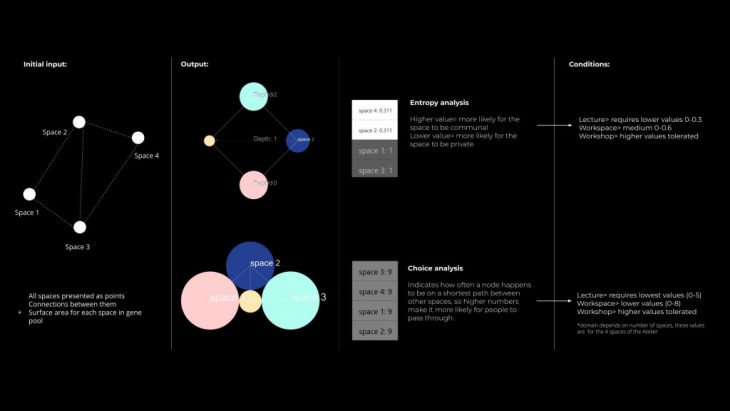
Syntactic Analysis of Spatial Properties
Entropy analysis
Higher value= more likely for the space to be communal
Lower value= more likely for the space to be private
Choice analysis
Indicates how often a node happens to be on a shortest path between other spaces, so higher numbers make it more likely for people to pass through.
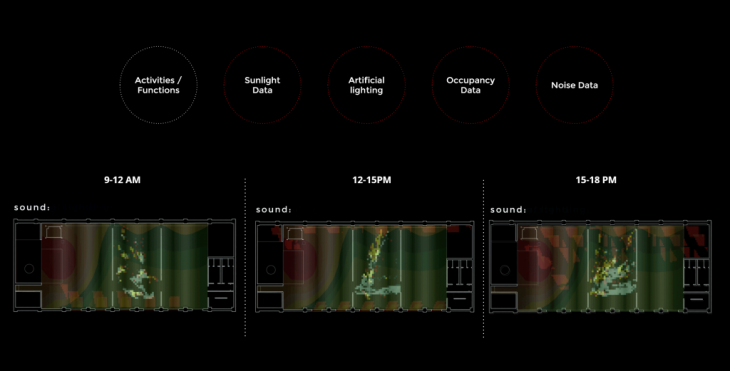
Datasets and Conclusions
Our datasets consist of:
> Activities/Function
> Sound Data
> Artificial Lighting
> Occupancy Data
> Noise Data
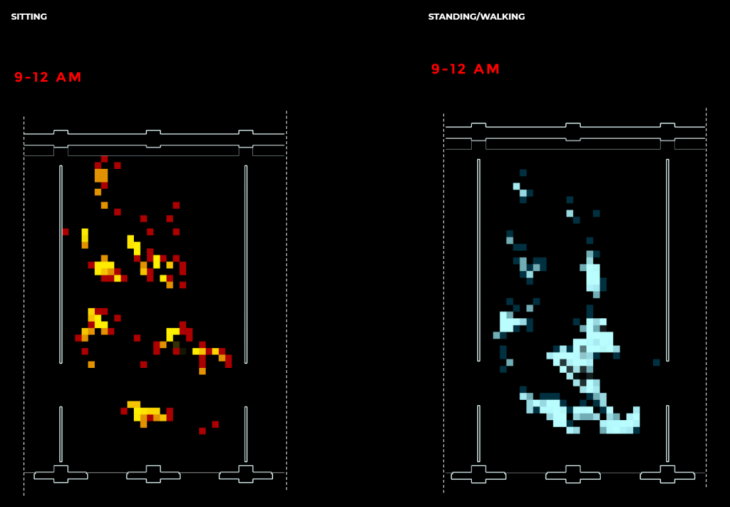
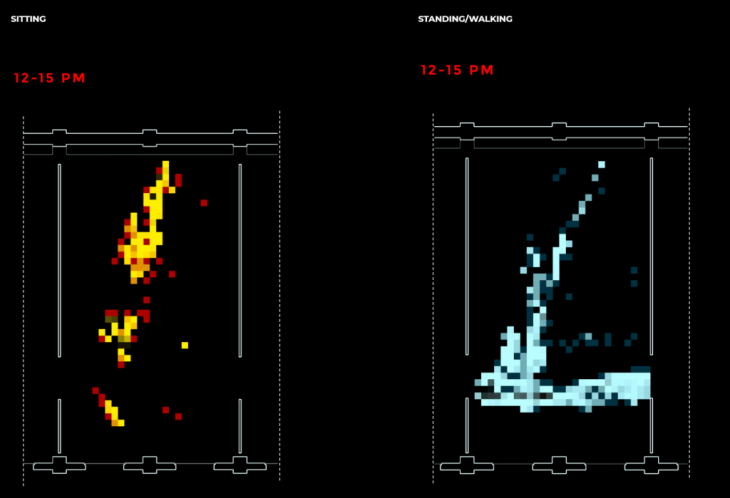
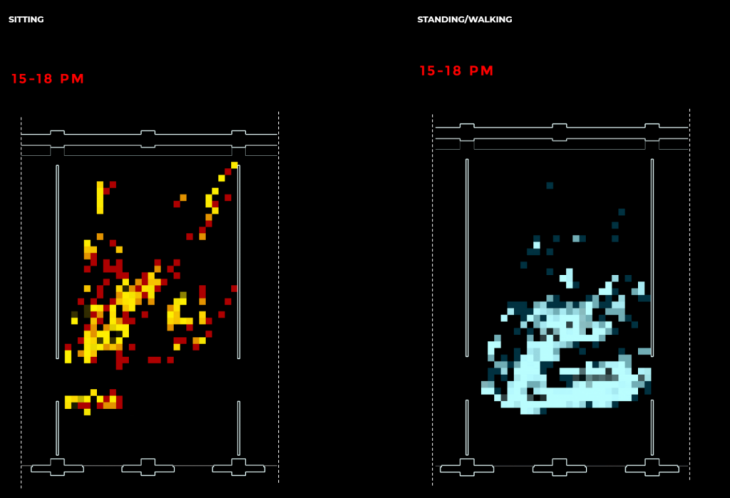
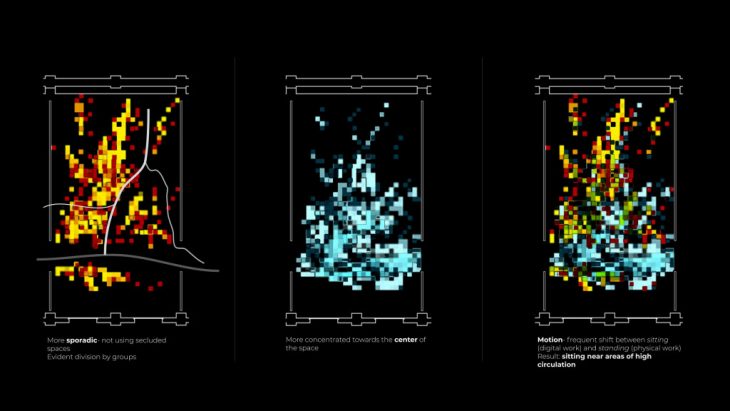
What we conclude from our analysis is that:
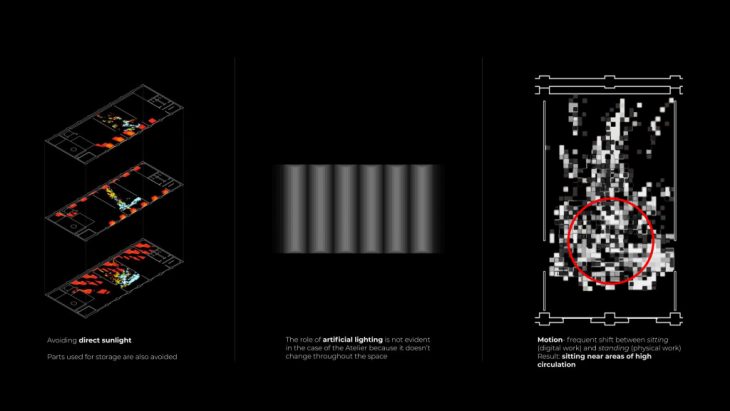
> There is a frequent shift between sitting (digital work) and standing (physical work).
Result: sitting near areas of high circulation
> Users tend to avoid direct sunlight. Surrounding areas used for storage are also avoided.
> The most active part is the middle space which students created by rearranging the tables.
Signifies that a central space for gathering might be a good addition.
Living workspace is a project of IaaC, Institute for Advanced Architecture of Catalonia, developed at Master in Robotics and Advanced Construction in 2019-2020
Students: Lorenzo Masini, Gjeorgjia Lilo, Elena Jaramazovic
Faculty: Aldo Sollazzo, Daniel Serrano