KRAKAUERSTREET VIENNA
Digital Tools for Environmental Analysis for Architectural Design
Faculty: Angelos Chronis, Aristotelis Vartholomaios
Assistant: Hager El-Sokaily
Students: Maria Papadimitraki, Clemens Russ
Academic Year: 2021-2022
Abstract
Taking as inspiration the very strong winds that occur in the area, at the junction of Bruno Marek Allee and Taborstraße in Vienna, we wanted to analyze the environmental conditions and find measures that could improve the situation. We also wanted to examine the environmental impacts of the master plan, which won some decates before (such as the high-rise building next to our selected site etc.)
By using many different tools for our environmental analysis we became familiar with them and we found out for which results we will use each tool in the future for further projects.
01| Site Selection
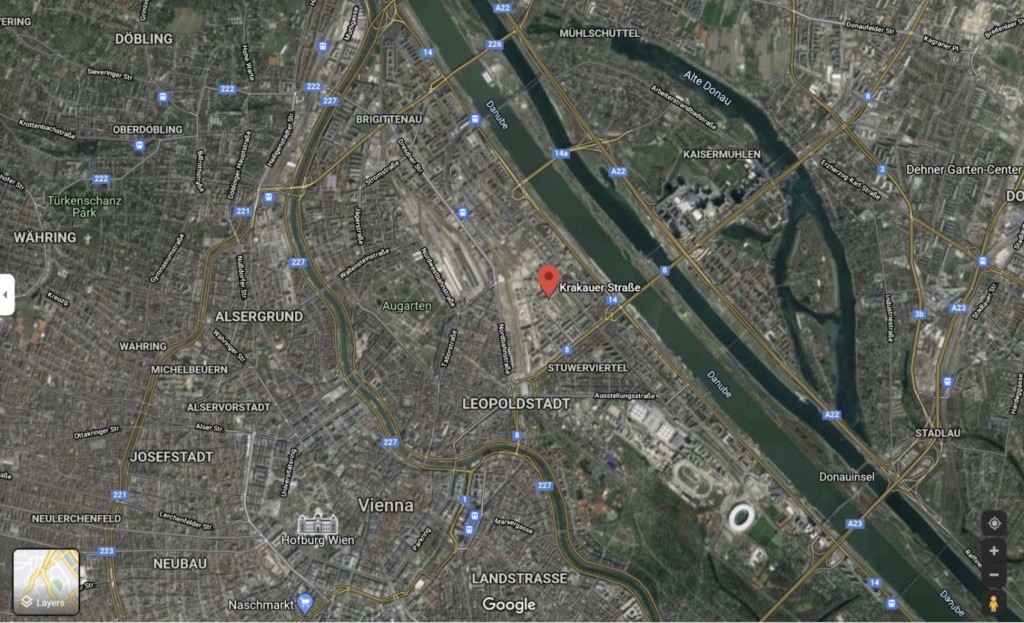
Image 1: Location. Source:
https://www.google.com/maps/
The area we wanted to analyze is the Nordbahnviertel District in Vienna. The exact address is Krakauerstreet 1020 Vienna, Austria.
The reasons why we selected this location are the followings:
- It is easily accessible from us in order to gather empirical data
- We can share our personal experience of the area
- There are strong winds all year long. Especially during the winter season the wind velocity increases. At the junction of Bruno Marek Allee and Taborstraße the wind velocity is on some days so high, that makes it inaccessible. Therefore we would like to investigate possible measures to improve the situation.
- There are high temperatures in summer. Especially at the main street – Bruno Marek Allee it is partially very uncomfortable. Taking the evaluation further we would like to investigate measures to decrease the temperature and to propose it to the quarter management.
- The temperatures during the winter are very low.
- IWEC Data are available. Therefor we will have fewer errors for our environmental analysis.
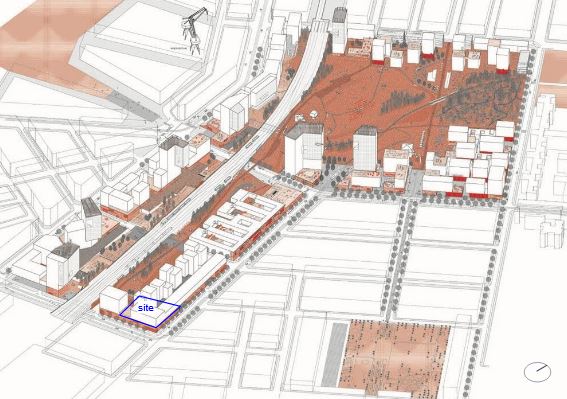
Image 2: Exact site location and orientation. Perspective of Studiovlay, winner of the urban development competition for the area in 2012. Source:
https://nordbahnhof.wordpress.com/page/2/
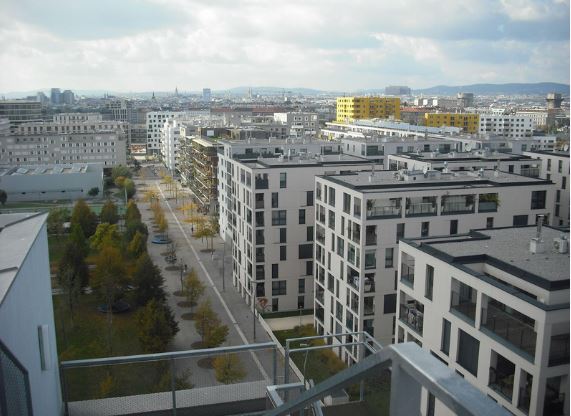
Image 3: View over the Krakauerstreet. Source:
https://de.wikipedia.org/wiki/Nordbahnviertel
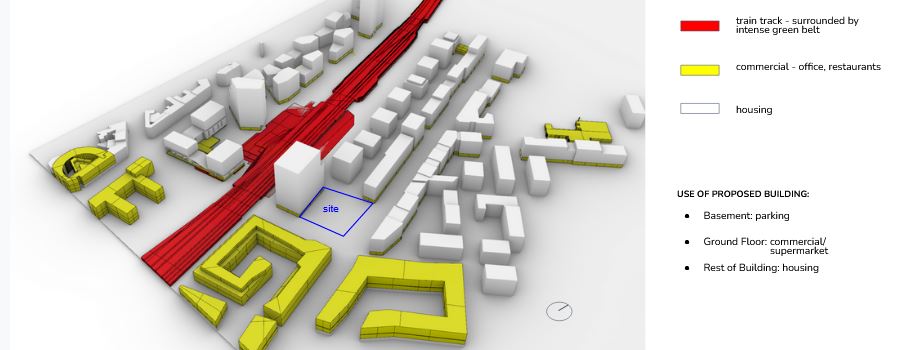
Image 4: Uses in the area
02| Local Climate Analysis
Air Temperature & Heating / cooling degree days
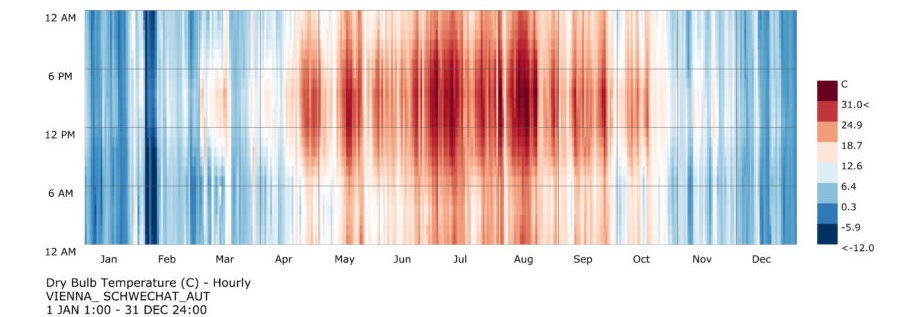
Image 5: Air Temperature (ºC)
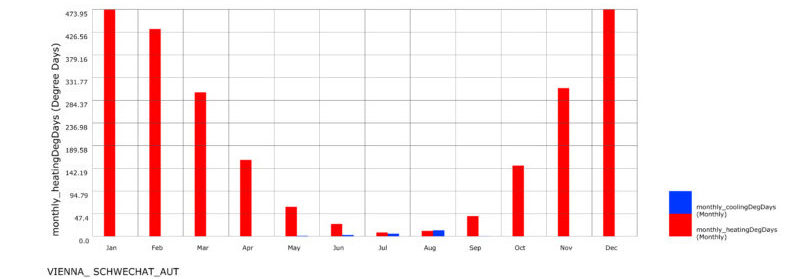
Image 6: Monthly Heating and Cooling Degree Days
What we observe from the first diagram (Image 5) is that the highest temperature throughout the year is 31°C and the lowest -12°C. The hottest period is from the end of April till the end of September, while the highest temperature appear in the end of June till the middle of August. On the other hand, the coldest months are seen from November till March, with the coldest temperatures to be observed in the end of January till the beginning of February. Regarding the hours of the day the hottest period is seen between 12:00 to 17:00.
According to the second diagram (Image 6) we understand that heating for the thermal comfort of the residents will be needed from October to April, while cooling systems probably will not be needed.
Global Horizontal Radiation
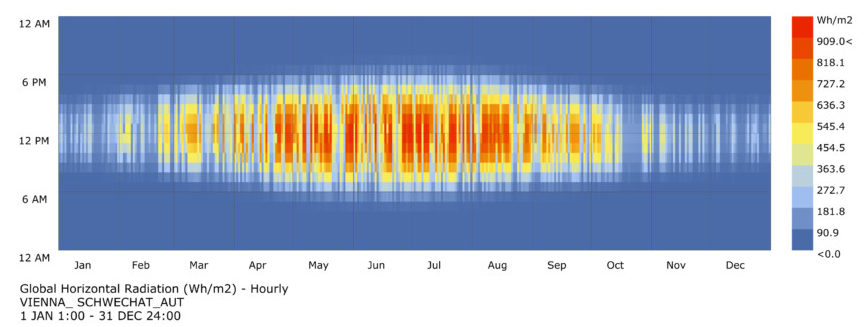
Image 7: Global Horizontal Radiation
What we observe from this diagram (Image 7) is that the most solar radiation is received in the period between April and August and from around 11:00 to 13:00. In comparison to the previous diagram of the air temperature we see that the highest temperatures occur a few hours later (approximately between 14:00 and 16:00). Furthermore 900 wh/m² would be a minimum for the use of PV cells. The use of solar thermal energy systems seem more feasible and useful over the year.
Relative Humidity
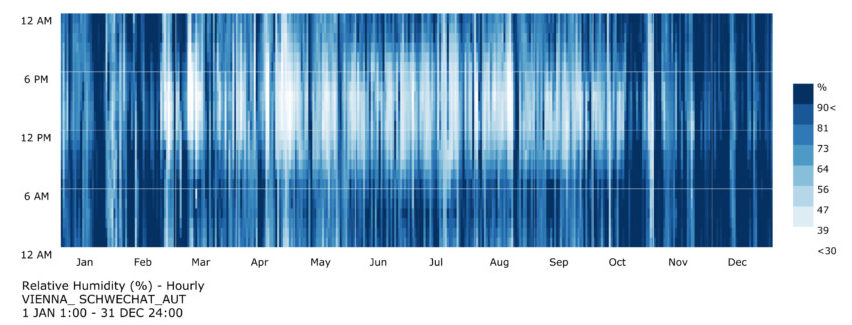
Image 8: Relative Humidity
According to the diagram (Image 8) the highest humidity is observed in the months between October to February. The lowest humidity is observed from March to September and from 12:00 to 16:00.
Wind Speed

Image 9: Wind Speed (m/s) – Hourly
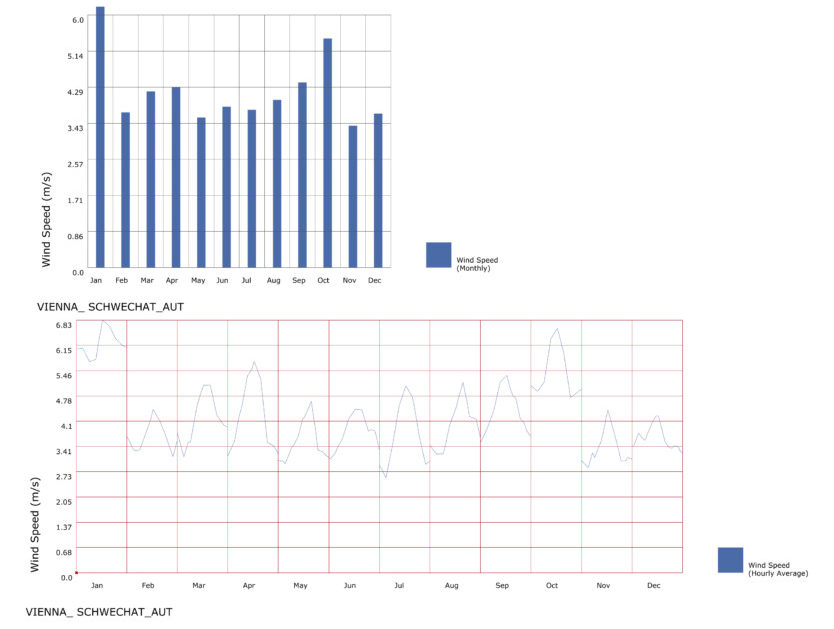
Images 10 and 11: Wind Speed monthly (m/s)
According to Image 9 the strongest winds are observed in January, while the months October, September, April and March are also windy. We can also understand that during a typical day in January the strongest winds appear around 12:00 pm. This trend appears more or less also in the rest months of the year.
Image 11 shows the wind speed of a typical day of each month. In comparison to the previous diagram, the results can be analyzed in a better way, due to the graphics style. From Image 10 we can see clearly that January is the month with the strongest winds.
Wind Speed and Direction
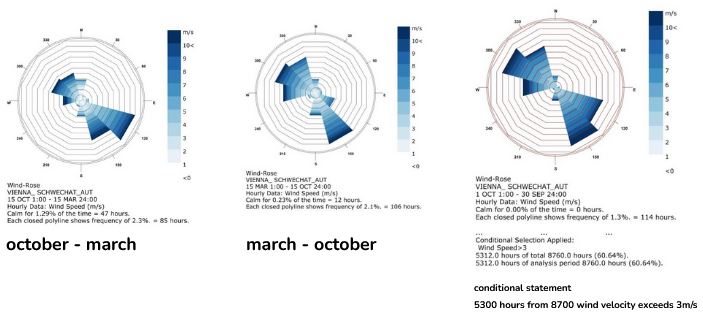
Image 12: Wind Speed and Direction
From the diagrams above we can understand that the strongest winds occur from March to October from 120 degrees. From March to October the direction is 150 degrees, while the northwest winds are also increasing.
03| Sun Analysis

Image 13: Sun-path in March, August and October
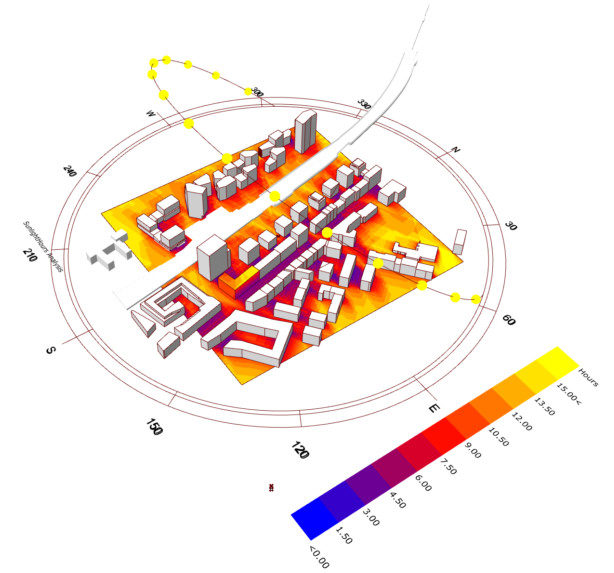
Image 14: Sun-path on a specific day: 12 July
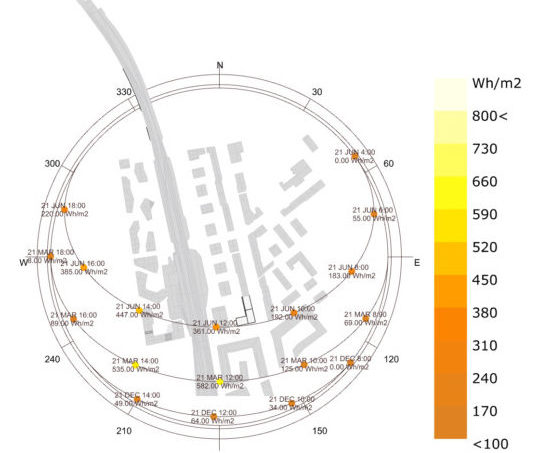
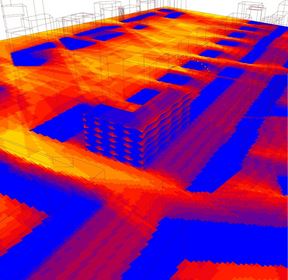
Image 15: Annual solar irradiation (Wh/m2)
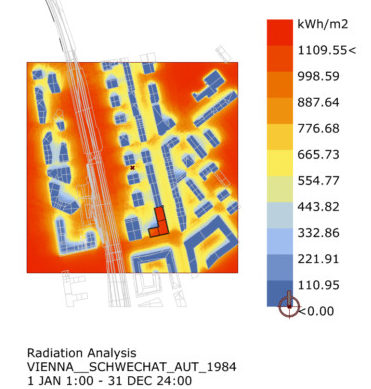
Image 16: Solar irradiation on 1st of January (kWh/m2)

Image 17: Annual Sky-dome, sky-dome in cooling period and sky-dome in heating period

Image 18: Detailed solar irradiation on 12. July

Image 19: Annual solar irradiation without shading
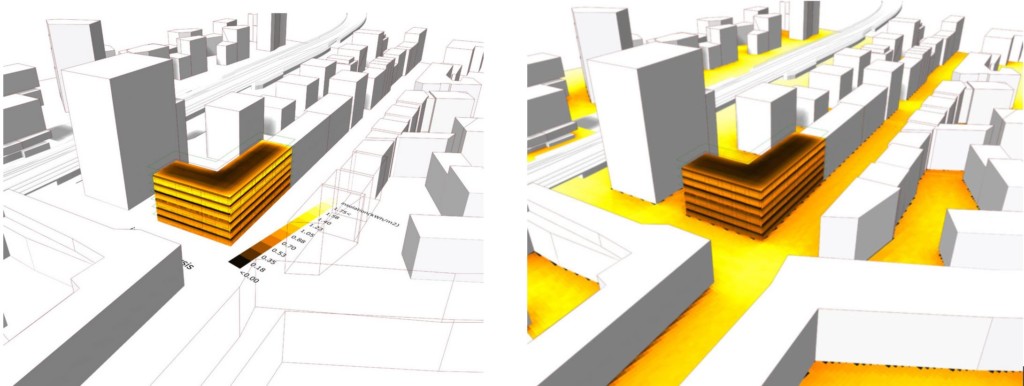
Image 20: Annual solar irradiation only massing (left) – Annual solar irradiation massing and surrounding (right)
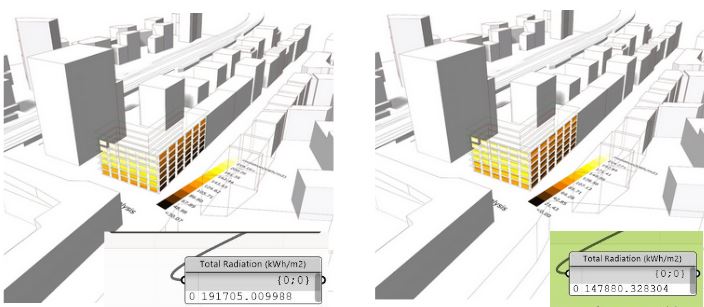
Image 21: Heating without shading in winter (left) – Heating with shading in winter (right)
What we can observe from the Image 21 is that in winter the 1,5m balconies are reducing the heat-intake (kWh) by 25%. Therefore a climate analysis (balancing summer with winter) must be conducted in order to find the best results for heating in winter & cooling demand in summer.
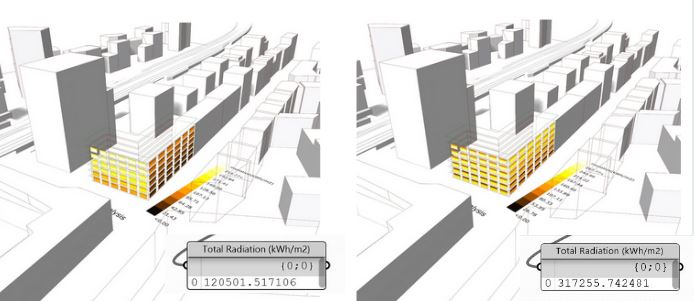
Image 22: Heating without shading in summer (left) – Heating with shading in summer (right)
As we can see from the image above (Image 22) in summer the 1,5 m balconies are reducing the heat intake (kWh) by 62 %!
Comparing the result of the summer and winter we can understand that the addition of balconies (as a shading system) is a good measure for the summer,
while for the winter the impact in heating need is not that big. However we will investigate in a better balcony form to have all possible advantages of the sun.
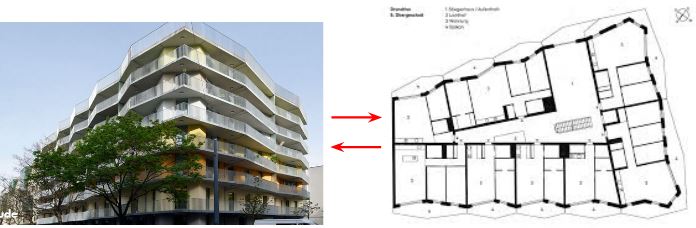
Image 23: Jagged shape balcony form – reference project u31 – 1200, Querkraft architects
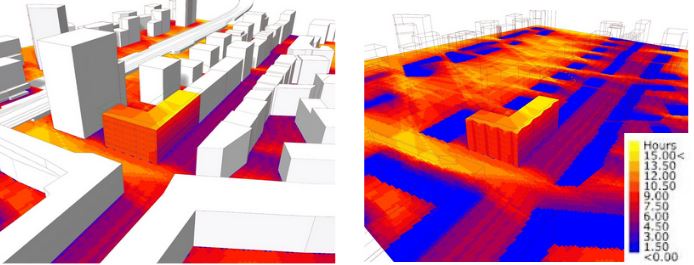
Image 24: Shading basic shape 1,5m without balconies (left) – Shading jagged shape 1,5m balconies & 1,5m loggias without balconies (right)
As we can see from the comparison of the simple shape balconies with the jagged shape balconies regarding the average sun hours at site there are about 12h without shading.
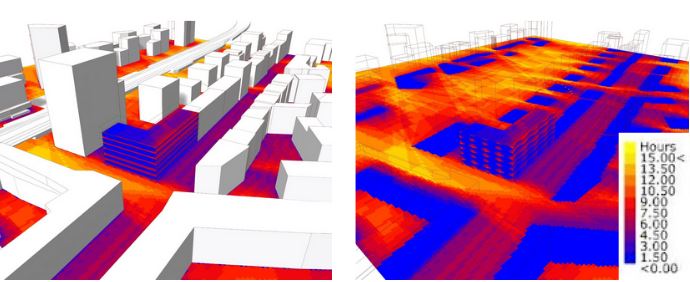
Image 25: Shading basic shape with balconies (left) – Shading jagged shape with balconies (right)
To sum up 1,5 m shading reduces the heat intake about to average 1,5-3 h (75% reduction)!
04| Daylight analysis

Image 26: Facade: openings & shading, uses of rooms
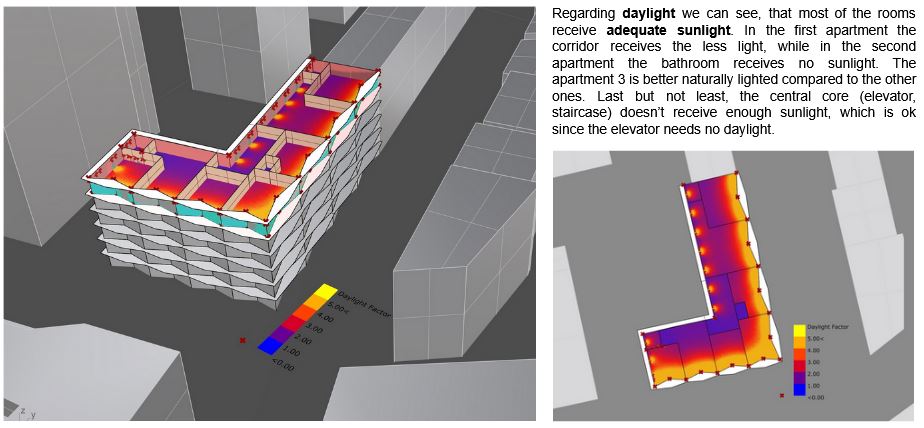
Image 27: Daylight
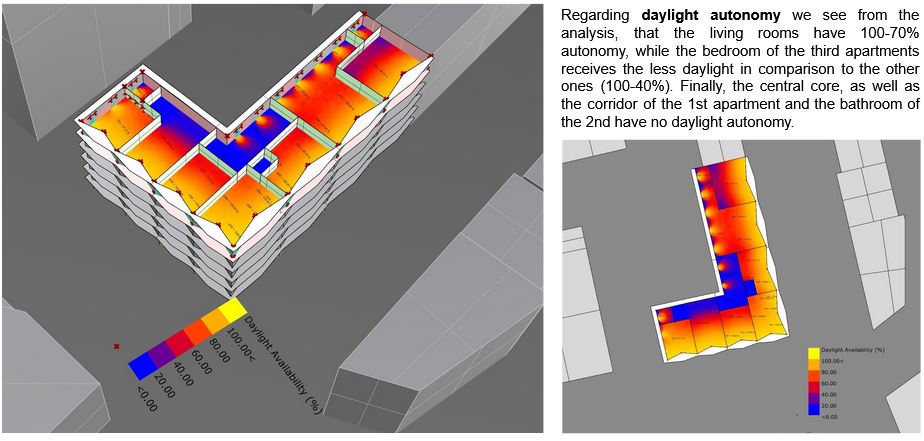
Image 28: Daylight autonomy
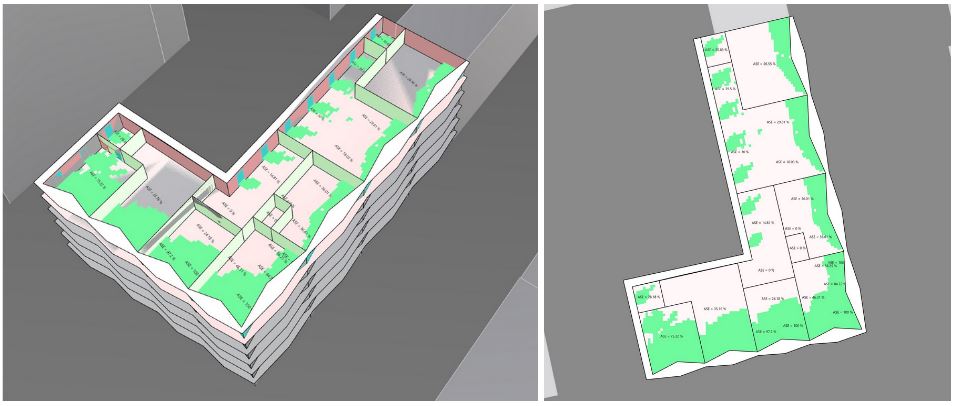
Image 29: Annual sunlight exposure (hours: 09:00 – 17:00, days per week :7)
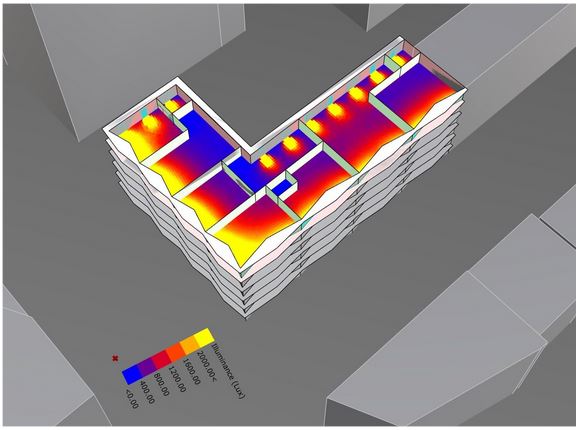
Image 30: Point-in-time illuminance (date: 21 June, time: 16:00)
Regarding the illuminance on the 21st of June at 16:00 we observe, that next to the southeast big openings the illuminance is more than 2.000 Lux, while the more we move away from this openings the illuminance is being reduced (reaching approximately 1200-600 Lux). As described before the rooms which receive inadequate sunlight, they have also very low illuminance.

Image 31: Point-in-time illuminance (date: 22 June, time: 16:00, 15:00 and 14:00)
As we can see from the image above the Illuminance on the 22nd of December (darkest day of the year)at 15:00 is starting already to get dark.
05| Wind study
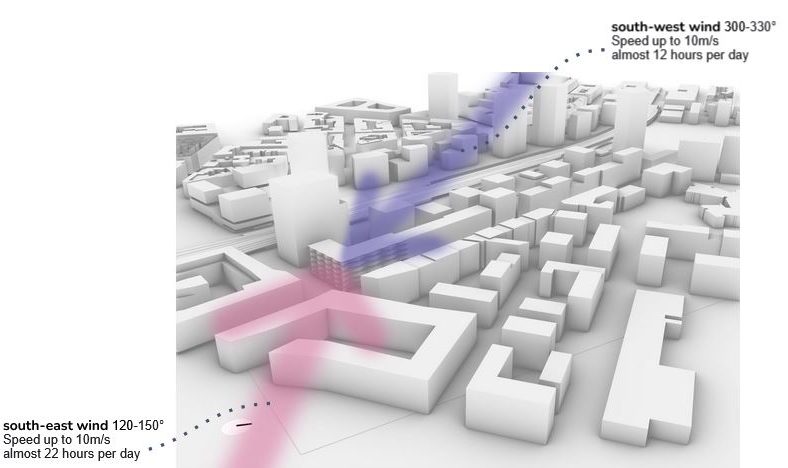
Image 32: Graphical prediction wind on site – wind direction October-March
With this graphical presentation of the Wind-Rose in our site, we can predict that the south east facade, where the largest openings are placed, will be affected by the strongest winds all year long. On the other hand, the smaller openings of the north-west facade will be also affected from winds, which are however not blowing all day long.
For the summer month, when the temperatures are high these winds will be helping the thermal comfort of the residents and the natural cooling of the apartments. However in the winter time these winds are not desired, since they will make the low temperatures seem even lower.
This is the reason why, we should try to protect the openings of our building from the strong winds. It is also good, that there are no windows of one room facing in both wind directions. In case one resident would opening these opposite facing windows at the same time, the generated through-ventilation would be unpleasant and would move various object and it would close with power the opened windows and doors.
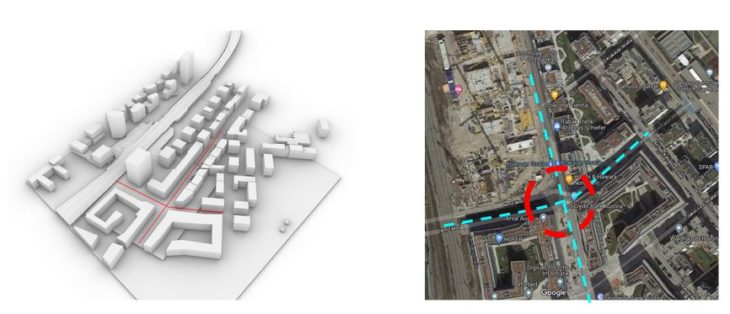
Image 33: Investigations focus
As clemens is living in this area, empirical data show us that the wind currents arising at the crossing “am Tabor” to “Buno – Marek – Allee” are critical to the whole district. i.e.: small children about 12 kg can be thrown from bikes in winter season.
The local bias – strong wind convection from the Danube east is not taken into consideration (weather file from airport Vienna Schwechat).
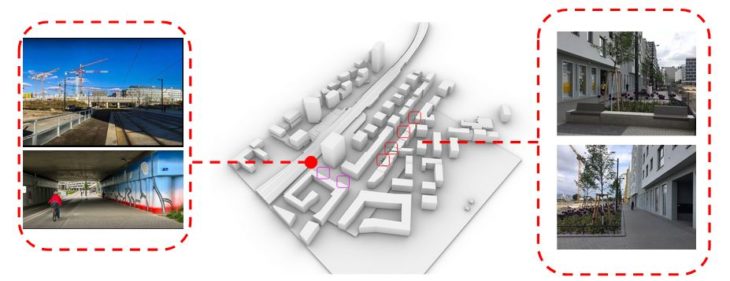
Image 34: Simulation parameter
- main wind direction 300°,
- EPW weather file from LB,
- tree clusters implemented (abstracted as cubes 8 x 5 x 5 m)
- additional tree clusters in highest wind current areas
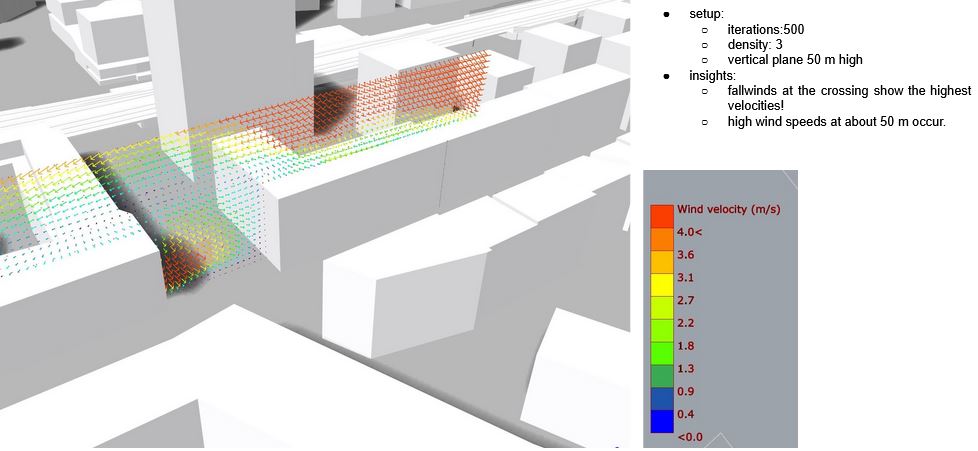
Image 35: Single direction, velocity
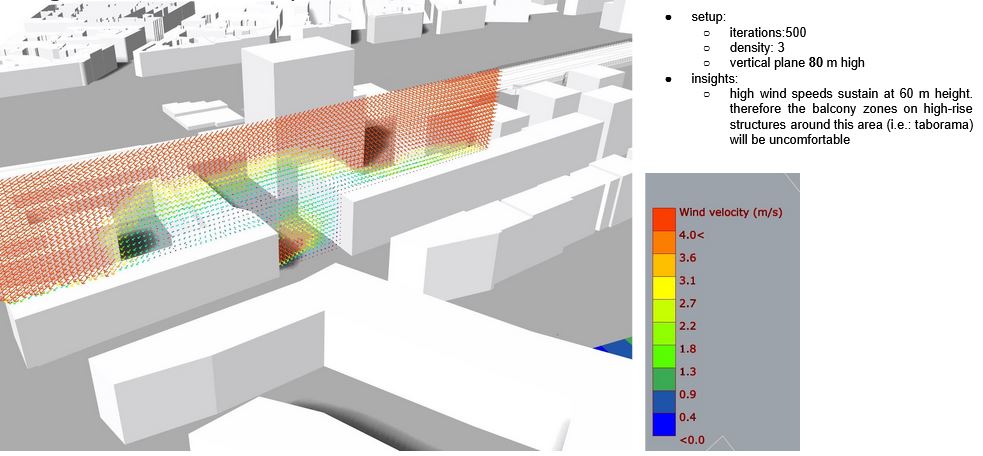
Image 36: Simple wind study – single direction, velocity
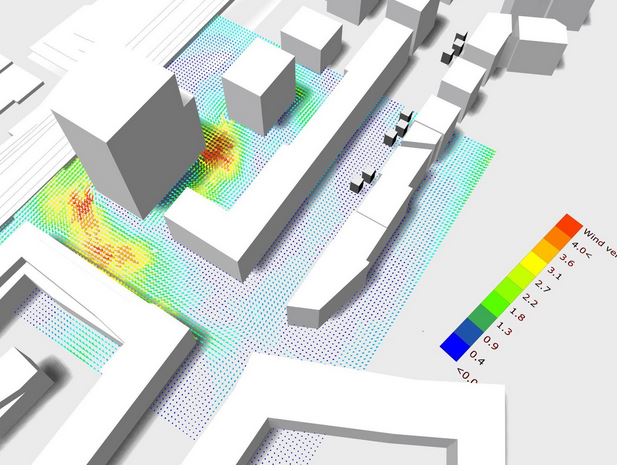
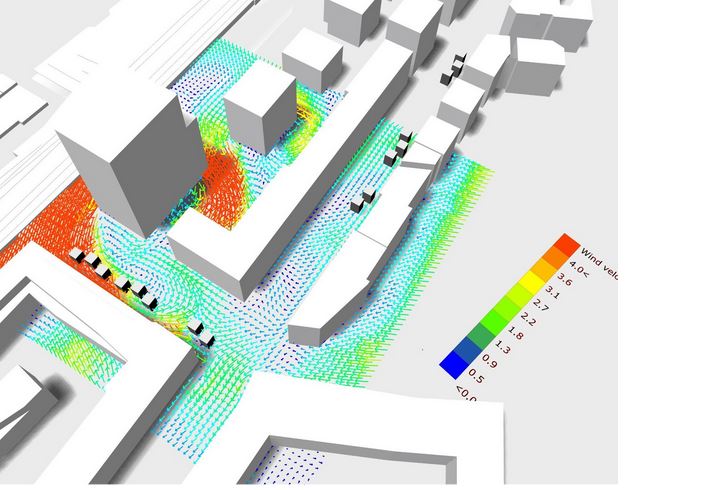
Image 37: Simple wind study – single direction, velocity without (above) and with trees (down)
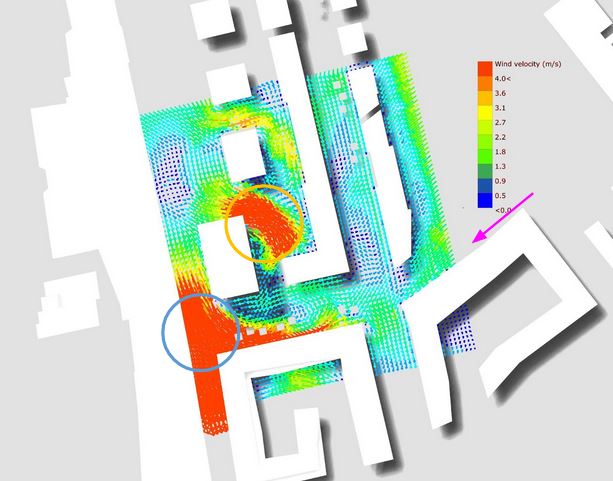
Image 38: Simple wind study – single direction, velocity – most affected areas
- insights:
- horizontal plane – at 2m!
- the current from NW is way more intense than expected.
- our corner building + the connected high-rise are creating a critical area there. therefore the filter in front of the building must be tremendously increased – i.e.: trees + filter grid in front of the building.
- we hadn’t expected the local bias from the close Danube river not to be represented in the file, but it shows up!
- the steam in our crossing is intensified through the Venturi effects – tunnel, main wind direction, urban Masterplan, missing tree scale!
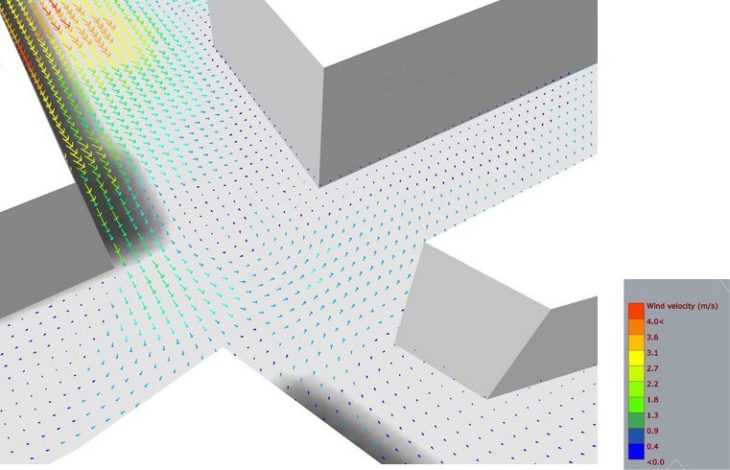
Image 39: Simple wind study – single direction, velocity – close up
- closeup:
- Bruno Marek Allee + am Tabor
- insights:
- there is a wind turbulence occurring in exactly this area of the crossing!
- increasing the scale enabled to understand this better – see next image.
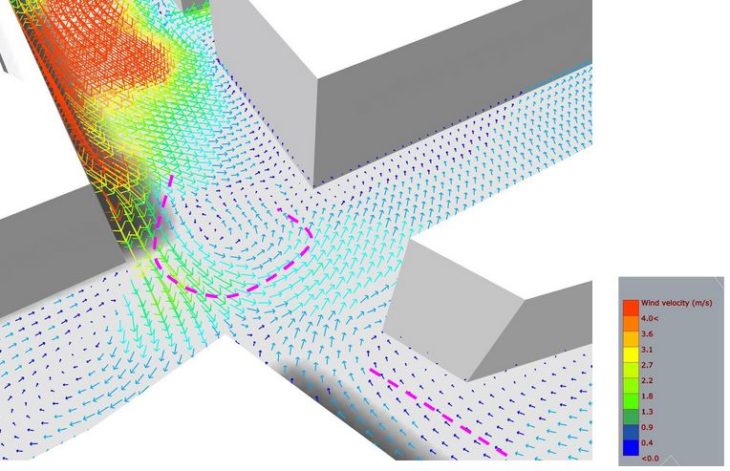
Image 40: Simple wind study – single direction, velocity – increase of scale
- closeup & increase of scale:
- Bruno Marek Allee + am Tabor
- insights:
- the wind analysis shows that the strongest turbulence comes from am tabor – west!
- interestingly the local bias – Danube river shows up – east stream!
- creates a strong turbulence at the bank Austria campus
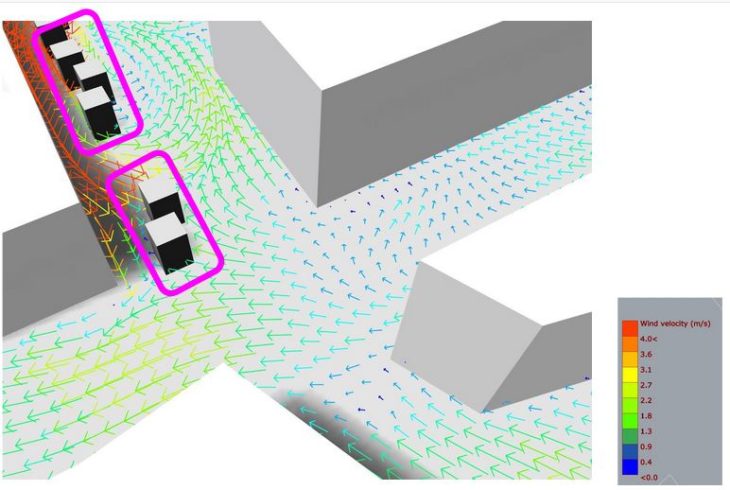
Image 41: Simple wind study – single direction, velocity – addition of trees
- closeup:
- Bruno Marek Allee + am Tabor
-
- intervention:
- placing additional trees along the “am Tabor” street – west
-
- insights:
- major insight was that the implementation of the trees
- dense
- 5 x 8 – in 2 m height
- major insight was that the implementation of the trees
- insights:
- take away the peak winds in this area!!!
-
- therefore we would further investigate these measures and propose it to the quarter management!
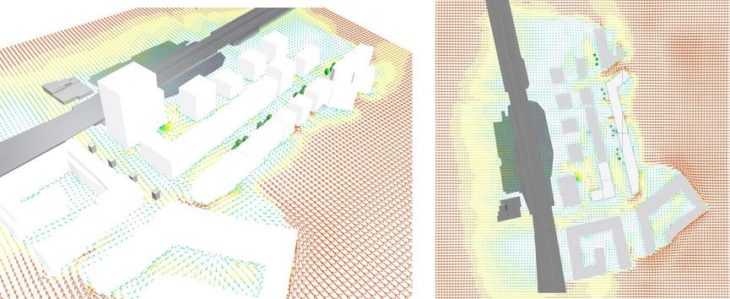
Image 42: Annual winds
Main wind direction 300° W/N
Reference velocity 5 m/s (refer to windrose p14)
4 wind directions simulated (0,90,180,270)
Probing resolution 5 m (due to bad results before, we have tried to reduce the resolution, so the simulation results will be visualized faster)
Maximal velocity 6 m/s
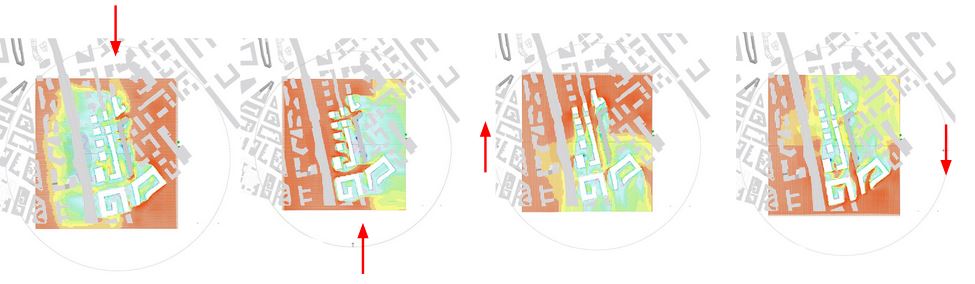
Image 43: Annual winds
Main wind direction 300° W/N
Reference velocity 5 m/s (refer to windrose p14)
4 wind directions simulated (0,90,180,270)
Probing resolution 5 m (due to bad results before, we have tried to reduce the resolution, so the simulation results will be visualized faster)
Maximal velocity 6 m/s , wind directions
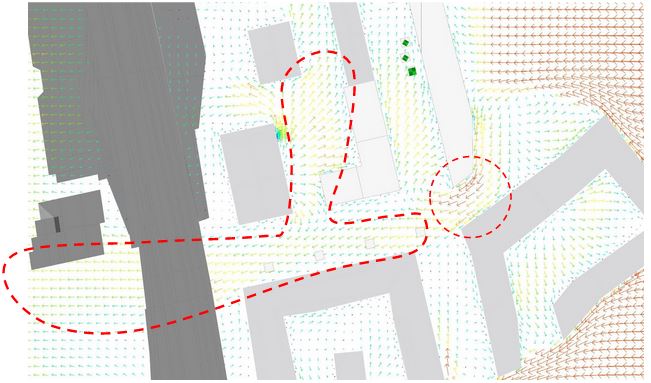
Image 44: annual winds – closeup – crossing Bruno-Marek-Alle / Taborstraße
- insights:
-
- although the train truss is not plugged in the model, the venturi effect in this area is already very obvious.
- as experienced empirically – the corner / venturi effect the crossing is crucial for the inhabitants.
- the lack of environmental investigations during the urban planning phase (that has been executed 20 years ago ) render a picture of the need of this kind of expertise in the field!
- the results of the study are so promising, that i (clemens) will take them further to my office to learn from it + the urban planning of Vienna and confront them with it.
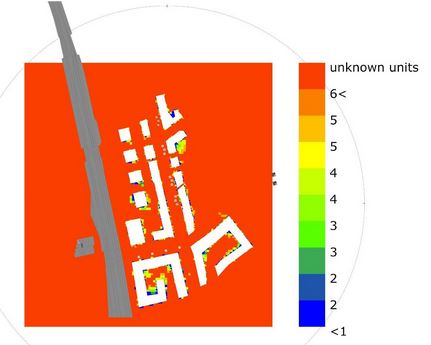
Image 45: Annual winds – davenport-wind comfort-map
- insights:
-
- the annual Davenport-wind-comfort-map (if correctly displayed and interpreted) points out that the area is highly vulnerable to wind exposure.
- due to the fact, that we just plugged in a small amount of geometry for sure changes the results, but actually the comfort doesn’t seem to increase.
- now that the urban planning + buildings are step by step in the building process already, it would be highly recommendable to increase local measures alongside the Bruno Marek Alle + Taborstraße. such as:
- wind catcher installations
- trees
- geometry that disrupts the venturi effect and therefore the wind velocity in the quarter.
Image 46a: Wind-speed map for each HOY, change daily values, 9 hours
Image 46b: Wind-speed map for each HOY, change monthly values, 9 hours
Main wind direction 300° W/N
Reference velocity 5 m/s (refer to windrose p14)
4 wind directions simulated (0,90,180,270)
Probing resolution 5 m (due to bad results before, we have tried to reduce the resolution, so the simulation results will be visualized faster)
- insights:
- both maps point out the divers character of the local climate.
- changing the months on the same day seems to give more consistent results.
- the diversity of the climate, high humidity and partially higher wind velocities create a comfortable climate in general, but at the peek of each of these values the comfort rates are not really acceptable.
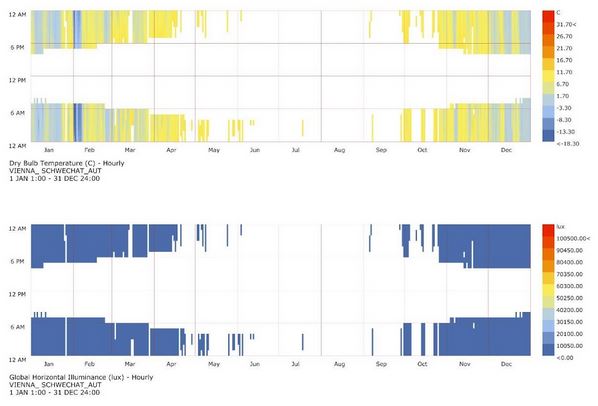
Image 47: Average wind velocity maps for selected periods or hours of year
06| Thermal Comfort
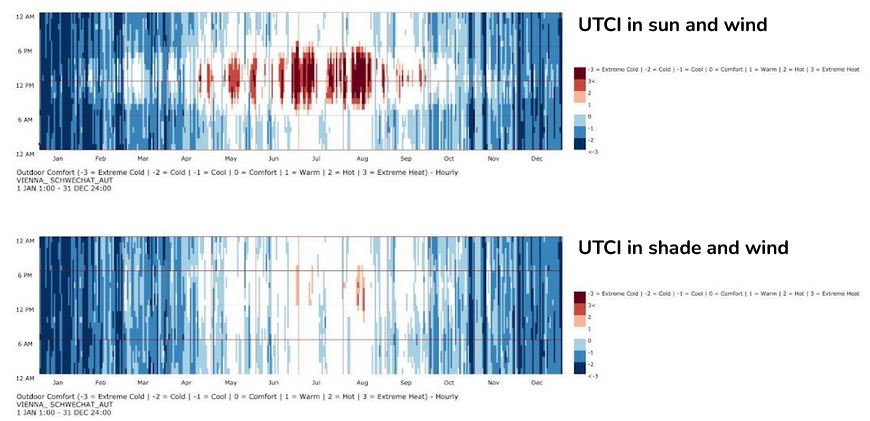
Image 48: Hourly thermal comfort perception for sun / shade
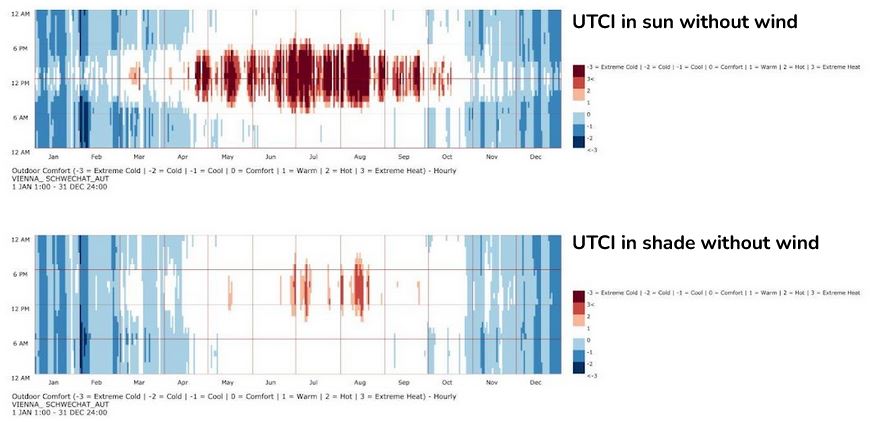
Image 49: Hourly thermal comfort perception for wind / no wind
From the previous diagrams (Image 48 and 49) of outdoor comfort we can understand that from End of April till the middle of September, it feels hot or extremely hot in the midday hours, when taking into account the sun and the wind parameter. In the winter months the thermal comfort is achieved in the midday hours, while earlier in the day or later in the afternoon it feels cold to extreme cold.
On the other hand, when observing the second diagram we understand, that in shade and with wind in the summer months it is achieved the thermal comfort during almost the whole day, while in the midday hours it feels a little warm and quite hot in August. The thermal comfort in the winter months is similar to the previous diagram. However the thermal comfort, that was achieved under sun in midday hours is not achieved anymore.
From the third diagram we can see that in sun without wind the warm months (April to October) feel even more warm / hot, while the winter months feel less cold.
In the fourth diagram we can observe that in shade without wind the hot months achieve the thermal comfort in the whole day, while in midday hours it feels warm and hot only from 12:00 to 18:00. The cold months have very similar results with the previous diagram, although the thermal comfort is achieved a bit less than before.

Image 50: Hourly thermal UTCI for sun / shade
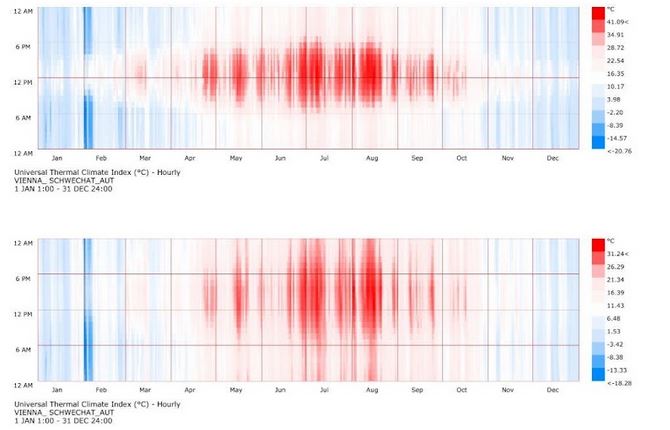
Image 51: Hourly thermal UTCI for wind / no wind
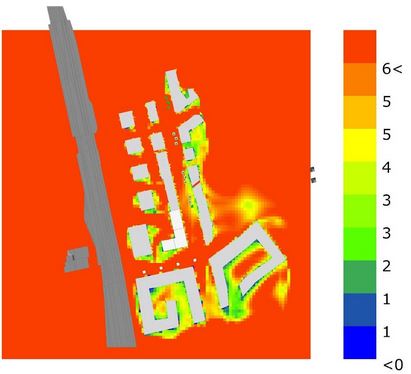
Image 52: Simple thermal comfort map
assumptions + insights on the simple thermal comfort map:
- due to the small amount of geometry (such as buildings + trees) within our investigation field, the results might be a little less good and therefore are not unbiased.
- however, what this map points out is that the overall thermal comfort especially in Bruno Marek Allee + Taborstraße is not performing well.
- there are a lot of aspects that work negatively especially on this area.
- small trees,
- venturi effects alongside the Allee + Taborstraße
- although west sun is shaded well, the thermal mass of the street (which is not represented in this research) makes the area very uncomfortable in summer, due to the intense heat in take during the day.
– the empirical data mentioned above, are more or less proven in the model, without taking a lot of aspects in the model.

Image 53: UTCI comfort map – 2nd of August
assumptions + insights on the UTCI comfort map:
- as the UCTI map takes more values (such as humidity) into consideration the overall picture is not as bad as in the wind study assumptions.
- as stated in image 46:
the diversity of the local climate, high humidity and partially higher wind velocities create a comfortable climate in general, but at the peek of each of these values the comfort rates are not really acceptable.
furthermore, the urban plannings have taken the environmental aspects into consideration whilst planning, therefore some aspects such as main roads, size, shading etc. have been executed by functional + aesthetic reasons only, which has increased some values on the local climate. which impacts the local micro comfort tremendously in extreme seasons.
Image 54: UTCI comfort map – 2nd of august
What we can see from the gif. above is, that the thermal comfort decreases from 12 – almost 24. This means that there is no thermal stress included, but actually not taking into consideration the local conditions such as thermal massing of the street and the surrounding surfaces.
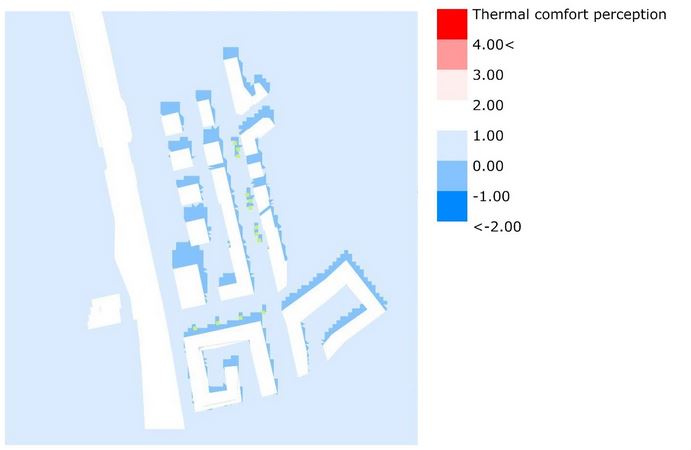
Image 55: Thermal comfort perception
07| Wind and Sun Analysis with InFraReD
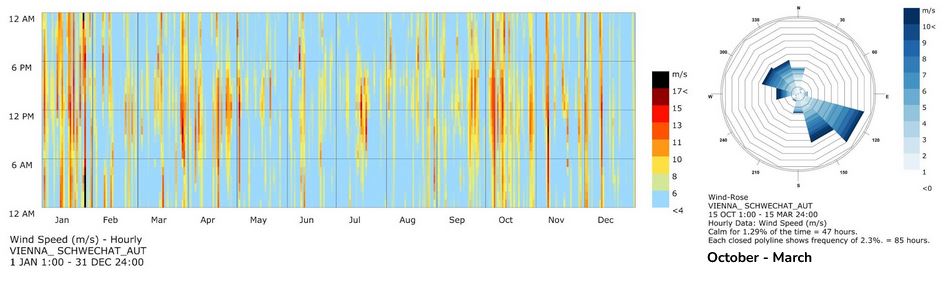
Image 56: Wind Speed and Wind-Rose from Environmental Analysis with Ladybug
According to the weed speed diagram we understand that the strongest winds occur in January and they reach approximately 17m/s. From the wind roses we can understand, that for this period the strongest winds have southeast direction and 120°.
So these are the values that we give for the wind-speed analysis in InFraReD.
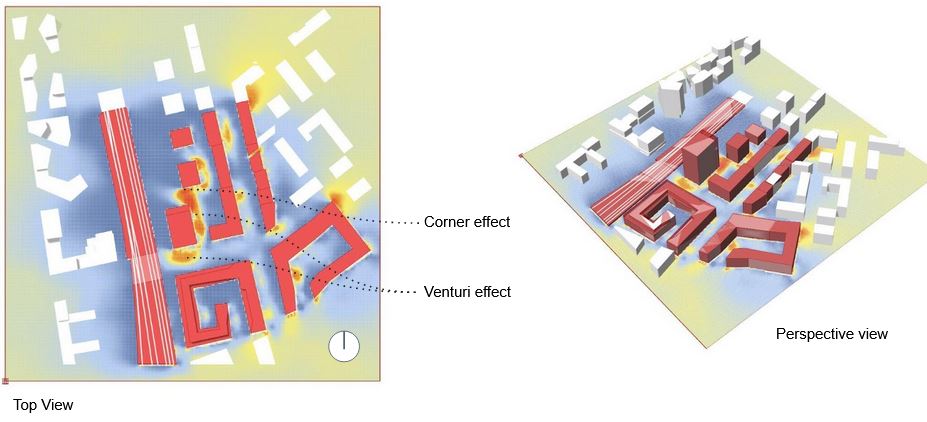
Image 57: InFraReD wind-speed. Initial study
From the analysis we can understand that it occurs a venturi effect between the high rise and our building. A solution would be to increase the length of our building and connected it with the facade of the site building.
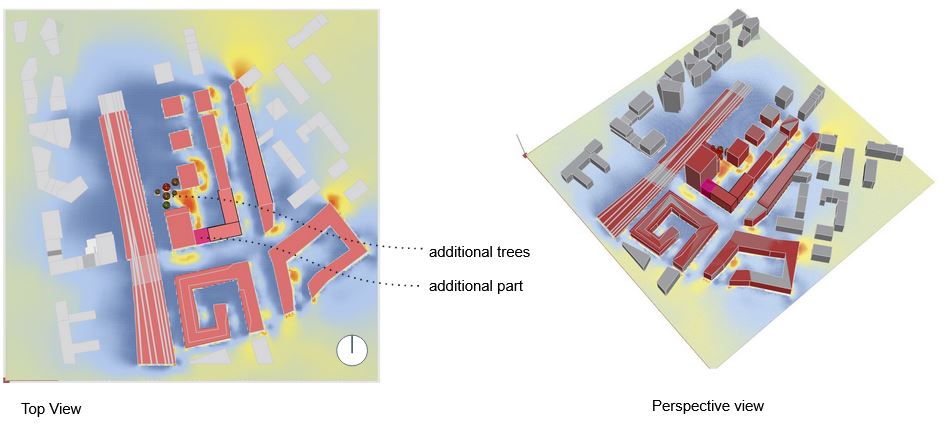
Image 58: InFraReD wind-speed. Improved study
We can see that the venturi effect due to the addition of the building part decreased.
However in the area that we added some trees we cannot see that the wind speed decreased, despite our expected and desired result. That has probably to do with the wind direction (the strongest wind occurs from south-east).

Image 59: InFraReD wind-comfort
Regarding wind comfort we see from the analysis that our building has satisfactory results, since the red / orange areas are not directly in our site.
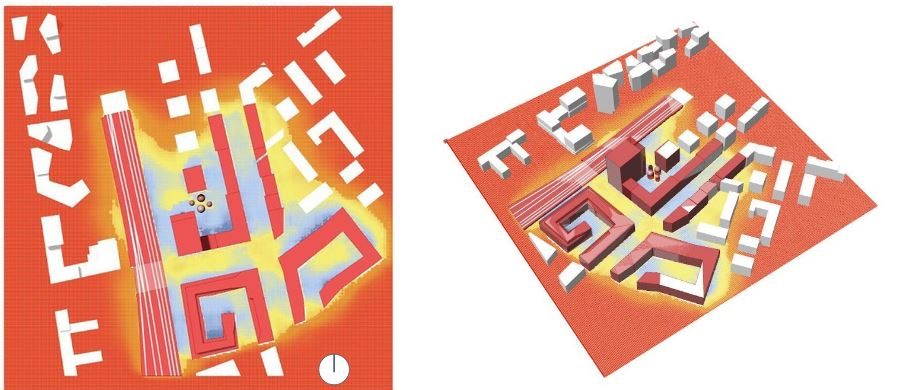
Image 60: InFraReD sunlight – hours
Regarding sunlight hours we can see that see that our main facades (south and east) are receiving sufficient sunlight. However the court yard is in shadow, which could be improved if we raise it up.
08| Comparison of Software & Conclusion
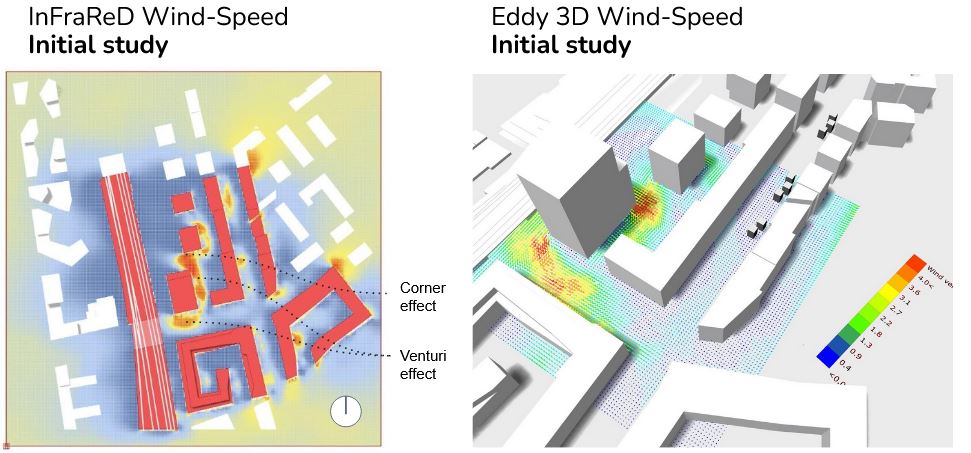
Image 61: Comparison of Wind-Speed results with InFraReD and Eddy 3D
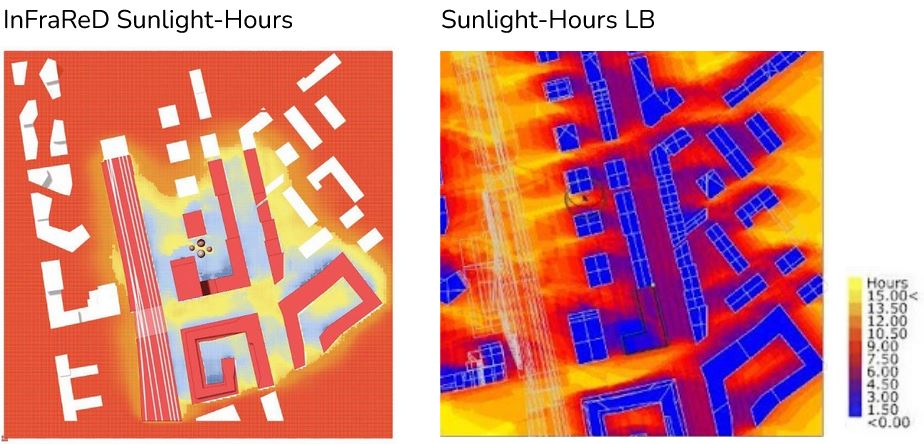
Image 62: Comparison of Sunlight-Hours results with InFraReD and Ladybug
To sum up, as we can see from the comparison of the results above (Image 61 and 62) results generated using InFraReD and Eddy 3D or Ladybug are very close to each other. By taking into consideration that InFraReD gave us very quick results, makes it a tool that we will be using in the future when we want to get quick and accurate results.
However, when we want to go into further details (for example addition of trees or the rise of a shaded courtyard in order to get more sunlight) we will be using other software as Eddy 3D or Ladybug.
THANK YOU!
THE KRAKAUERSTREET VIENNA is a project of IAAC, Institute for Advanced Architecture of Catalonia developed at Master in Advanced Computation for Architecture and Design (MaCAD) in 2021-2022 by students Maria Papadimitraki and Clemens Russ and faculty Angelos Chronis and Aristotelis Vartholomaios.