Context
In the city of Barcelona, the city council extracts different urban typologies as shown on the map below, as basis for management decisions and planning for different sectors, in particular for waste management. They map different characteristics of the built environment such as the width of the street, the grid, and the number of households and portals along the roads, along with other parameters. With this method they have extracted 16 different urban typologies. However, a new layer of typology is needed, that is more specific at the block or even the building level, to assess the built environment.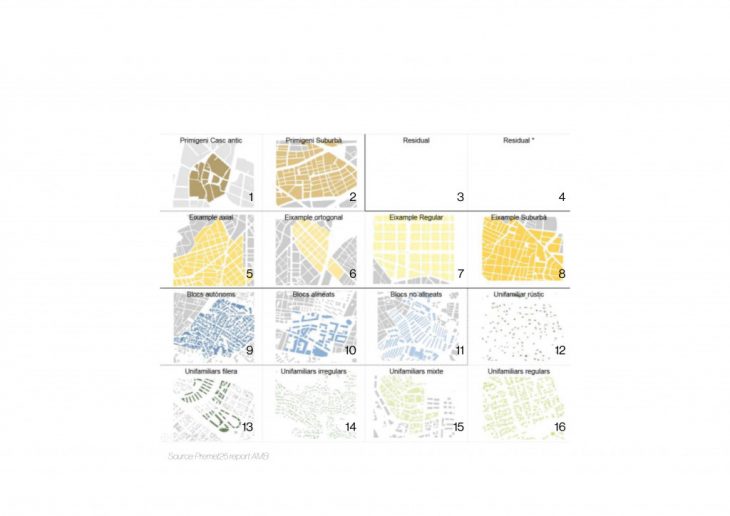
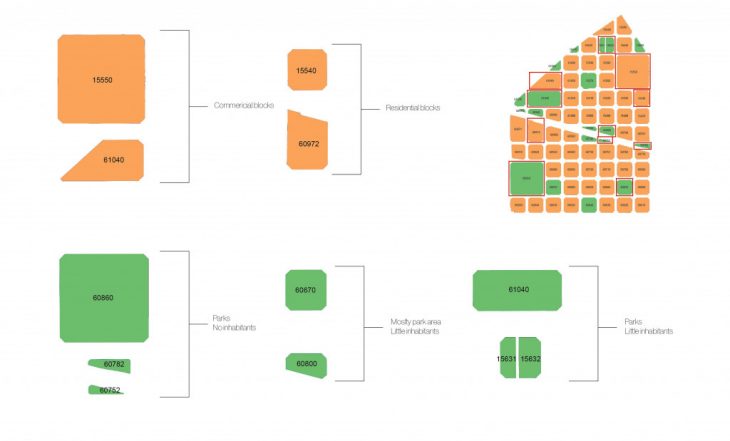
Previously, a manual process was executed to extract different block typologies using the spacial parameters of a neighborhood. The parameters consist of the roof surfaces, the built area, ground floor and garden surfaces and the underground surfaces. These spaces are then optimized through a filtration process to identify three different typologies.
The use of AI-driven technologies can be used as exploratory exercises to assess unknown results in this project. The results could then determine if we could use the obtained typologies as new urban typologies or not.
Research question
Can machine learning algorithms help in extracting new typologies in the neighborhood?
Dataset
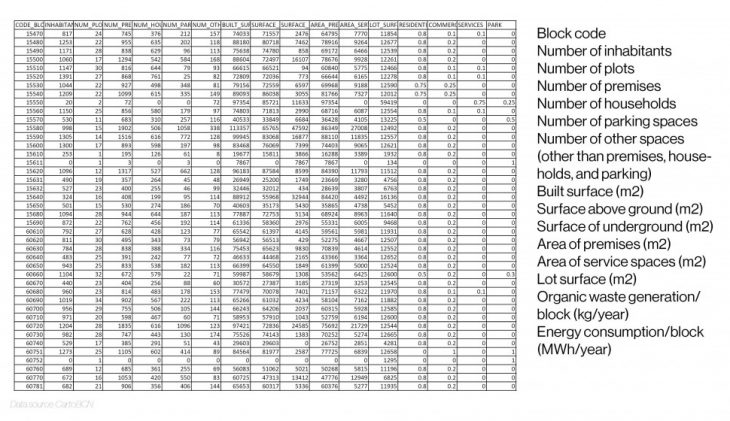
One of the downsides of this exercise is the amount of data used. It is a real dataset of the blocks of La Nova Esquerra de l’Eixample neighborhood in Barcelona that contains only 74 rows for the 74 blocks.
This data contains the following information:
Algorithms: k-means clustering
To choose the right machine learning algorithm, we need to ask ourselves first if we are predicting a category? In this case it is yes because we want to extract new typologies.
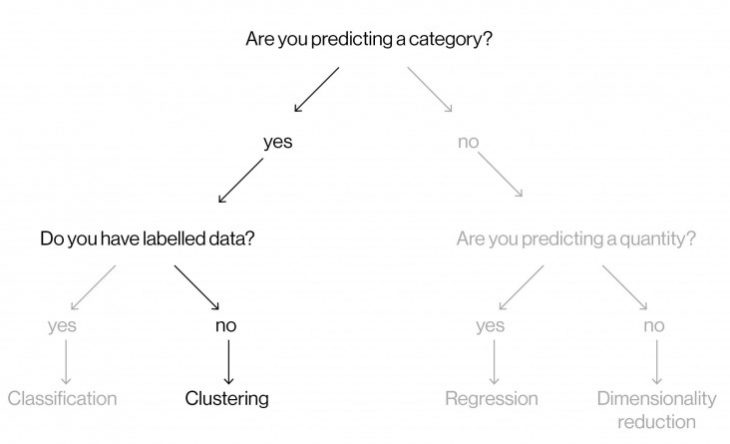
Do you have labelled data? In other words, do we have the answers or does our data have the category that each data point should fall into. In this case it is no, which leaves us with clustering.
This exercise will use k-means Clustering which is a method of unsupervised learning. A cluster refers to a collection of data points aggregated together because of certain similarities, defined by a centroid point k.
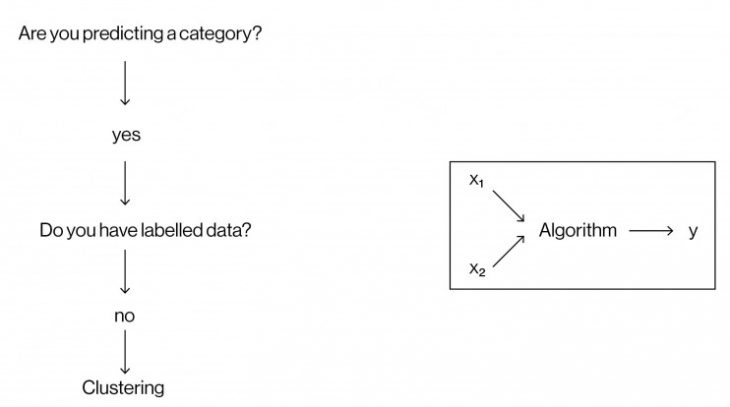
x1 and x2 in this diagrams are the datasets and y is the category that is going to be extracted.
Evaluation
We start clustering different sets of parameters into 2, 3, 4 and 5 clusters. The use of 3-dimensional graphs is sometimes hard to analyse, but has helped in deciding what sets of parameters can be used in this exercise. The parameters are: number of inhabitants, built surface (m2), surface above ground (m2), surface of underground (m2), with the subject column being the block code (highlighted in red).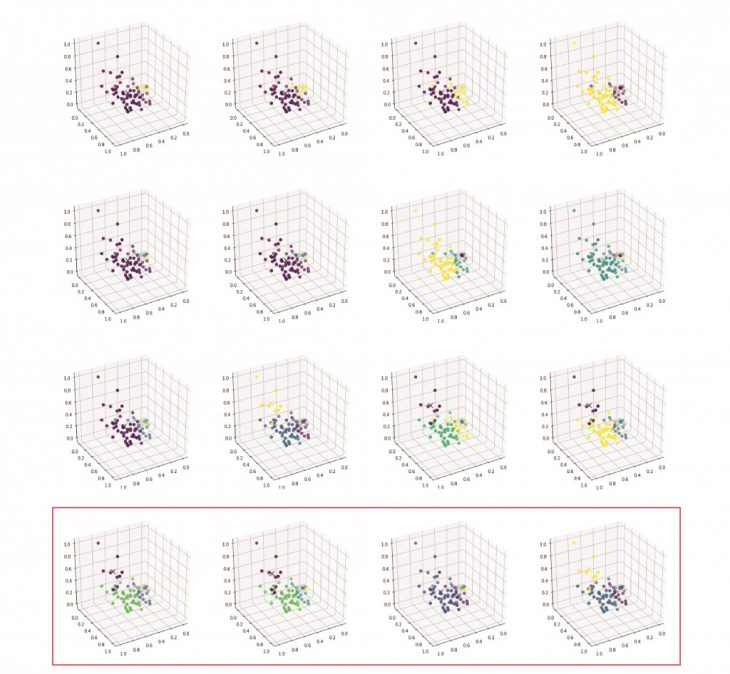
For better visualization, biplots are exported. This graph uses PCA (Principle Component Analysis) that reduces the dimensions which enables us to visualize 4 or more dimensions of data in 2 dimensions.
Cluster k=2
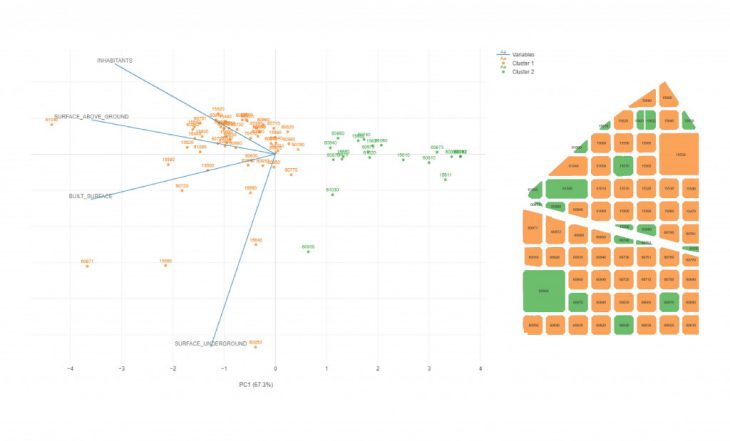
The first obvious observation in these clusters is that the green blocks are the ones that have the highest amount of green spaces and open spaces. The orange ones have more dense built areas. So we can deduce that the ground floor surface here is the what the algorithm used to group the blocks.
Cluster k=3
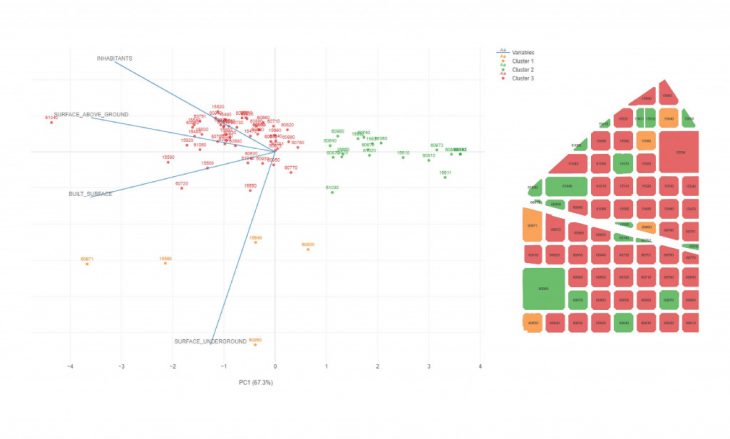
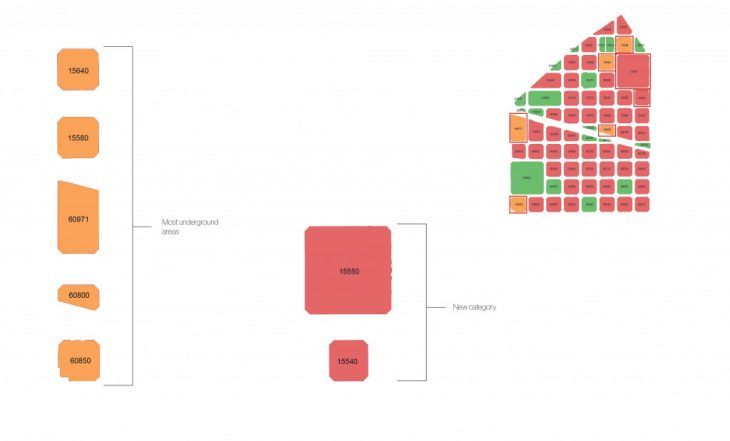
Similarly to k=3 clusters, we notice that the previously seen orange cluster is subdivided into 2 clusters now, red and orange. The first observation is that the orange blocks have a the highest amount of underground spaces. So the underground surface is the variable that the algorithm used to distinguish from the red blocks.
Cluster k=4
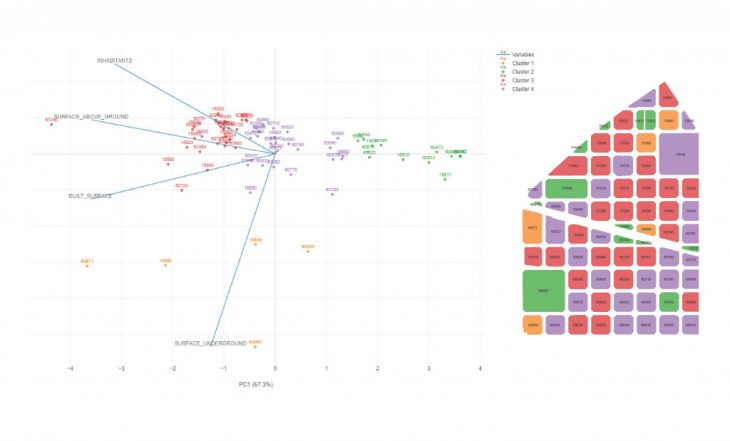
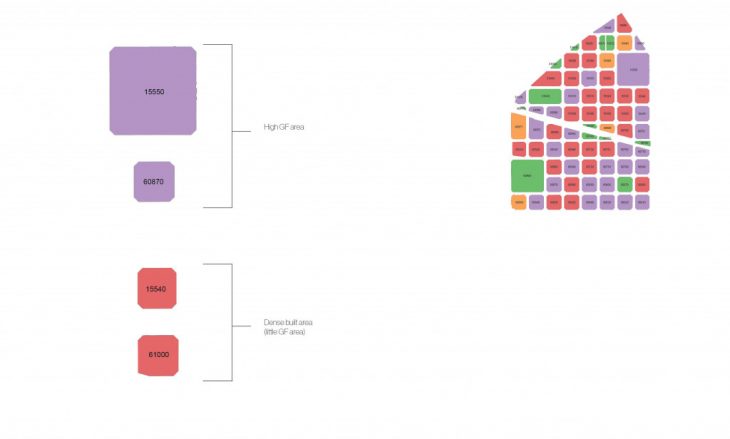
For k=4 clusters, the red blocks are subdivided into 2 clusters: red and purple. Visually we can again understand the difference between the red and purple are the area of the ground floor area. The purple cluster has a higher open ground floor area than the red cluster.
To verify this information, we observe the clusters on a boxplots.
As the observations were correct, the ground floor area is higher in cluster 4. We can observe another factor of comparison and it is the number of inhabitants. To analyse the whole chart, we can see that the first cluster is quite obviously different from the other three, most notably characterized by it spacious underground areas marked in red. The second cluster shows us a unique group of plots. The plots within this cluster have the lowest built surface, inhabitants, and surfaces both above and below ground. And because the underground surface for this cluster is arguably quite similar to the third and fourth cluster, we’re able to conclude that the algorithm is able to create more nuanced groups without really needing to look at the underground surface. Rather, it is the combination of the other three variables that determine a plots cluster.
Conclusion
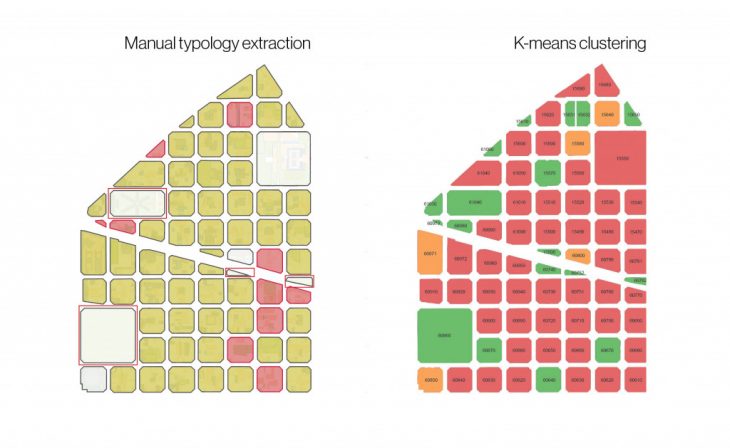
When the manual and the machine learning results are placed side by side, we can see similar patterns in the clusters which allows us to validate the process that the algorithm went through to give these results. But because we have applied a filtering process prior to extracting typologies in the manual process, some of the blocks do not fall in the clustering group from the machine learning.
But we do see similar patterns when we compare the manual process with the results of 4 clusters.
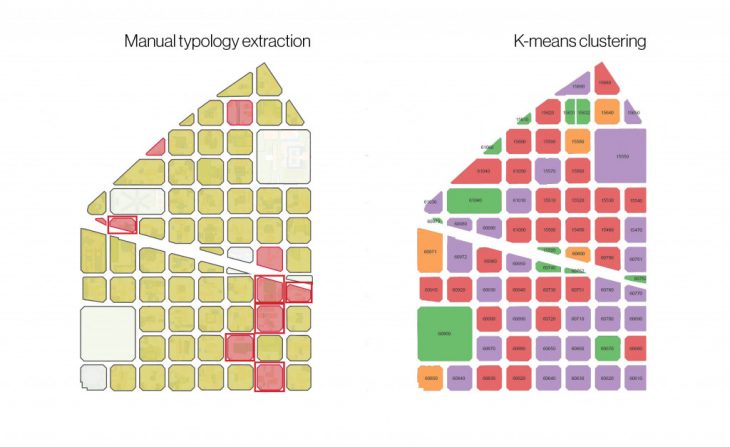
With the initial goal being to find new typologies through a machine learning way, what we see here is that there is nothing new that the machine learning has given us, which validates the manual approach. However, because this method is automated, we can now scale it up and apply this for the rest of the neighborhoods in Barcelona, and we no longer require a manual classification process.
As a general conclusion, we can say that the fact that we tried to imitate the human perception operation, it is actually perfectly applicable to use this method in larger scale. And this is exactly what machine learning is for, it manages to imitate intelligence. And this intelligence give us the opportunity to automate and scale the process.
K-means clustering for urban typologies is a project of IaaC, Institute for Advanced Architecture of Catalonia developed at Master in City & Technology in (2018/2020) by:
Student: Sarine Bekarian
Faculties: Angelos Chronis, Nariddh Khean, Serjoscha During