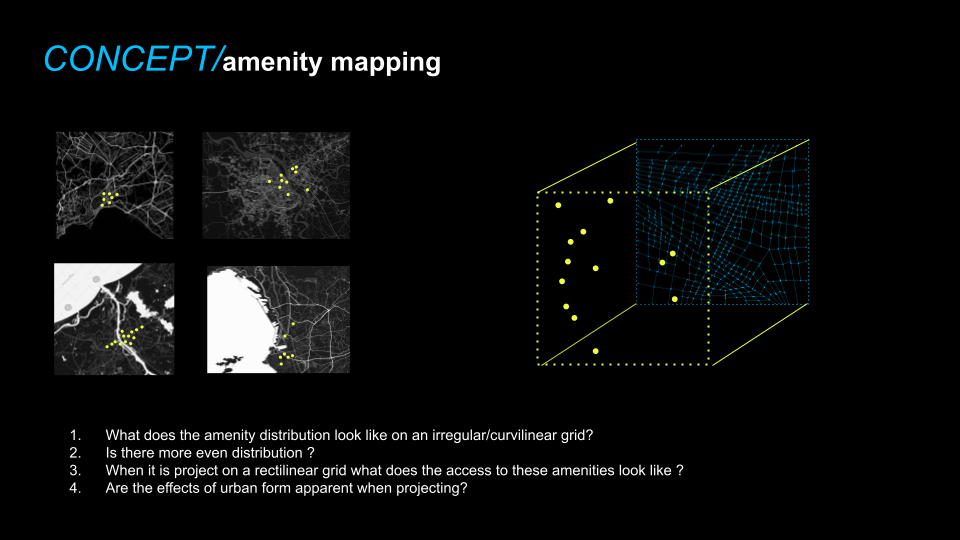
For this project we wanted to study the relationship between urban form and amenity distribution by extracting data from cities that feature curvilinear, irregular or concentric urban networks and project that amenity data onto a regular and rational grid.
We focused on amenities because their frequency and access if central to the qualitative aspects of urban dwelling
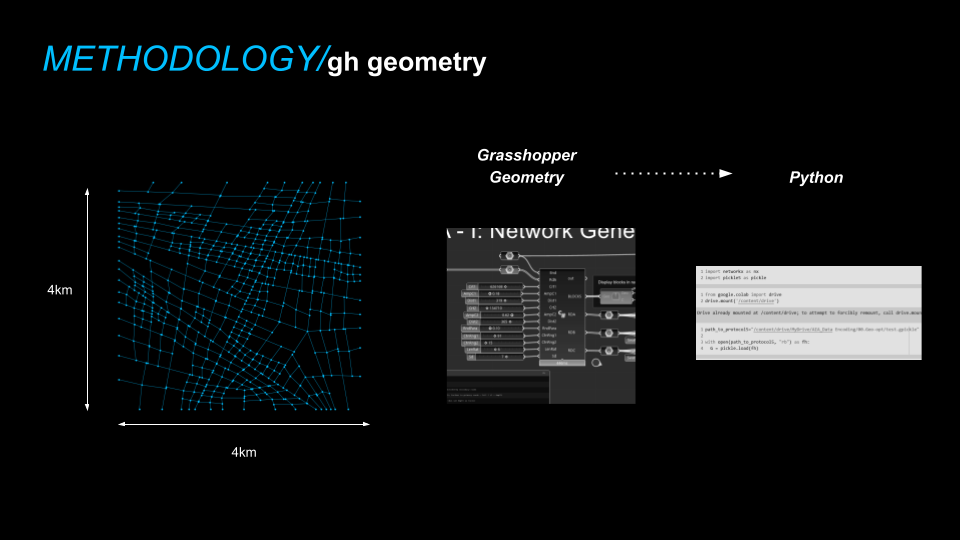
The rectilinear graph of our fake city was generated with Parametric City Generator Script which allowed us to play around with hierarchical divisions of the grid and therefore generate a more variable street segmentation that has a more realistic representation of a real city.
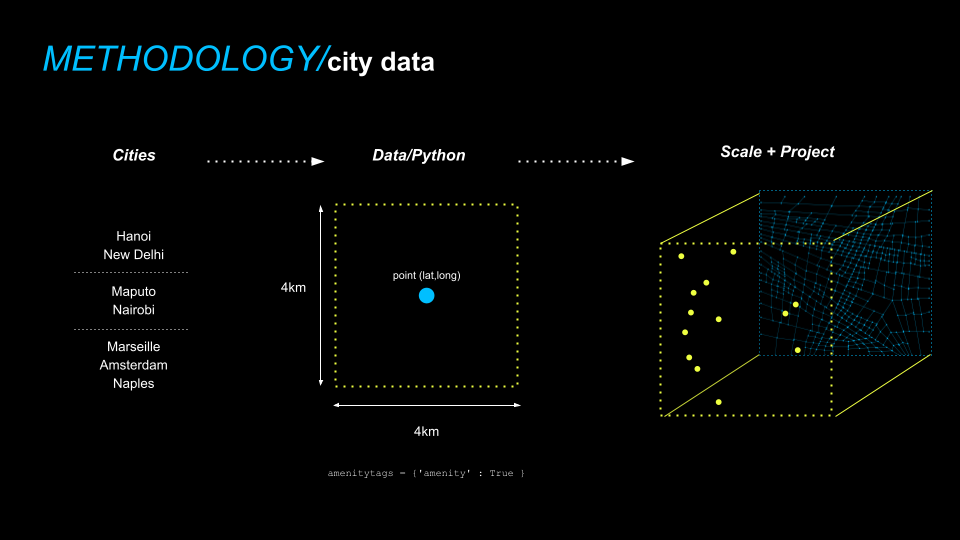
The boundaries of the grid were set to 4 by 4 km to align with the radius of the data extracted from real cities in Open Street Map.
The generated grid was then imported into Python by using Hops component to extract the points and curves of the grid and combing them back into a graph
For the case study we chose 7 cities with more curvilinear and irregular grids from Asia, Africa and Europe to extract the amenities data from. The data was extracted through Open Street Maps and the radius was set to 2km to match with our generated fake city grid. The data was cleaned to contain only point geometries whereas all the polygons were extracted from the dataframe.
As a next step we remapped our extracted city data onto the min and max boundaries of our generated fake city grid to allow correct mapping into the 4 by 4 km boundary box.
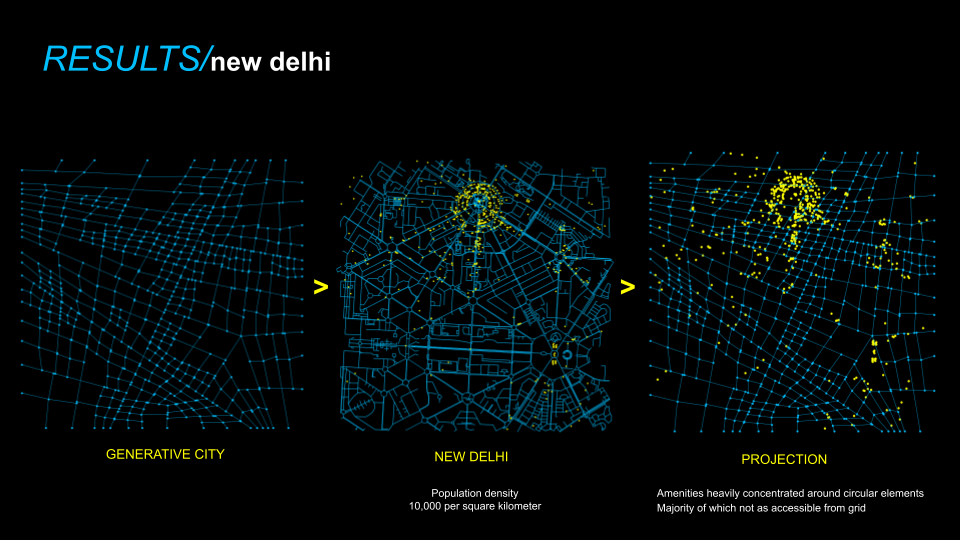
With the projected New Delhi graph we can see that the amenities are heavily concentrated into one specific part in the city, around circular elements with majority of which are not as accessible from the regular grid.
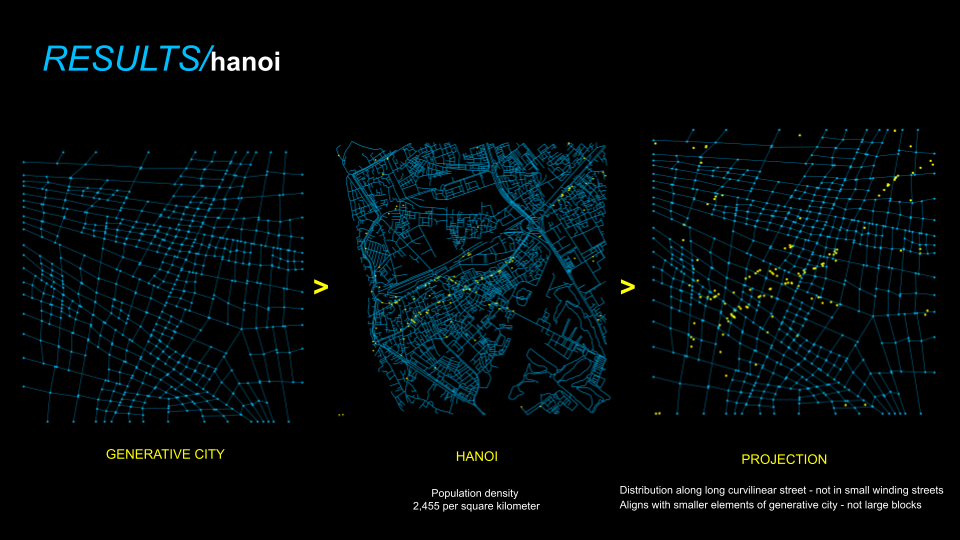
In Hanoi’s case the amenities distribution is arranged mainly along the main curvilinear street and less in small side streets, aligning quite well with smaller elements of generative city.
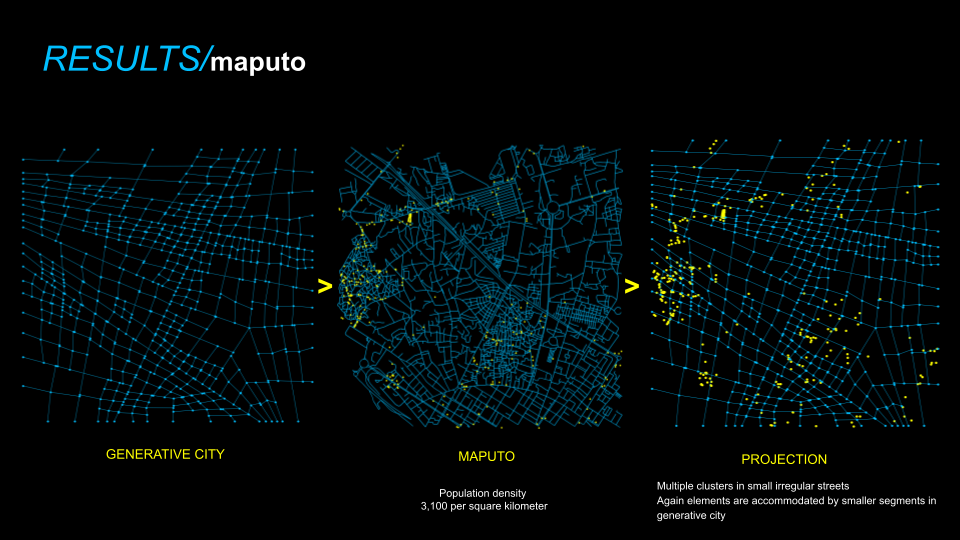
Maputo’s morphology is structured from many smaller segments containing multiple clusters of irregular streets fitting fairly well with smaller blocks of generative city.
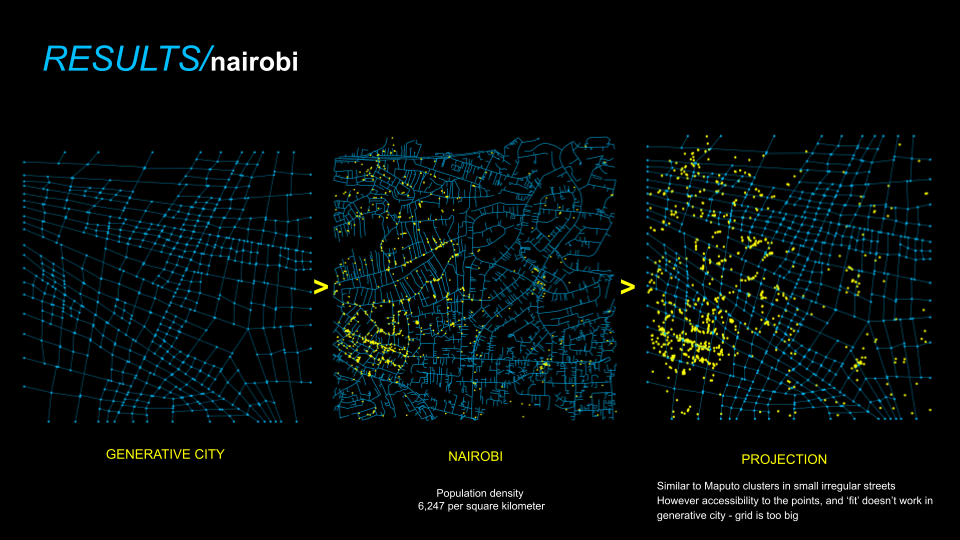
Nairobi’s projection is similar to Maputo with many clusters of small irregular streets, however accessibility to the points, and ‘fit’ doesn’t work that well in generative city due to larger size of the grid.
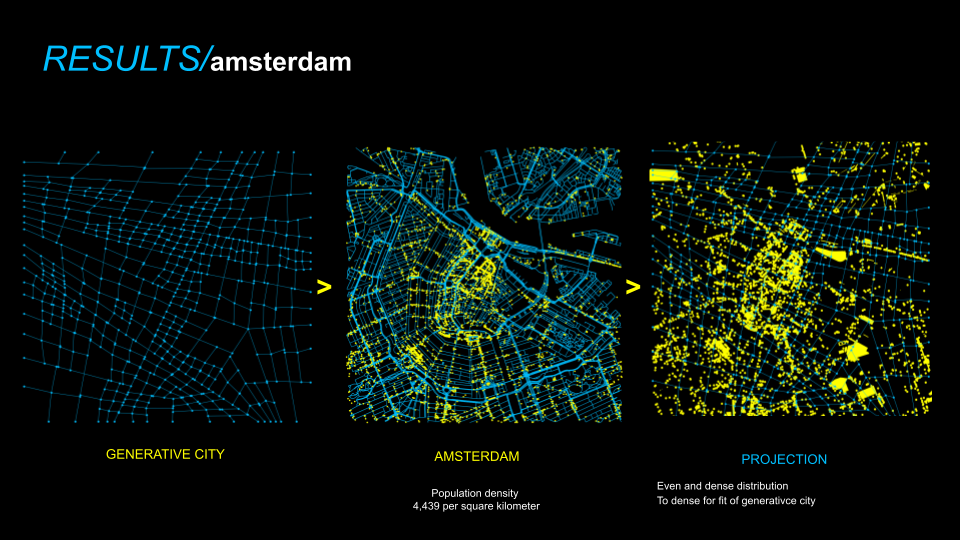
Amsterdam shows even and dense distribution to dense for fit of generative city
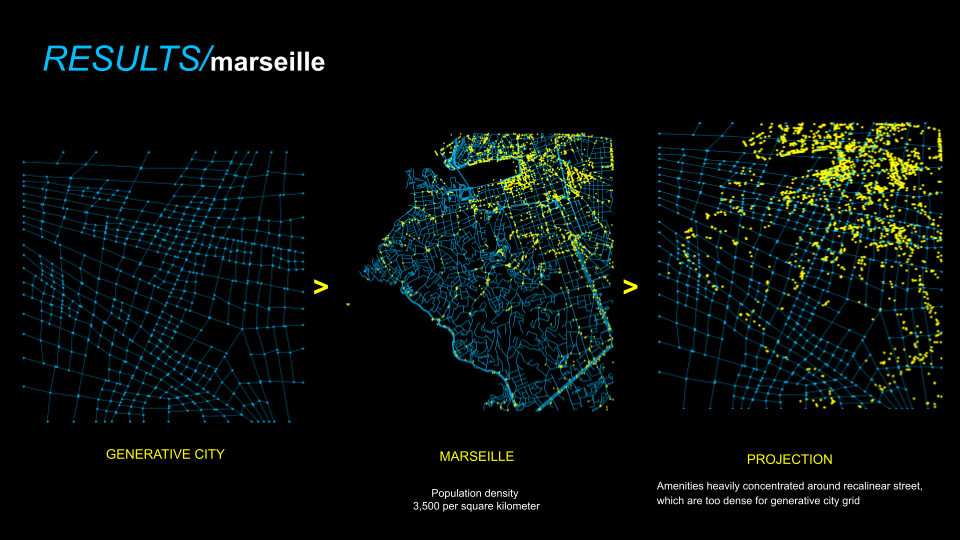
In Marseille the amenities heavily concentrated around rectilinear street, which are too dense for generative city grid
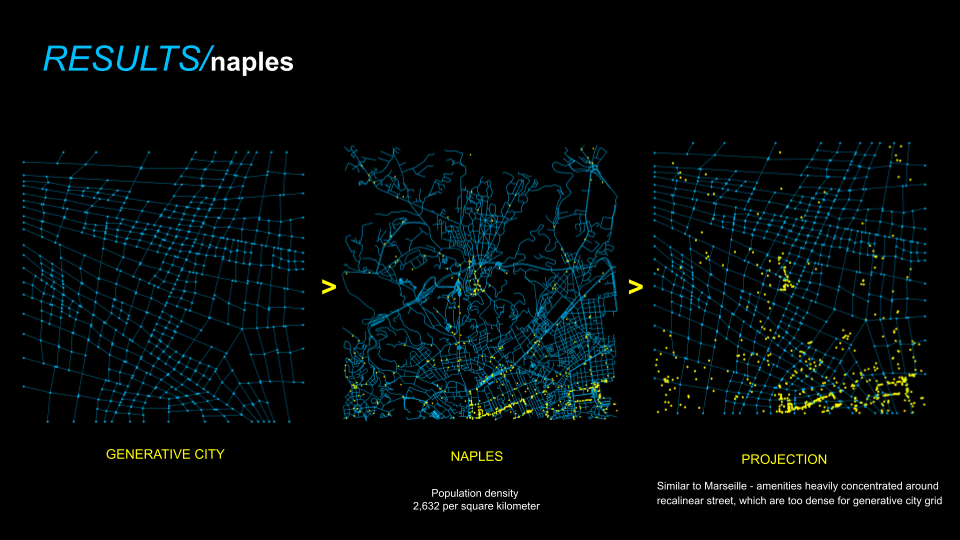
For Naples, similar to Marseille, amenities heavily concentrated around recalinear street, which are too dense for generative city grid
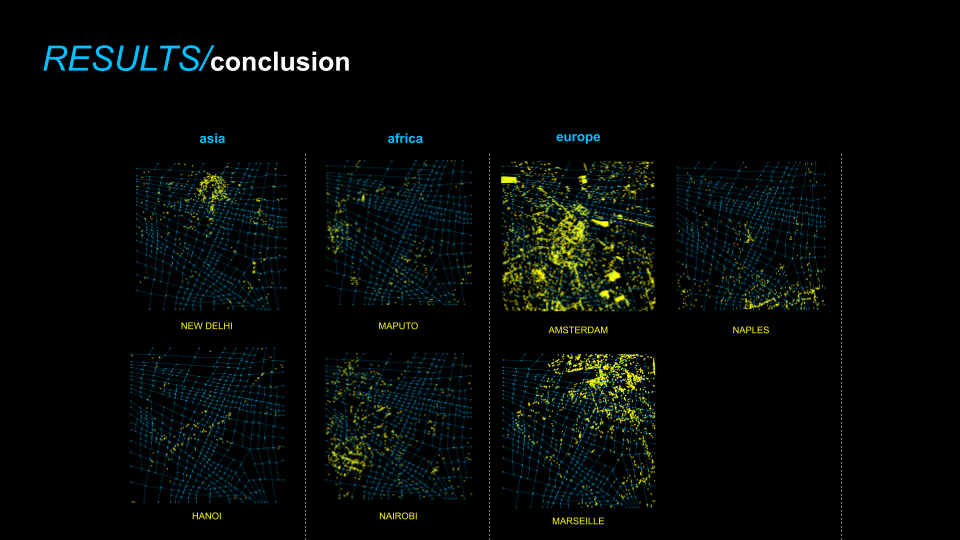
While this is a really small dataset, just based on visual observations we can some trends or similarities beginning to emerge based on the content
With the asian cities there are fewer recorded amenities per sq.m and are located centrally clustered in more irregular and concentric locations.
African cities feature small clustered concentrations of amenities along, again, small irregular and curvilinear streets
European cities – generally have a higher concentration of recorded amenities that are heavily concentrated around rectilinear streets and disperse around curvilinear
As for the fit – In general, the gridded city can accommodate dispersed amenities, but as the clustering increases the urban form does not accommodate the amenity distribution
This was obviously and very general study.
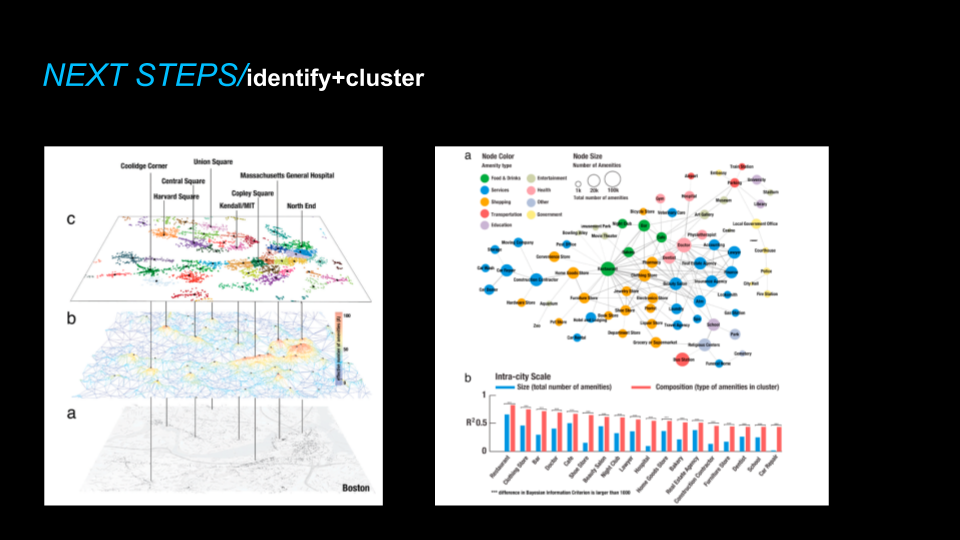
This analysis would benefit from an increased understanding of demographics and infrastructure and perhaps identifying amenity types to analyze collocations.
IRREGULAR amenities City is a project of IAAC, Institute for Advanced Architecture of Catalonia developed at the Masters in Advanced Computation for Architecture and Design in 2022 by Hanna Lak and Zoe Lewis, and Faculty: David Leon, Dai Kandil