Introduction
Public Open Spaces are an essential part of cities. It’s fundamental to measure its quality to be able to understand and design them. For this project, we choose social interaction as a way to measure the quality of public open spaces, because it has a relationship with the spatial form of the city, and ultimately derives patterns of behavior. Another useful understanding is how cities take part in the production of actions, or how the spatial form influences social interaction.
Social Interaction in the context can be defined as “collections of agents interacting in space-time within geographic boundaries”. We try to measure social interaction by computer vision, which employs machine learning to interpret, understand, and derive visual patterns. A more quantitative form of measurement, in contrast to traditional qualitative methods.
In this research, we want to measure the average members, average distance, and average interaction time of people. Our hypothesis is that human interaction before the covid curfew would affect the number of people interacting. Also, measure interaction depending on exogenous variables such as weather or political demonstrations.
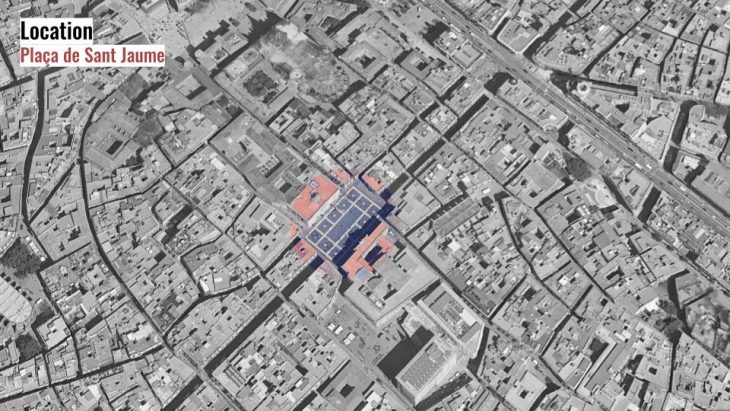
We chose St Jaume square due to its open space, high dynamism, and its important role in Barcelona city life.
-In order to answer our hypothesis, we recorded 6 videos; 3 before and 3 after the curfew.
-Next, we prepared data using Python and QGIS – change the perspective view to bird’s eye perspective.
-We mapped all the detected objects, filtered people and umbrellas (on the first video it was raining, and computer vision detects umbrellas instead of people)
-Next was to check the distance people distance (which helped us to divide them into individuals and groups).
-For the groups, we checked some parameters ( like the distance between the people, time of interaction, and the number of members in the group).
-As a final step we put all these parameters into a matrix, to see the statistics of the results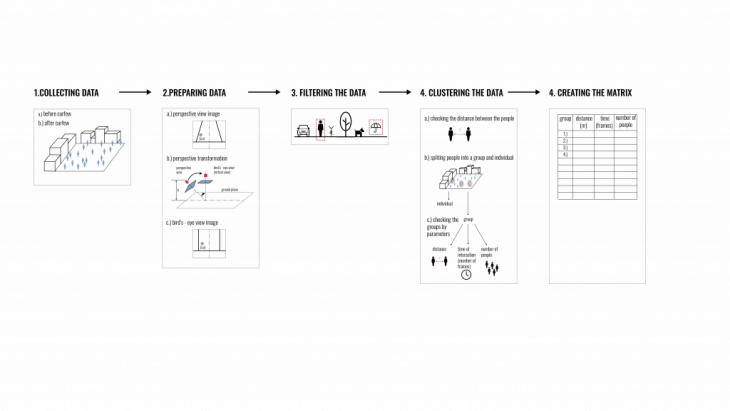
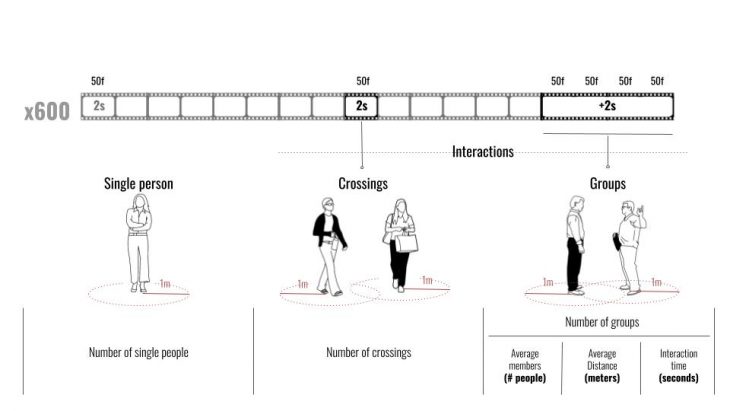
-The data collection process consisted of saving every 50th frame from the video. Most of our videos were 20 minutes long so we have 600 frames per video.
After detecting people we assigned them a 1 m radius from the center. When the circles overlapped it detected it as an interaction. If the interaction lasted more than 2 frames, we consider it as a group. Within the groups, we were checking, as mentioned before, the number of people, time of interaction, and the average distance between the people inside the groups. After collecting those data from our 6 videos we took the average from each video to compare the data and conclude it.
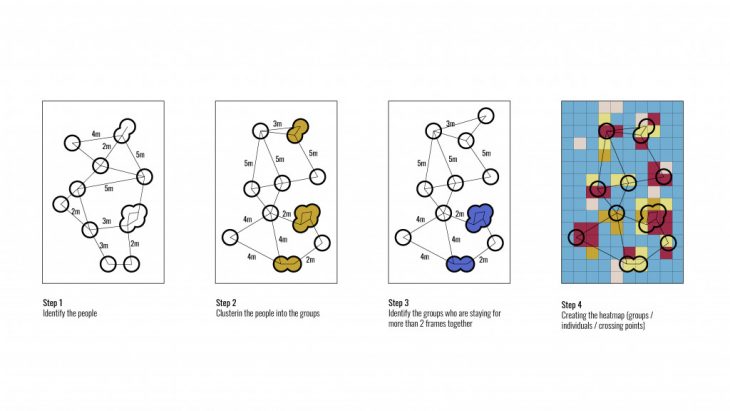
Having filtered the people, we start to measure the distances between the people to create clusters of groups. From there we use the time factor to identify the groups of people that are actually staying together and not just passing by at a close distance, once these groups are detected we create a heatmap to understand the areas in which people move in groups. After having categorized the people that move in groups, or are passing by and people that move individually we track their movement along with the frames over time, and in this particular case we are also clustering the groups by their size.
And this process was repeated across all 6 videos, analyzing the total number of people, no, of groups, the total number of people in these groups, and number of crossings. Also from the 6 videos, the first 3 are from before the curfew ended and the last 3 after in order to make a comparative analysis at the end.
Conclusion
From the previous analysis on the spatial distribution of our groups, we conclude that there is no significant difference before and after the curfew period. There is a preference for the central area of the plaza and the one next to the building facade on the south side between Carrer de Ferran and Carrer del Call, where an old coffee shop is located.
After extracting the main data from each of the videos recorded, we see that even though the average occupancy of the square was higher before the 8th of May, the number of interactions between pedestrians increased after the curfew ends. Even if the number of groups of people gathering together has not increased that much, their total number of members grows, staying closer and longer (almost 3 seconds more on average).
We think this research could be applied to other squares, providing information about how people gather, what are the places to stay, what are the places to move, and overall it could provide a specific aggregation pattern to each of them. Crossing these patterns with some other morphological and spatial data, it could be possible to categorize squares according to their aggregation pattern and support the way in which public spaces can be designed and activated.
Interaction Evaluation Tool is a project of IAAC, Institute for Advanced Architecture of Catalonia developed at Master in City & Technology in 2020/21 by students:Alvaro Cerezo, Marta Galdys,Nadh Ha Naseer, Juan Pablo Pintado, Riccardo Palazzolo and faculty: Aldo Sollazzo, Iacopo Neri & Soroush Garivani.