Project made by:
- Burak Paksoy
- Monika Filipova
- Lina Salamanca
- Luis Bonilla
Tutors and assistants:
- Guillem Camprodon
- Angel Muñoz
To explore the world of data visualization, we wanted to experiment with two types of virtual connections in the IaaC. One on the number of people using WiFi and on the other hand people who do tweet with the hashtag IAAC (#IAAC).
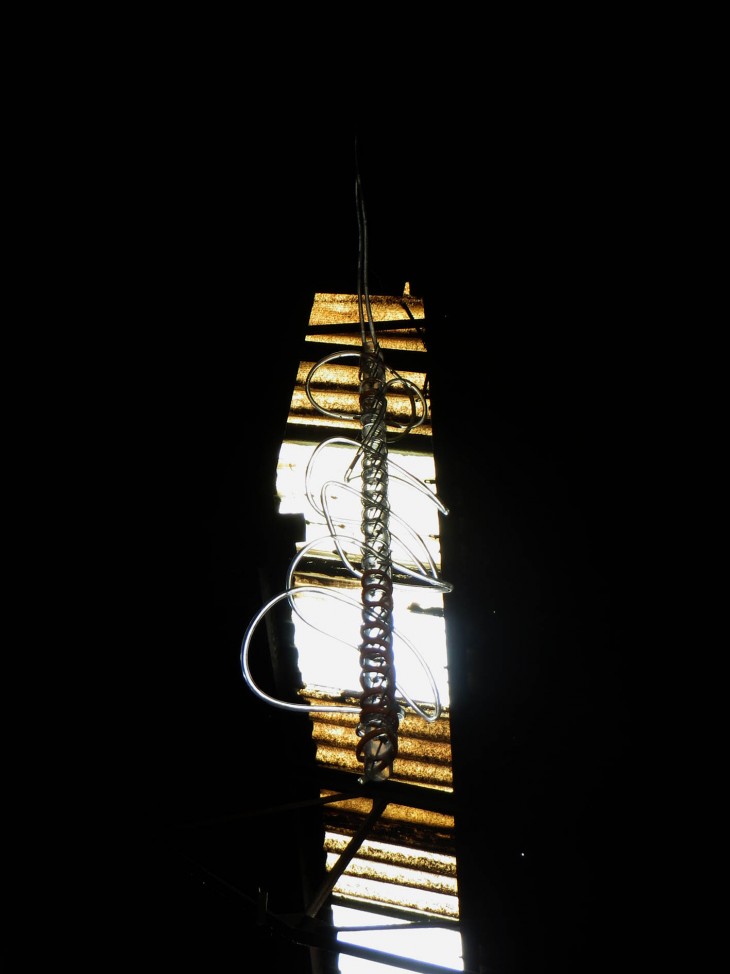
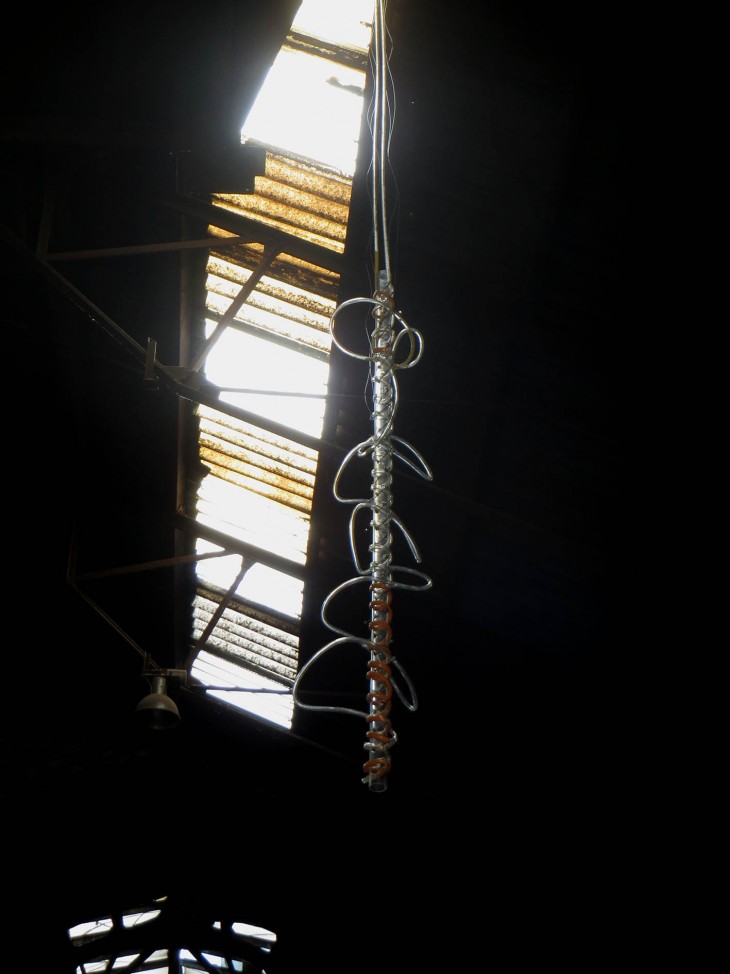
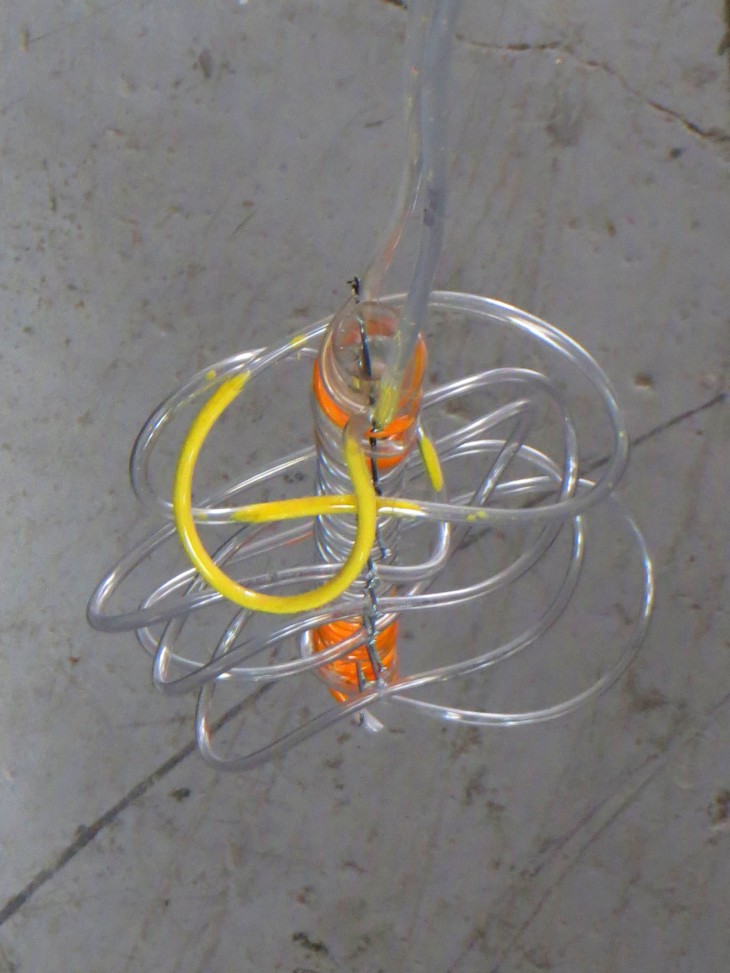
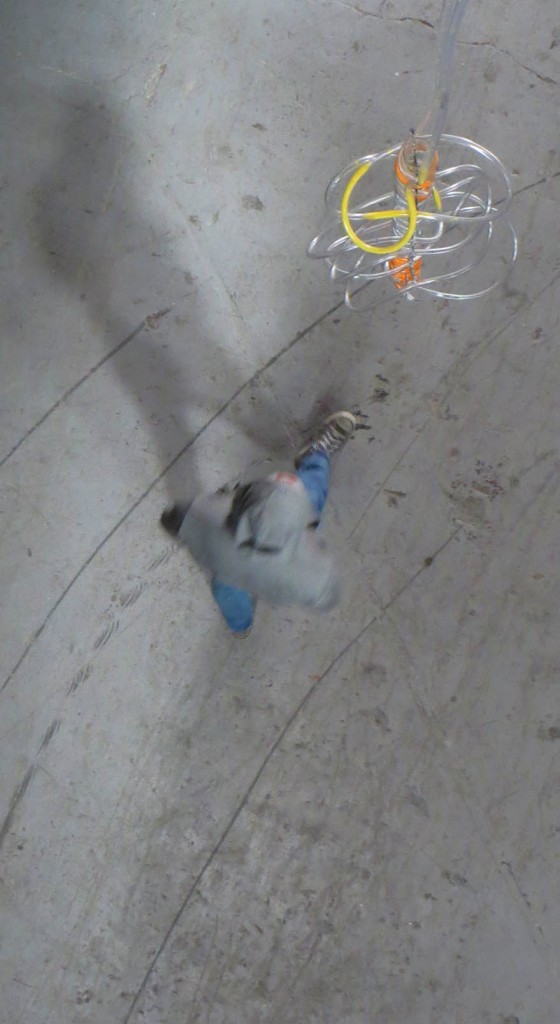
For these two distinct values we built a cylindrical device of 120 cm length and 10 cm in diameter made with acrylic hoses parallel and cross plastic (which represented the two inputs) represented with two different colors. These were connected to two water pumps that were activated when a new network connection WiFi IaaC or when a tweet is generated with #IaaC was received. Being able to compare different colors and two types of virtual interaction in one place and in real time.